by Agustín | May 18, 2020 | Monitoring, Percona Software
Two years ago, we showed how to use a different mount point on Percona Monitoring and Management (PMM) Docker deployments, in case you need to have data stored out of the default Docker paths. We have released PMM version 2 since, and the need for these steps is still...
by Andrii Skomorokhov | Apr 13, 2020 | Monitoring, Percona Software
Django is a fantastic tool to quickly create an admin dashboard for managing entities. But the magic of brevity oftentimes comes at the expense of suboptimal performance. The Django ORM is a coin with two sides. It simplifies work with complex datasets and makes it...
by Alexey Palazhchenko | Mar 23, 2020 | Monitoring, Percona Software
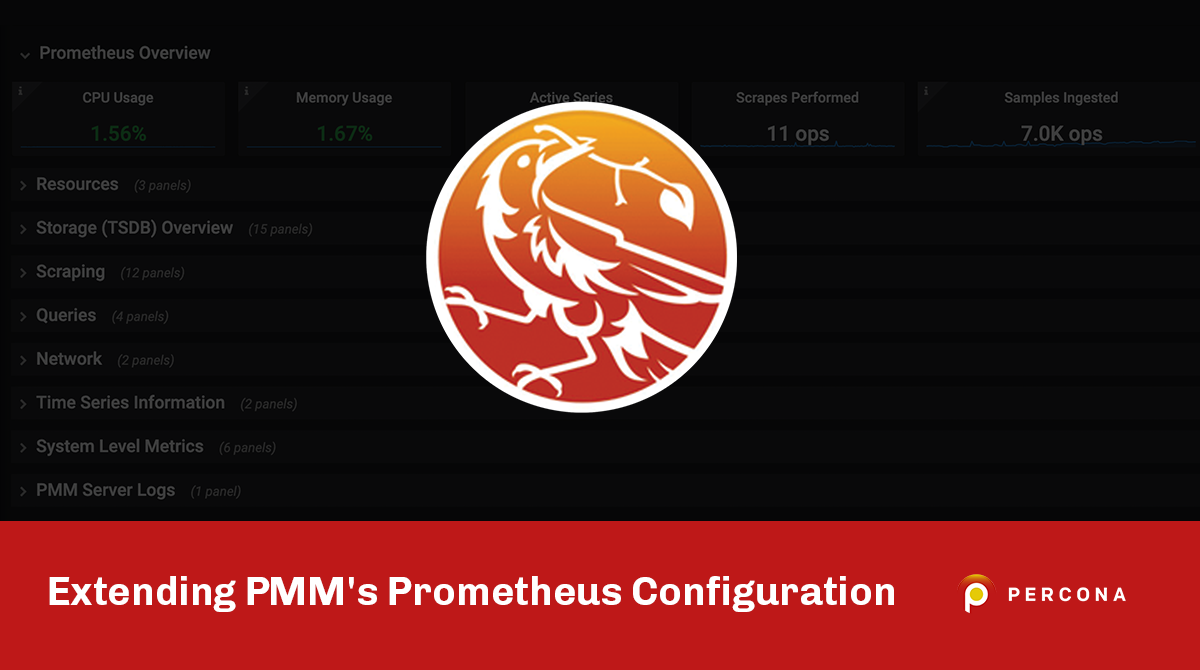
Percona Monitoring and Management 2.4.0 (PMM), released several days ago, added support for custom extensions of the Prometheus configuration file. Before explaining what that is and how to use it, let me tell you a bit of history. PMM 1.4.0, released 2.5 years ago,...
by David Quilty | Mar 18, 2020 | Monitoring, Percona Software, Webinars
Planning for your next high traffic event? If your databases need to be running at peak performance with no downtime – this webinar is for you. Prepare for High Traffic Events (HTE) such as Black Friday, Cyber Monday, or any peak your organization manages. Learn...
by Alexey Palazhchenko | Mar 12, 2020 | Monitoring, Percona Software
My boss asked me if there is a way to wait for the Percona Monitoring and Management (PMM) Server container to be fully ready so his automation script can start adding monitoring instances. I wanted to give him a general solution, not a PMM-specific one. Turned out,...
by Vadim Yalovets | Mar 12, 2020 | Monitoring, Percona Software, PostgreSQL
This blog post is about how you can gain detailed information in Percona Monitoring and Management (PMM2) of PostgreSQL disk usage. We take a look at using a catalog called pg_class, which catalogs tables and most everything else that has columns or is otherwise...
by Peter Zaitsev | Feb 28, 2020 | Monitoring, MySQL, Percona Software
There are a lot of things I love about Prometheus; its data model is fantastic for monitoring applications and PromQL language is often more expressive than SQL for data retrieval needs you have in the observability space. One thing, though, I hate about Prometheus...
by Terri Schlosser | Feb 26, 2020 | Monitoring, Percona Software
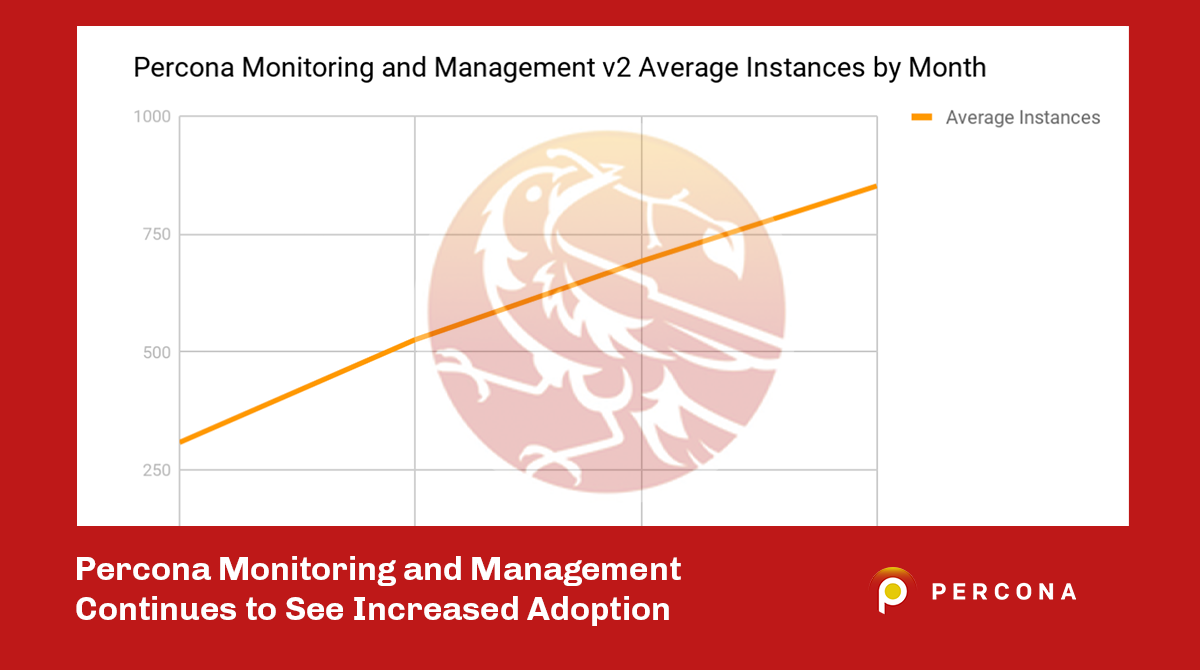
As a new member of the Percona team, one of the first things I was interested in understanding was our software adoption. I decided to take a look at the information we have about adoption (instances running) of Percona Monitoring and Management (PMM) and found some...
by Steve Hoffman | Feb 21, 2020 | Monitoring, Percona Software
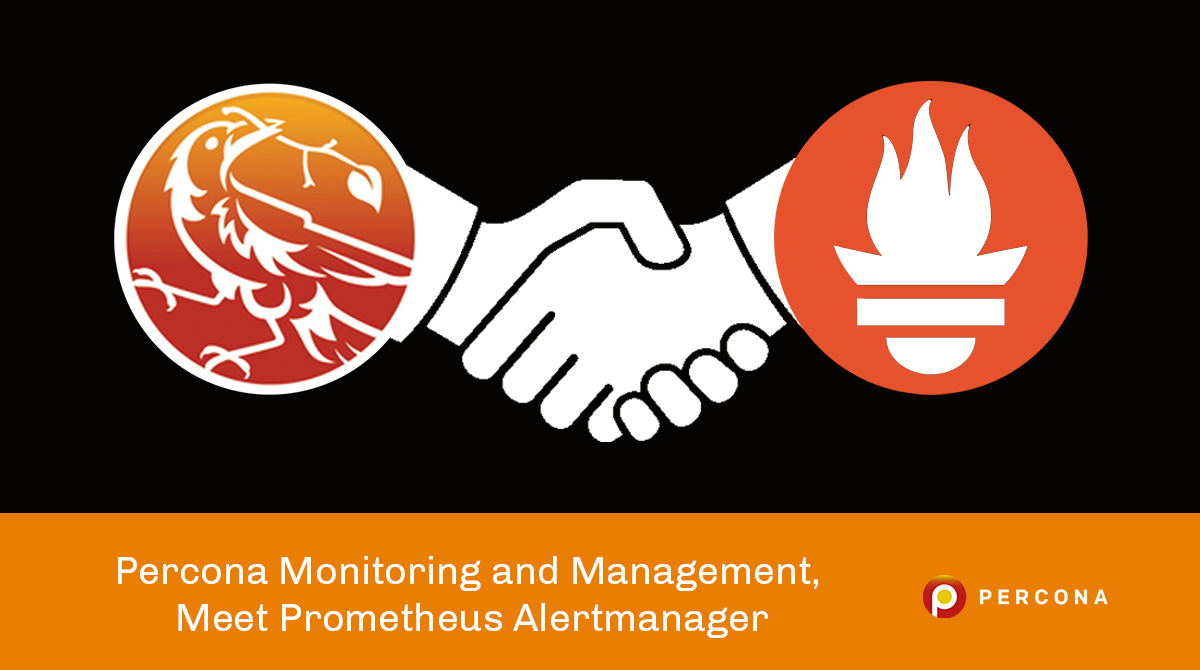
One of the requests we get most often on the Percona Monitoring and Management (PMM) team is “Do you support alerting?” The answer to that question has always been “Yes” but the feedback on how we offered it natively was that it was, well, not...
by Roma Novikov | Feb 11, 2020 | Cloud, Monitoring, Percona Software
We recently released Percona Monitoring and Management (PMM) version 2.2 and as part of this release, we made it available on the AWS Marketplace. In this blog post, I’ll explain how to find PMM in the AWS marketplace and how to install it. It is important to...
by Peter Zaitsev | Jan 15, 2020 | Monitoring, Percona Software
April 2021 Update: From Percona Monitoring and Management 2.27, the procedure is now simplified and it is possible by running: docker exec pmm-server change-admin-password <new_password> 1 docker exec pmm-server change-admin-password <new_password> ...
by Vadim Yalovets | Nov 27, 2019 | Monitoring, Percona Services, Percona Software
Want to try out Percona Monitoring and Management 2 (PMM 2) but you’re not ready to turn off your PMM 1 environment? This blog is for you! Keep in mind that the methods described are not intended to be a long-term migration strategy, but rather, simply a way to...
by Peter Zaitsev | Nov 22, 2019 | Monitoring, MySQL, Percona Software
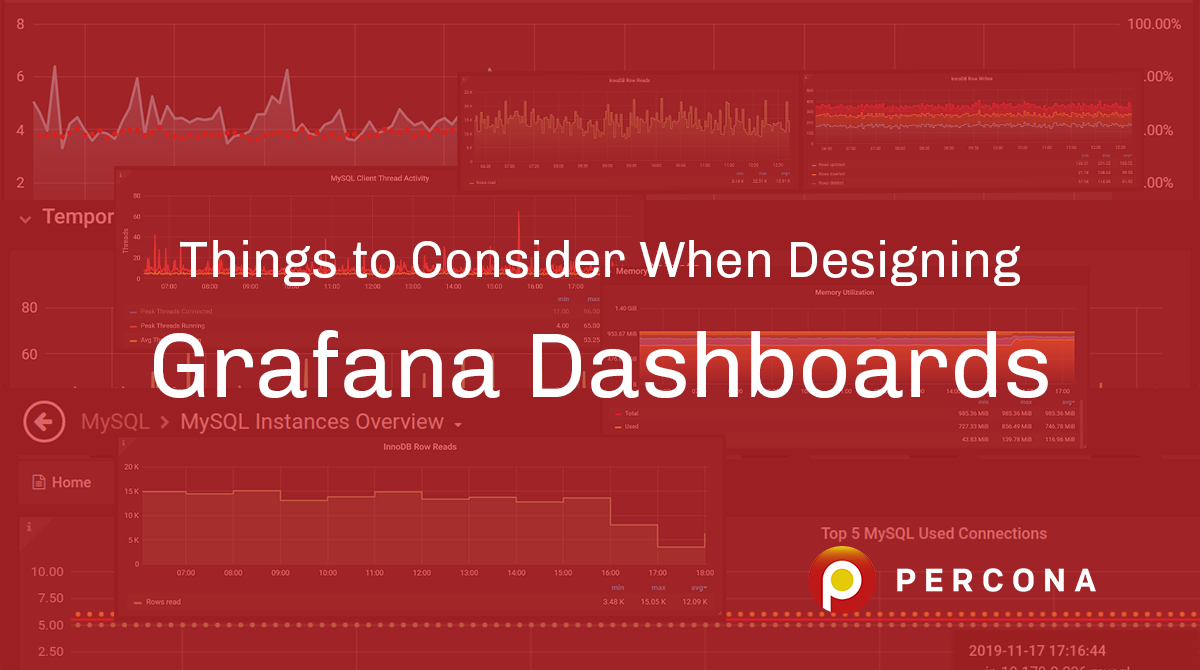
As Grafana powers our star product – Percona Monitoring and Management (PMM) – we have developed a lot of experience creating Grafana Dashboards over the last few years. In this article, I will share some of the considerations for designing Grafana...
by Dmitriy Kostiuk | Oct 9, 2019 | Monitoring, Percona Software
Percona Monitoring and Management (PMM) is a free and open-source platform for managing and monitoring your database performance. You can run PMM in your own environment for maximum security and reliability. It provides thorough time-based analysis for MySQL®,...
by Dmitriy Kostiuk | Sep 19, 2019 | Monitoring, Percona Software
Percona Monitoring and Management (PMM) is a free and open-source platform for managing and monitoring MySQL®, MongoDB®, and PostgreSQL® performance. You can run PMM in your own environment for maximum security and reliability. It provides thorough time-based analysis...
by Dmitriy Kostiuk | Sep 19, 2019 | Monitoring, Percona Software
We are pleased to announce the General Availability of PMM2, our latest software release! Created specifically to support open source software users, Percona Monitoring and Management (PMM) is a leading, free, open-source platform that allows you to actively manage...
by Dmitriy Kostiuk | Sep 9, 2019 | Monitoring, Percona Software
We are pleased to announce our 7th Beta release of PMM 2! Percona Monitoring and Management (PMM) is a free and open-source platform for managing and monitoring MySQL, MongoDB, and PostgreSQL performance. This release includes the following improvements: Query...
by Dmitriy Kostiuk | Jul 22, 2019 | Percona Software
We are pleased to announce our 4th Beta release of PMM 2! PMM (Percona Monitoring and Management) is a free and open-source platform for managing and monitoring MySQL, MongoDB, and PostgreSQL performance. With this release we’ve made the following improvements...
by Vinodh Krishnaswamy | Jul 5, 2018 | MongoDB, Percona Software
In this blog, we will see how to configure Percona Monitoring and Management (PMM) monitoring for a MongoDB cluster. It’s very simple, like adding a replica set or standalone instances to PMM Monitoring. For this example, I have used docker to create PMM Server...
by Adamo Tonete | Mar 2, 2018 | Insight for DBAs, MongoDB, Monitoring, Percona Software
In this blog post, we will discuss how to use Percona Monitoring and Management for MongoDB monitoring, and how to get some key graphs to monitor your MongoDB database. All production environments need metrics and historical data for easy and fast comparison of...