
 We are pleased to announce the General Availability of PMM2, our latest software release!
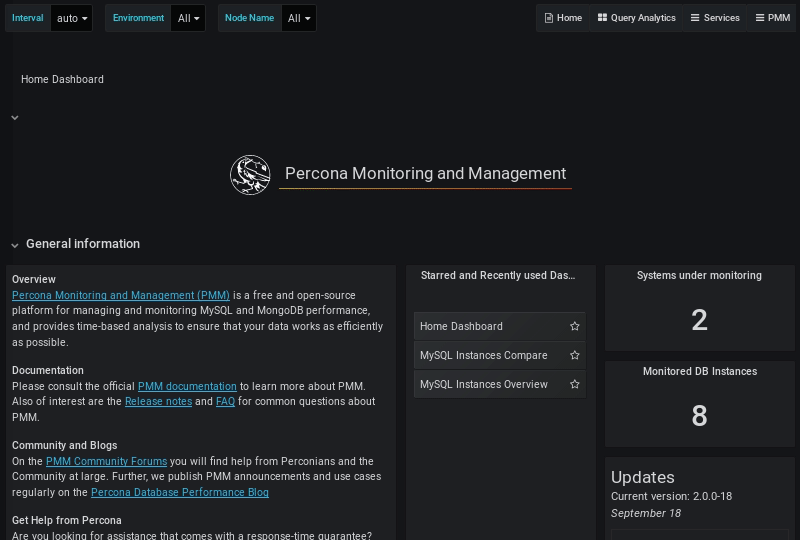
Created specifically to support open source software users, Percona Monitoring and Management (PMM) is a leading, free, open-source platform that allows you to actively manage and monitor the performance of your MySQL, MongoDB, and PostgreSQL database environments.
A recent Percona survey revealed that 41% of enterprises are running databases on multiple cloud providers and 61% of enterprises are running a combination of hybrid on-premises and cloud setups. Additionally, 92% of companies surveyed have more than one database in their environment, and 89% run more than one open-source database. Complex, multi-database, hybrid, and multi-cloud environments are a reality for many companies.
PMM provides a single pane of glass to manage your complex database environments in public, private, or on-premise environments. Our award-winning database monitoring tool has been built by database performance and scalability experts using best-of-breed tools. It is specifically designed to help DBAs and developers gain deep insight into their applications and databases and is used by thousands of organizations around the globe.
PMM allows users to do the following:
Our new PMM2 release introduces a number of enhancements and additional feature improvements, including:
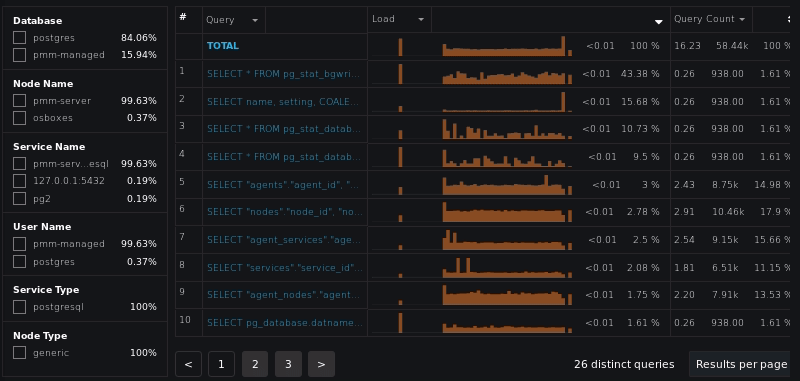
In response to demand, we’ve invested a lot of effort into bringing you an enhanced Query Analytics experience. With Query Analytics you’re able to examine the queries consuming the most amount of time across your entire fleet of servers, and then using filters and labels, drill down to find and isolate problematic queries requiring additional review. We’ve also added several long-awaited features such as:
There is a filtering panel on the left, or use the search by bar to set filters using key:value syntax. For example, drill down to review just the queries related to pg2 service:
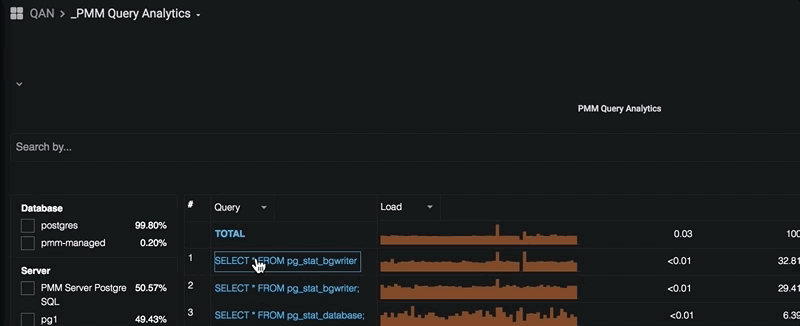
…or the detailed information about the selected query:
PMM2 has the new taxonomy of the dashboards, which are now split up into the following groups:
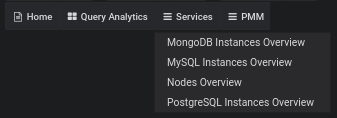
Along with this rearrangement, we have a new simplified main menu. Below is the new look for its top-level:
Selecting a specific service (MySQL, MongoDB, PostgreSQL, etc.) will guide you to the next level of the hierarchy, where you can access a Service Compare Dashboard or one of the Details Dashboards related to this Service:
One of the most important navigational changes we’re making with PMM is how we approach visualizing your servers. We are calling these the Service-level dashboards and they are designed to give you a high-level overview of your fleets of servers by type of service. These dashboards provide summaries of important characteristics such as; number of Virtual CPUs, total disk space, number of instances, and more.
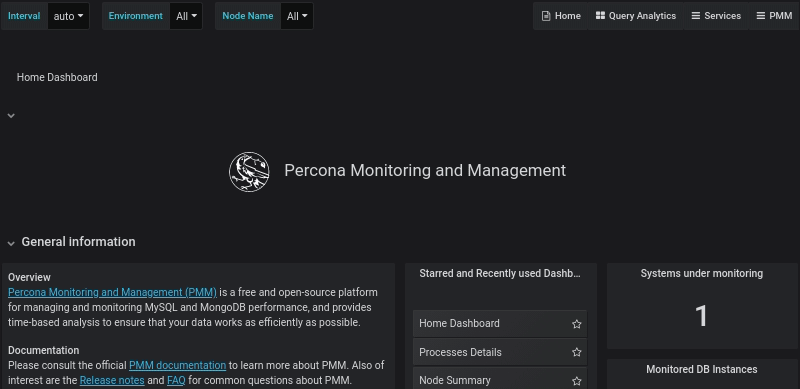
In the example below we show how you can navigate from the home dashboard to the MySQL Service dashboard, and then drill down to compare multiple nodes against each other:
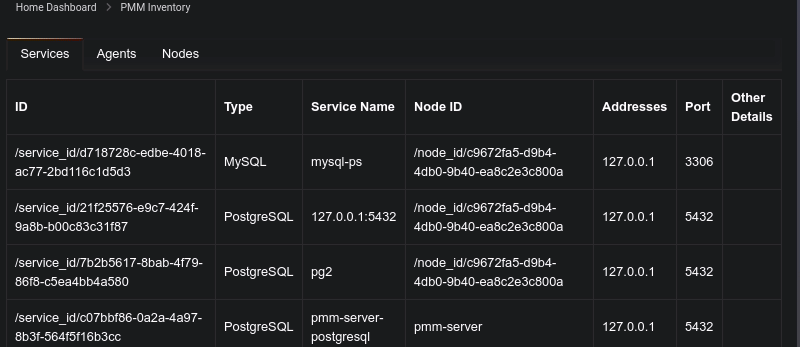
PMM2 introduces a new data model, on which all objects visible to PMM are either nodes, services, or agents. These three types of objects together form an established hierarchy with Node at the top, then Service and Agents assigned to a Node. Using the new PMM Inventory Dashboard, you’ll be able to review associated objects to PMM Server. This dashboard contains three tabs for nodes, agents, and services:
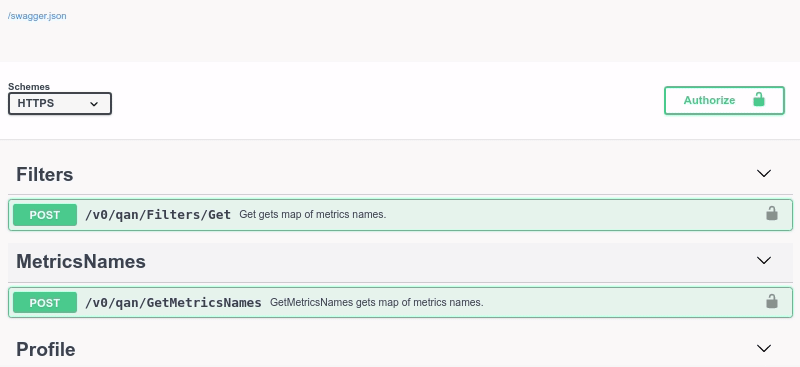
We are pleased to provide an API which enables PMM to be used more easily and simply with popular configuration management tools such as Ansible, Chef, and Puppet. This API lets you programatically interact with PMM Server so that you can list, add, and remove services.
You can browse, explore, and even test the API using Swagger:
Using the API to execute commands is simple. The following example shows how to get a list of Nodes from PMM Server:
|
1 2 3 4 5 6 7 8 9 10 11 12 13 14 15 16 17 18 |
$ curl -k -u admin:admin -X POST "https://192.168.1.3/v1/inventory/Nodes/List" { "generic": [ { "node_id": "/node_id/c9672fa5-d9b4-4db0-9b40-ea8c2e3c800a", "node_name": "osboxes", "address": "10.0.2.15", "machine_id": "/machine_id/8b5f6f78e736e3e29ba6f1505c797297", "distro": "linux" }, { "node_id": "pmm-server", "node_name": "pmm-server", "address": "127.0.0.1" } ] } |
We welcome any thoughts, comments, and suggestions you have on this latest software version.
Percona offers a range of open source software and services to help your business thrive and grow. Organizations interested in ensuring their databases perform at the highest level can also benefit from Percona Managed Services, Support, and Consulting.
To learn how Percona can help you make the most of your data, please contact us at 1-888-316-9775 or 0-800-051-8984 in Europe, or email [email protected]
Resources
RELATED POSTS


How can I up
How can I upgrade the current pmm server to pmm2?
you can’t upgrade, have a look at the installation guide: “To use PMM2 you will need to remove any earlier versions of PMM Server and Client as there is no in-place upgrade path for historical data, and then download and run our latest software.”
Thank you for your work! I’m using this tool very often for my daily work.