
 Want to try out Percona Monitoring and Management 2 (PMM 2) but you’re not ready to turn off your PMM 1 environment? This blog is for you! Keep in mind that the methods described are not intended to be a long-term migration strategy, but rather, simply a way to deploy a few clients in order to sample PMM 2 before you commit to the upgrade. 🙂
Here are step-by-step instructions for deploying PMM 1 & 2 client functionality i.e. pmm-client and pmm2-client, on the same host.
The first few steps are already described in our PMM1 documentation so we are simply providing links to those documents. Here we’ll focus on steps 4 and 5.
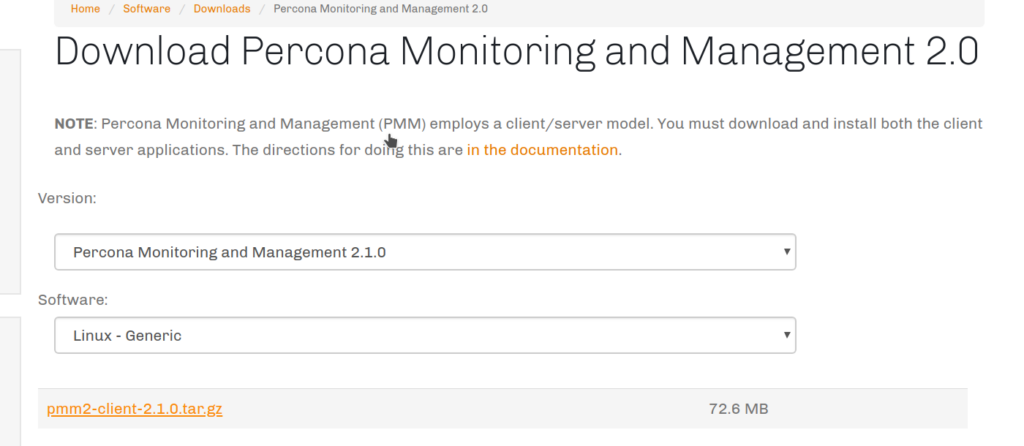
It’s not possible to install both clients from a repository at the same time. So you’ll need to download a tarball of pmm2-client. Here’s a link to the latest version directly from our site.
* Note that depending on when you’re seeing this, the commands below may not be for the latest version, so the commands may need to be updated for the version you downloaded.
|
1 |
$ wget https://www.percona.com/downloads/pmm2/2.1.0/binary/tarball/pmm2-client-2.1.0.tar.gz |
|
1 2 |
$ tar -zxvf pmm2-client-2.1.0.tar.gz $ cd pmm2-client-2.1.0 |
Now it’s time to set up a PMM 2 client. In our example, the PMM2 server IP is 172.17.0.2 and the monitored host IP is 172.17.0.1.
|
1 2 3 4 5 6 7 8 |
$ ./bin/pmm-agent setup --config-file=config/pmm-agent.yaml --paths-node_exporter="$PWD/bin/node_exporter" --paths-mysqld_exporter="$PWD/bin/mysqld_exporter" --paths-mongodb_exporter="$PWD/bin/mongodb_exporter" --paths-postgres_exporter="$PWD/bin/postgres_exporter" --paths-proxysql_exporter="$PWD/bin/proxysql_exporter" --server-insecure-tls --server-address=172.17.0.2:443 --server-username=admin --server-password="admin" 172.17.0.1 generic node8.ca |
Let’s run the pmm-agent using a screen. There’s no service manager integration when deploying alongside pmm-client, so if your server restarts, pmm-agent won’t automatically resume.
|
1 |
# screen -S pmm-agent |
|
1 |
$ ./bin/pmm-agent --config-file="$PWD/config/pmm-agent.yaml" |
|
1 2 3 4 5 6 |
$ ./bin/pmm-admin list Service type Service name Address and port Service ID Agent type Status Agent ID Service ID pmm-agent connected /agent_id/805db700-3607-40a9-a1fa-be61c76fe755 node_exporter running /agent_id/805eb8f6-3514-4c9b-a05e-c5705755a4be |
Detach the screen, then add the mysql service:
|
1 2 3 4 |
$ ./bin/pmm-admin add mysql --use-perfschema --username=root mysqltest MySQL Service added. Service ID : /service_id/28c4a4cd-7f4a-4abd-a999-86528e38992b Service name: mysqltest |
Here is the state of pmm-agent:
|
1 2 3 4 5 6 7 8 9 |
$ ./bin/pmm-admin list Service type Service name Address and port Service ID MySQL mysqltest 127.0.0.1:3306 /service_id/28c4a4cd-7f4a-4abd-a999-86528e38992b Agent type Status Agent ID Service ID pmm-agent connected /agent_id/805db700-3607-40a9-a1fa-be61c76fe755 node_exporter running /agent_id/805eb8f6-3514-4c9b-a05e-c5705755a4be mysqld_exporter running /agent_id/efb01d86-58a3-401e-ae65-fa8417f9feb2 /service_id/28c4a4cd-7f4a-4abd-a999-86528e38992b qan-mysql-perfschema-agent running /agent_id/26836ca9-0fc7-4991-af23-730e6d282d8d /service_id/28c4a4cd-7f4a-4abd-a999-86528e38992b |
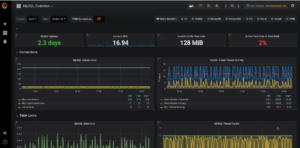
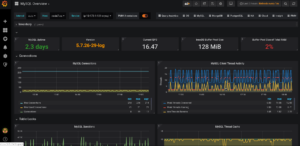
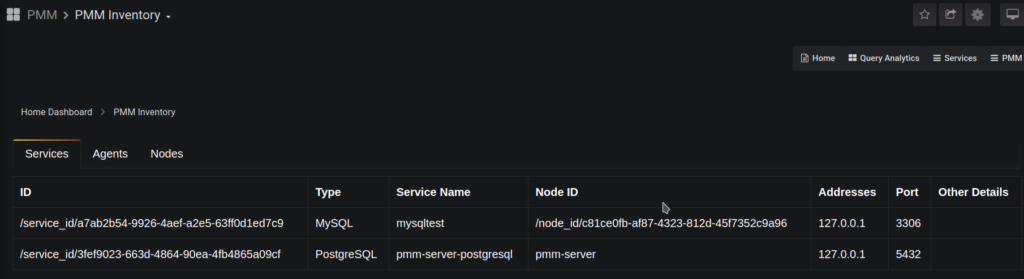
Confirm you can see activity in each of the two PMM Servers:
| PMM 1 | PMM 2 |
 |
 |
 |
 |
Once you’ve decided to move over completely to PMM2, it’s better to make a switch from the tarball version to installation from the repository. It will allow you to perform client updates much easier as well as register the new agent as a service for automatically starting with the server. Also, we will show you how to make a switch without re-adding monitored instances.
|
1 2 3 4 5 6 |
$ sudo yum install https://repo.percona.com/yum/percona-release-latest.noarch.rpm $ sudo percona-release disable all $ sudo percona-release enable original release $ yum list | grep pmm pmm-client.x86_64 1.17.2-1.el6 percona-release-x86_64 pmm2-client.x86_64 2.1.0-1.el6 percona-release-x86_64 |
Here is a link to the apt variant.
|
1 |
yum remove pmm-client |
|
1 2 3 4 5 6 7 8 9 10 11 |
$ yum install pmm2-client Loaded plugins: priorities, update-motd, upgrade-helper 4 packages excluded due to repository priority protections Resolving Dependencies --> Running transaction check ---> Package pmm2-client.x86_64 0:2.1.0-5.el6 will be installed ... Installed: pmm2-client.x86_64 0:2.1.0-5.el6 Complete! |
Let’s copy the currently used pmm2-client configuration file in order to omit re-adding monitored instances.
|
1 |
$ cp pmm2-client-2.1.0/config/pmm-agent.yaml /tmp |
It’s required to set the new location of exporters (/usr/local/percona/pmm2/exporters/) in the file.
|
1 2 3 4 5 |
$ sed -i 's|node_exporter:.*|node_exporter: /usr/local/percona/pmm2/exporters/node_exporter|g' /tmp/pmm-agent.yaml $ sed -i 's|mysqld_exporter:.*|mysqld_exporter: /usr/local/percona/pmm2/exporters/mysqld_exporter|g' /tmp/pmm-agent.yaml $ sed -i 's|mongodb_exporter:.*|mongodb_exporter: /usr/local/percona/pmm2/exporters/mongodb_exporter|g' /tmp/pmm-agent.yaml $ sed -i 's|postgres_exporter:.*|postgres_exporter: /usr/local/percona/pmm2/exporters/postgres_exporter|g' /tmp/pmm-agent.yaml $ sed -i 's|proxysql_exporter:.*|proxysql_exporter: /usr/local/percona/pmm2/exporters/proxysql_exporter|g' /tmp/pmm-agent.yaml |
The default configuration file has to be replaced by our file and the service pmm-agent has to be restarted.
|
1 2 |
$ cp /tmp/pmm-agent.yaml /usr/local/percona/pmm2/config/ $ systemctl restart pmm-agent |
So now we can verify the current state of monitored instances.
|
1 |
$ pmm-admin list |
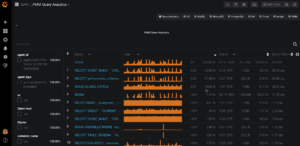
Also, it can be checked on PMM server-side.
Resources
RELATED POSTS


Hi
I installed PMM2
But i can’t add mysql agent, have error:
DEBUG 2019-12-16 16:15:23.107100383Z: HTTP/1.1 400 Bad Request
Transfer-Encoding: chunked
Trailer: Grpc-Trailer-Content-Type
Connection: keep-alive
Content-Type: application/json
Date: Mon, 16 Dec 2019 16:15:23 GMT
Server: nginx
be
{“error”:”Connection check failed: dial tcp 127.0.0.1:3306: connect: connection refused.”,”code”:9,”message”:”Connection check failed: dial tcp 127.0.0.1:3306: connect: connection refused.”}
0
DEBUG 2019-12-16 16:15:23.107172147Z: Result:
DEBUG 2019-12-16 16:15:23.107186033Z: Error: &my_sql.AddMySQLDefault{_statusCode:400, Payload:(*my_sql.AddMySQLDefaultBody)(0xc0005d9440)}
Connection check failed: dial tcp 127.0.0.1:3306: connect: connection refused.
Hi Kirill,
It looks like your server doesn’t allow access through the default mysql port 3306 or mysql service is configured on a different port. Could you check it and try with a different port?
e.g.
$ ./bin/pmm-admin add mysql myMySQLService 127.0.0.1:3307
Please notice that a service name has to be specify before an address
Hi Vadim, thanks for the info! couple of comments:
1. The section “Register and Generate Configuration File” have a problem: you are repeating the directory name in the path. For example, instead of “$PWD/pmm2-client-2.1.0/bin/node_exporter” it should be “$PWD/bin/node_exporter”. Full command fixed:
./bin/pmm-agent setup –config-file=config/pmm-agent.yaml
–paths-node_exporter=”$PWD/bin/node_exporter”
–paths-mysqld_exporter=”$PWD/bin/mysqld_exporter”
–paths-mongodb_exporter=”$PWD/bin/mongodb_exporter”
–paths-postgres_exporter=”$PWD/bin/postgres_exporter”
–paths-proxysql_exporter=”$PWD/bin/proxysql_exporter”
–server-insecure-tls –server-address=172.17.0.2:443
–server-username=admin –server-password=”admin” 172.17.0.1 generic node8.ca
2. And the other is that, if pmm-client (for PMM 1) is already running, the 42000 port is already in use and the PMM2 client will keep trying to connect to it but it won’t. The fix is to edit the config/pmm-agent.yaml and change the starting port. It will look like this:
ports:
min: 42005
max: 51999
Thank you for your comments. You are right.
ok, i found trouble, thanks
and have small question
why pmm2 don’t have option for connections on socket ?
It will be add in some later releases.
Hi, I always got waiting state no values are fetched to grafana
node_exporter waiting /agent_id/a7130b1a-cb43-499a-a0a3-e6d9840566dd
mysqld_exporter waiting /agent_id/5fcdf261-3e74-47ad-8196-76de02f7a63f /service_id/81584871-9ea0-4844-a414-2d989884986b
Hello Smit,
Could you make sure that exporters have the correct path in the configuration file pmm-agent.yaml?
It looks like pmm-agent can’t start exporters.
getting below while running two PMM agents
msg=”listen tcp :42000: bind: address already in use” source=”server.go:141″
Hi Rohit,
Please modify the ports range for exporters in the file pmm-agent.yaml
…
ports:
min: 42000
max: 51999
…