by Peter Zaitsev | Mar 25, 2020 | Monitoring, MySQL, Percona Software
Last week I did a webinar on MySQL Troubleshooting and Performance Optimization with Percona Monitoring And Management v2 (PMM2). There was a tremendous amount of interest and many more questions than I could answer, so I’m answering them in this blog post instead. Q:...
by Alexey Palazhchenko | Mar 23, 2020 | Monitoring, Percona Software
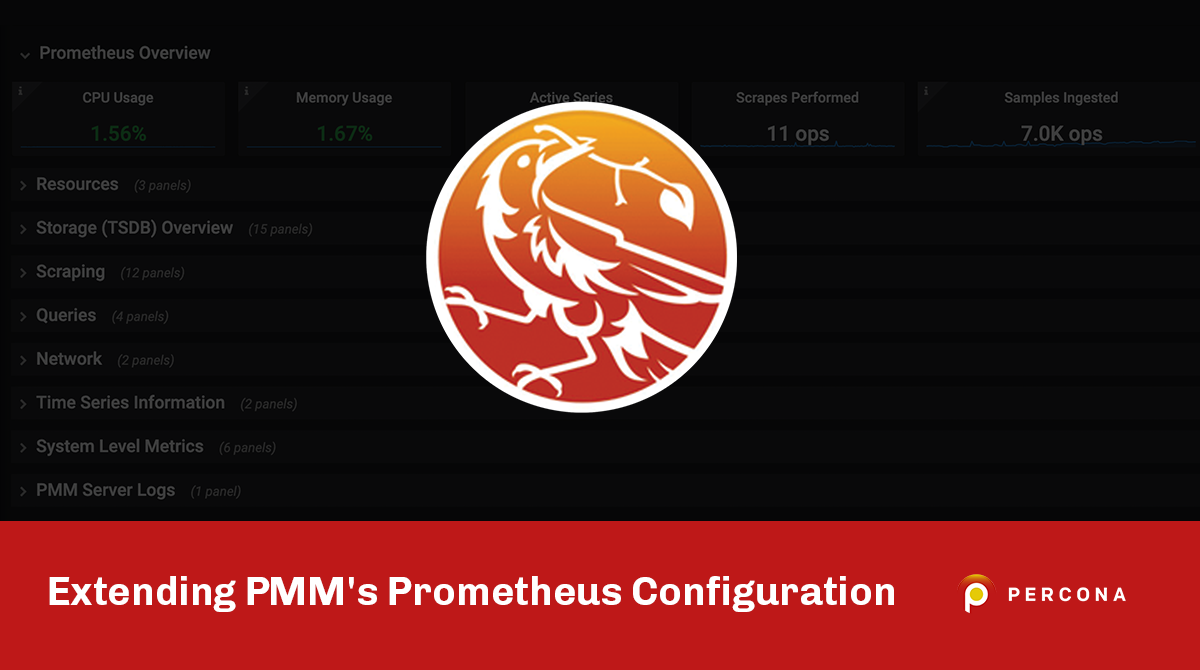
Percona Monitoring and Management 2.4.0 (PMM), released several days ago, added support for custom extensions of the Prometheus configuration file. Before explaining what that is and how to use it, let me tell you a bit of history. PMM 1.4.0, released 2.5 years ago,...
by David Quilty | Mar 18, 2020 | Monitoring, Percona Software, Webinars
Planning for your next high traffic event? If your databases need to be running at peak performance with no downtime – this webinar is for you. Prepare for High Traffic Events (HTE) such as Black Friday, Cyber Monday, or any peak your organization manages. Learn...
by Alexey Palazhchenko | Mar 12, 2020 | Monitoring, Percona Software
My boss asked me if there is a way to wait for the Percona Monitoring and Management (PMM) Server container to be fully ready so his automation script can start adding monitoring instances. I wanted to give him a general solution, not a PMM-specific one. Turned out,...
by David Quilty | Mar 4, 2020 | Monitoring, MySQL, Percona Software, Webinars
As a MySQL DBA, the databases powering your applications need to handle changing traffic workloads while remaining responsive and stable so you can deliver an excellent user experience. Optimizing MySQL performance and troubleshooting MySQL problems cost-efficiently...
by Peter Zaitsev | Feb 28, 2020 | Monitoring, MySQL, Percona Software
There are a lot of things I love about Prometheus; its data model is fantastic for monitoring applications and PromQL language is often more expressive than SQL for data retrieval needs you have in the observability space. One thing, though, I hate about Prometheus...
by Terri Schlosser | Feb 26, 2020 | Monitoring, Percona Software
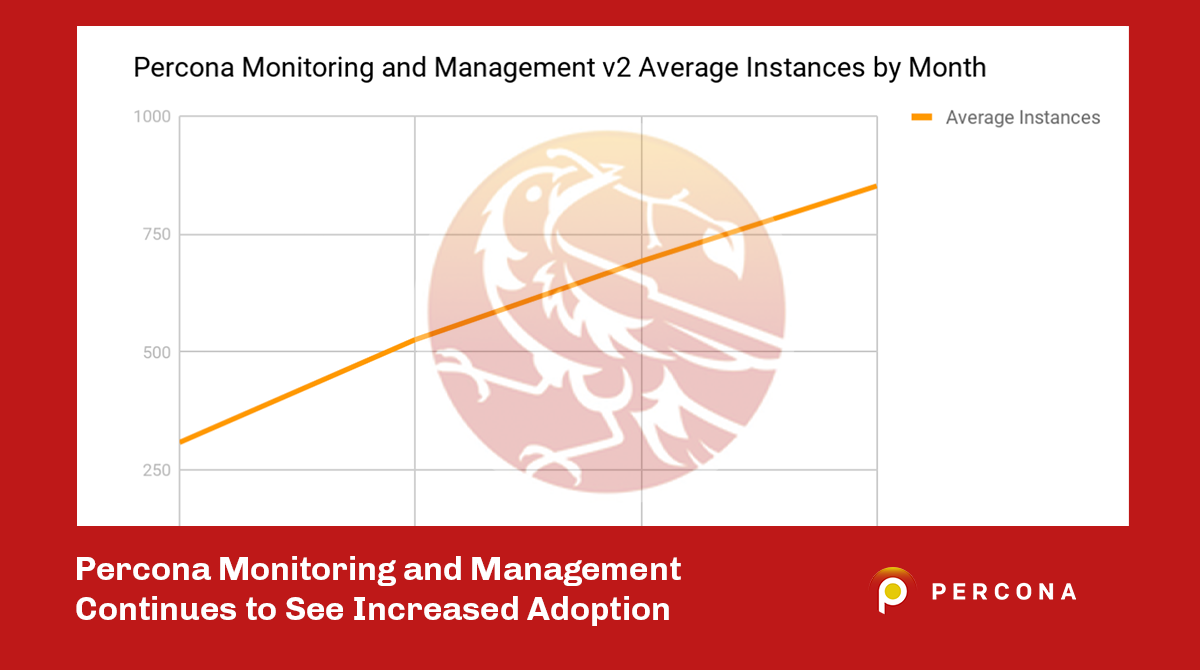
As a new member of the Percona team, one of the first things I was interested in understanding was our software adoption. I decided to take a look at the information we have about adoption (instances running) of Percona Monitoring and Management (PMM) and found some...
by Steve Hoffman | Feb 21, 2020 | Monitoring, Percona Software
One of the requests we get most often on the Percona Monitoring and Management (PMM) team is “Do you support alerting?” The answer to that question has always been “Yes” but the feedback on how we offered it natively was that it was, well, not...
by Roma Novikov | Feb 11, 2020 | Cloud, Monitoring, Percona Software
We recently released Percona Monitoring and Management (PMM) version 2.2 and as part of this release, we made it available on the AWS Marketplace. In this blog post, I’ll explain how to find PMM in the AWS marketplace and how to install it. It is important to...
by Peter Zaitsev | Jan 20, 2020 | Monitoring, MySQL, Percona Software
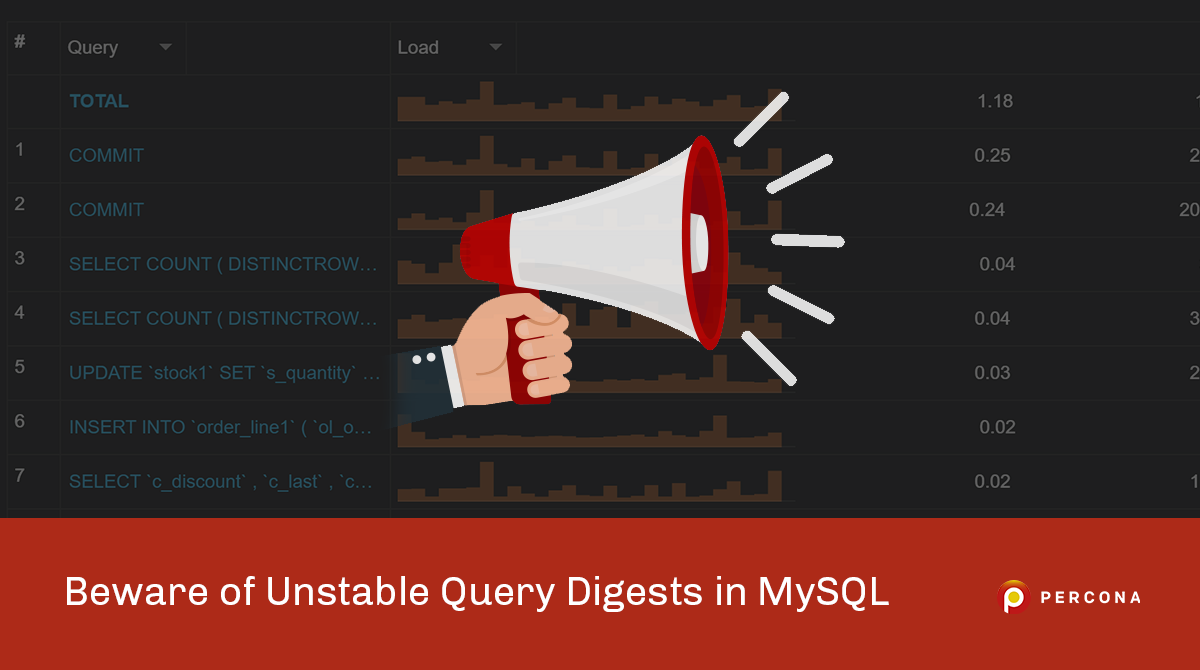
If you’re using MySQL’s Performance Schema you may use “query digests” as IDs to identify specific query patterns in the events_statements_summary_by_digest Performance Schema Table. You might assume these hashes are stable between different versions, so, for example,...
by Vinicius Grippa | Jan 8, 2020 | Monitoring, MySQL
Percona Monitoring and Management (PMM) has been on the road for a while now, and it brings exciting new features and improvements. For those who are not familiar with the tool, PMM allows deep insight into the performance of applications and databases. The most...
by Terri Schlosser | Jan 3, 2020 | Cloud, Monitoring, MySQL, Percona Software
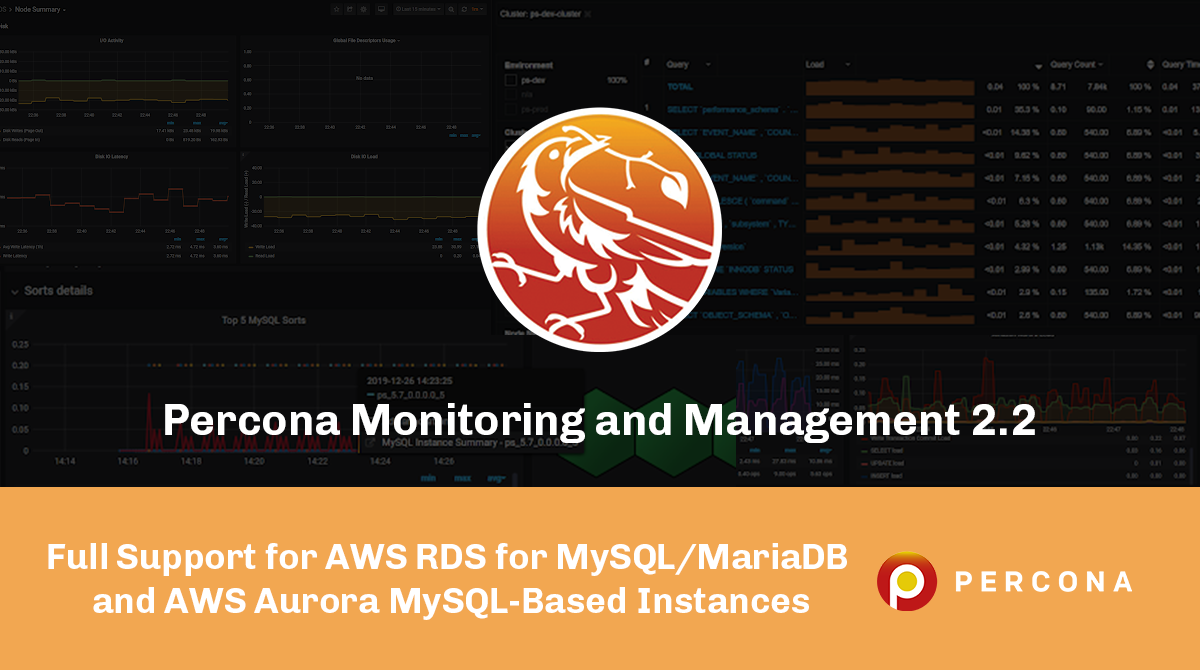
Percona Monitoring and Management 2.2 (PMM) was released on December 24th with new features and updates designed to help you more easily manage and monitor your open source databases across your multi-cloud and hybrid-cloud environments. Let’s take a look at a few of...
by Daniel Guzmán Burgos | Dec 19, 2019 | Monitoring, MySQL, Percona Software
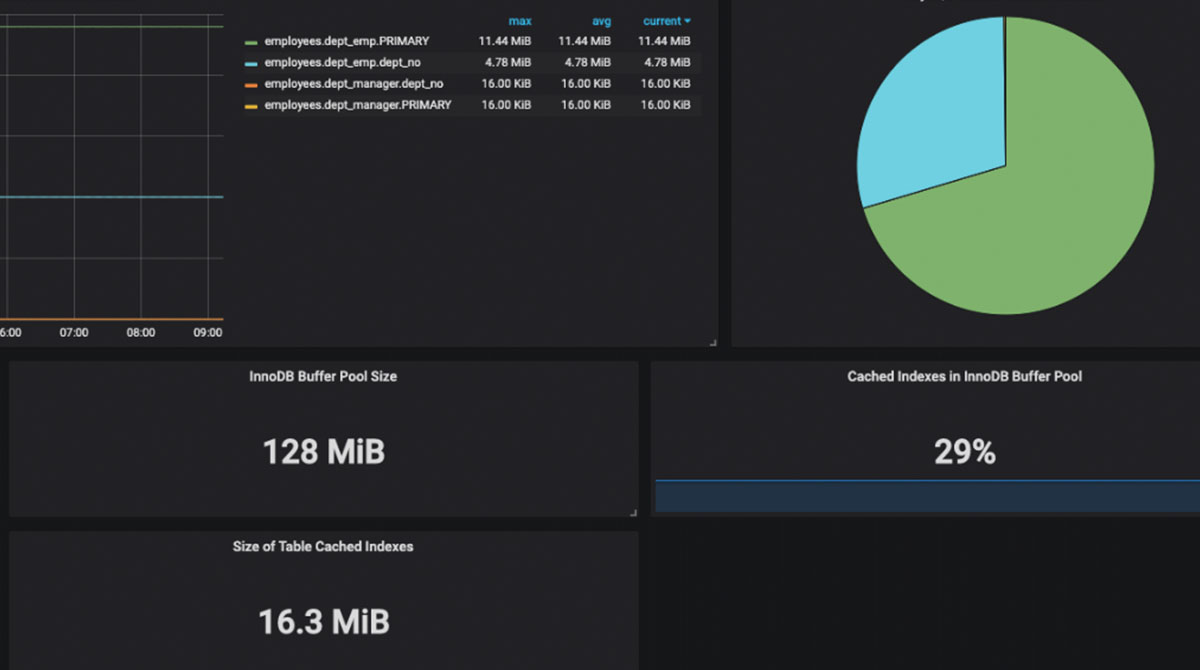
Percona Monitoring and Management (PMM) is built upon the shoulder of giants like Prometheus and Grafana. And speaking of Grafana, one of the coolest features that come with it is the ability to customize the experience through 3rd party plugins. Plugins are an easy...
by Peter Zaitsev | Sep 25, 2019 | Monitoring, Percona Software
As the saying goes, a picture is worth 1000 words – and this is why we don’t just talk about Percona Monitoring and Management (PMM) but also have a demo which allows you to explore many PMM features without having to install it. Though there is only so...
by Stephen Thorn | Sep 9, 2019 | Monitoring, MySQL, Percona Software, Storage Engine
One of the great things about working at Percona is the constant innovation that occurs as a result of a deep level of technical expertise. A more recent conversation about the Information Schema table: here. The README.md has installation instructions. Download the...
by Peter Zaitsev | May 7, 2018 | Insight for DBAs, Percona Software, Webinars
Please join Percona’s CEO, Peter Zaitsev as he presents MySQL Troubleshooting and Performance Optimization with PMM on Wednesday, May 9, 2018, at 11:00 AM PDT (UTC-7) / 2:00 PM EDT (UTC-4). Optimizing MySQL performance and troubleshooting MySQL problems are two of the...
by Borys Belinsky | Feb 27, 2018 | MySQL, Percona Events, Percona Software
The latest release of Percona Monitoring and Management (PMM) 1.8.0 is available as of February 27, 2018. Percona Monitoring and Management is a free and open-source platform for managing and monitoring MySQL and MongoDB performance. You can run PMM in your own...
by Tibor Korocz | Feb 27, 2018 | Insight for DBAs, MySQL, ProxySQL
In this blog post, I’ll look at how to catch slow and frequent queries with ProxySQL. More and more people are using ProxySQL because it is a great tool and it can help DBAs a lot. But many people do not realize that it is more powerful than it looks. It has...
by Peter Zaitsev | Feb 14, 2018 | MySQL
In this blog post, we’ll review additional Amazon Aurora MySQL monitoring capabilities we’ve added in Percona Monitoring and Management (PMM) 1.7.0. You can see them in action in the MySQL Amazon Aurora Metrics dashboard. Amazon Aurora MySQL Transaction...
by Nickolay Ihalainen | Feb 9, 2018 | Monitoring, Percona Software, PostgreSQL
In this article, we’ll describe how to collect PostgreSQL metrics with Percona Monitoring and Management (PMM). We designed Percona Monitoring and Management (PMM) to be the best tool for MySQL and MongoDB performance investigation. At the same time, it’s...