

This article is focused on describing the latest performance benchmarking executed on the latest releases of Community MySQL, Percona Server for MySQL and MariaDB.
In this set of tests I have used the machine described here.
Assumptions
There are many ways to run tests, and we know that results may vary depending on how you play with many factors, like the environment or the MySQL server settings. However, if we compare several versions of the same product on the same platform, it is logical to assume that all the versions will have the same “chance” to behave well or badly unless we change the MySQL server settings.
Because of this, I ran the tests changing only things in a consistent way, with the intent to give the same opportunity to each solution. There is a clear assumption that if you release your product based on the defaults, that implies you have tested with them and consider them the safest for generic use.
I also applied some modifications and ran the tests again to see how optimization would impact performance.
What tests do we run?
High level, I run one set of test:
- TPC-C (https://www.tpc.org/tpcc/) like
The full methodology and test details can be found here, while actual commands are available:
Why do I (normally) only publish TPC-C tests?
Well, I am, normally, more interested in testing scenarios that are closer to reality than a single function test as we normally do with sysbench.
This is it, while it is not possible to get the perfect benchmark test fitting all real usage, we need to keep in mind the rule of 80%.
If you use MySQL/InnoDB I expect that you will have an OLTP kind of traffic, more than Key/Value or else.
Given that while testing the single function, as we do with sysbench, it may be useful to identify regression points or so. To get the wide scenario, TPC-C is a better way to go, given it implies not only a more intense write load, TPC-C test is 50/50 r/w, but also a schema structure with relations, foreign keys and constraints. In short, it is closer to the common use of a relational database management system.
However, this time things are a bit different and to be fair I must dig a bit also in the Sysbench single tests. This is making this blog a bit longer than the previous ones, but I think it is worth it and you will see why.
Results
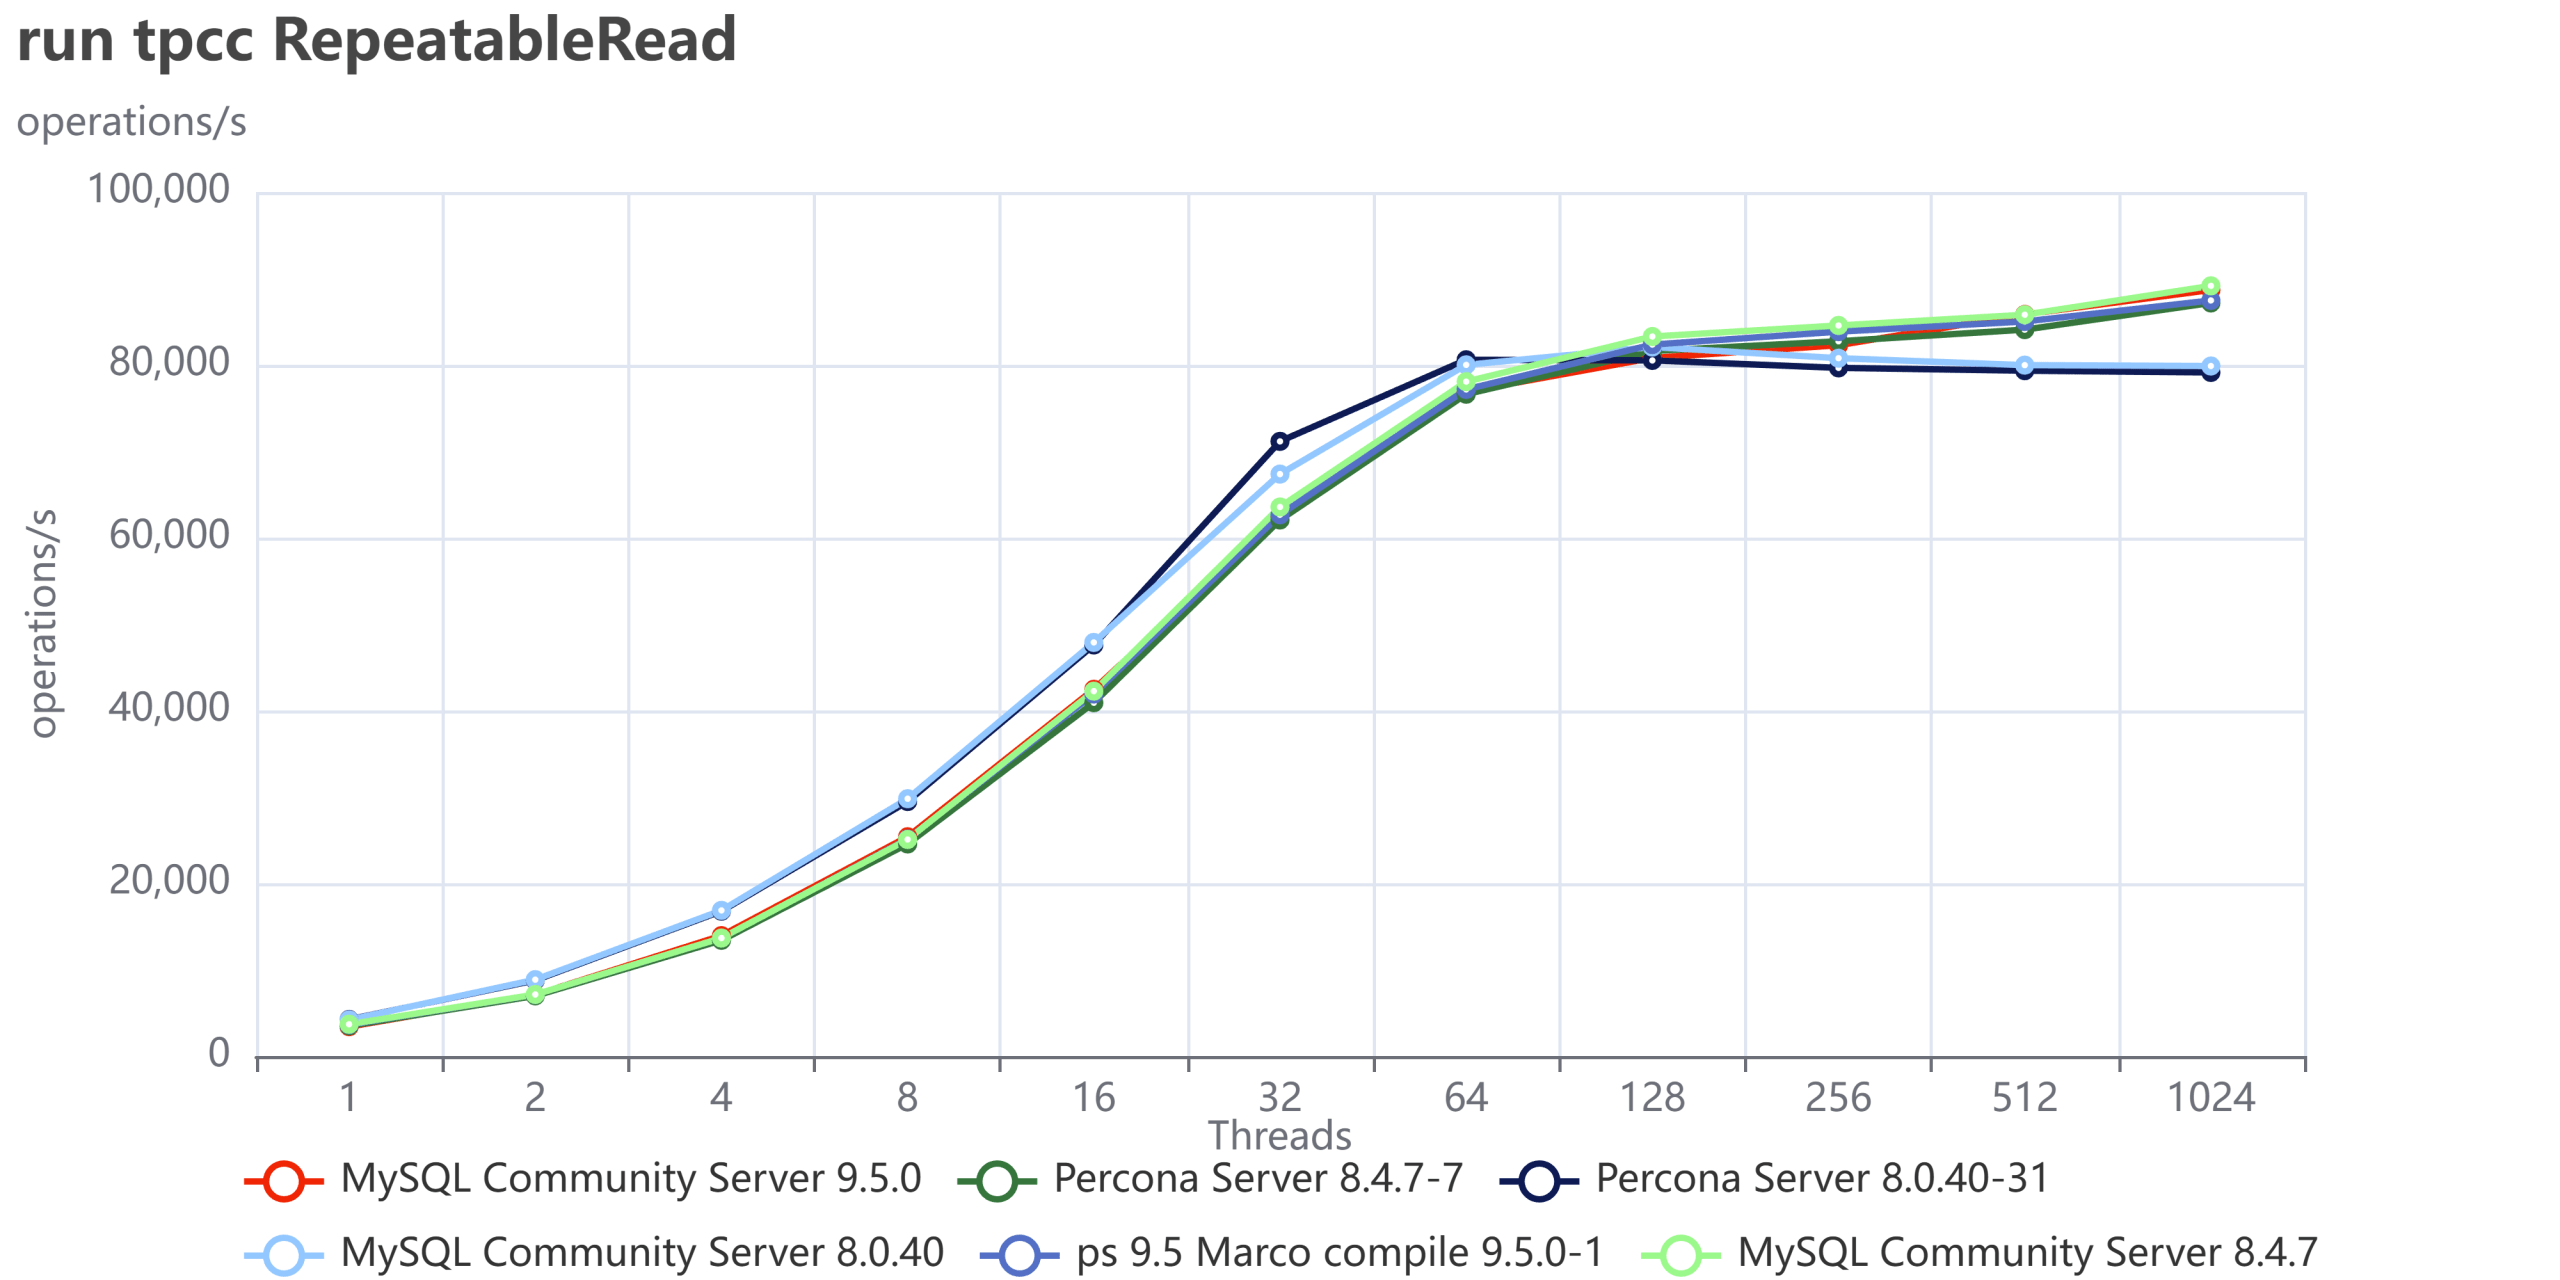
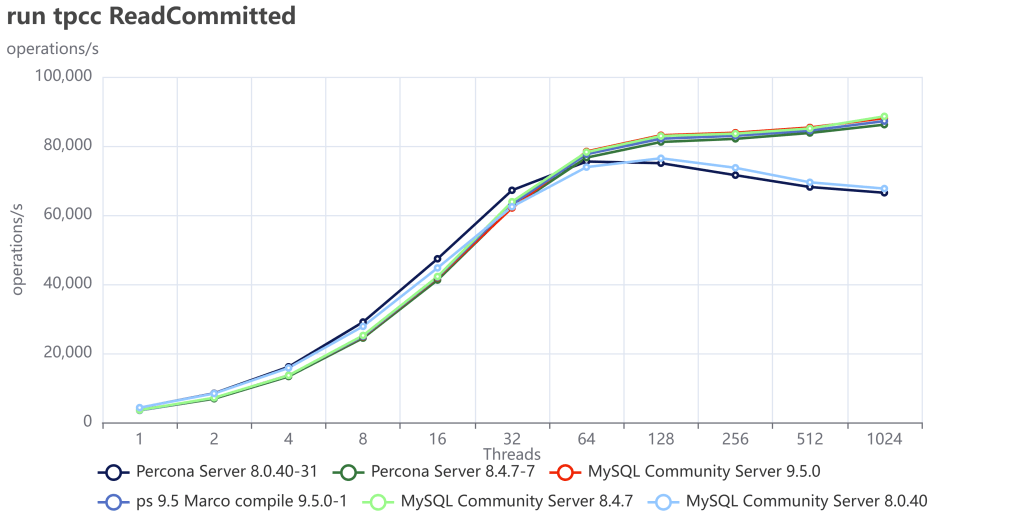
The tests done have two different kinds of isolation levels. Repeatable Read and Read Committed. The first is the default in MySQL/InnoDB, while the second is the default in many other very well-known RDBMS.
First let us review how Community MySQL and Percona Server MySQL are doing in comparison with the previous versions, especially after the debacle we had some time ago (see https://www.tusacentral.net/joomla/index.php/mysql-blogs/256-sakila-where-are-you-going)
This time I have finally dropped 5.7, given it’s EOL from some time. (Folks, you must move out of it, if you don’t know how to do it, call us for help.)
As usual an image is more descriptive than many words:
You can also compare these trends (not the values) with the previous results published here.
Let us comment a bit on these images.
The first comment we should make is that nowadays our systems must be ready to scale; period, no discussion. Also, doing benchmarks up to 1024 threads is not enough. In the real world we have 4000 or more connections. Given that, doing benchmarking exercises and stopping the load at 128 threads or lower, makes no sense.
This is going to be very clear in the next section. For now, what we can notice is that Percona Server and MySQL community are very close in terms of performance. The minor difference is inside the %variance so it is not relevant. This is expected given we share a large part of the code. What is relevant here is that Percona Server comes with similar/same performance and is a more feature-rich version, given that Percona Server MySQL has features that exist only in MySQL Enterprise.
The second comment is that in previous tests, MySQL had not only stabilized the server behavior, but it has also done significant fixes to prevent the performance loss while scaling.
Now what we can see is that the newer versions are able to keep on with the traffic and are able to scale a bit more. So, in short, everything seems going good, or at least much better than before.
Let us now add MariaDB 11.8.5 and stay focused on MySQL/Percona 8.4 and 9.5
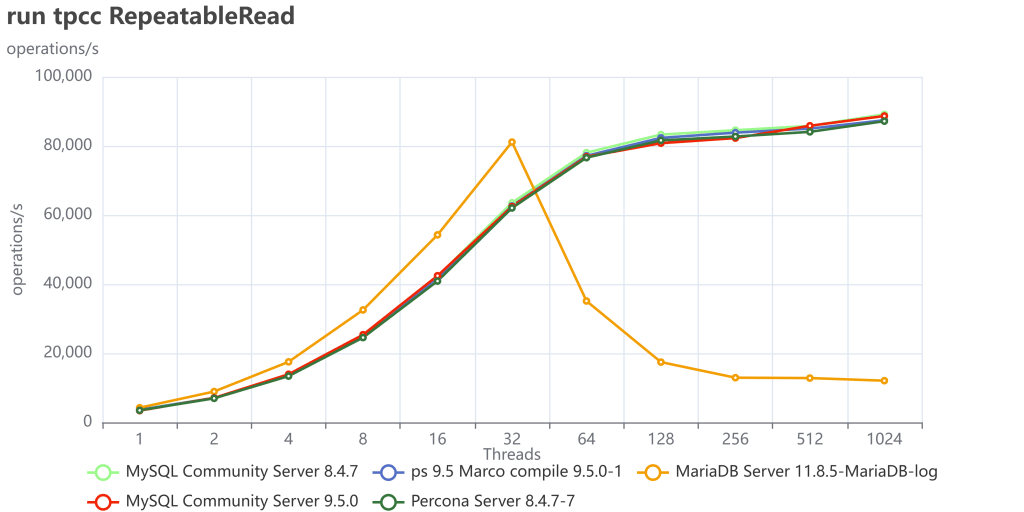
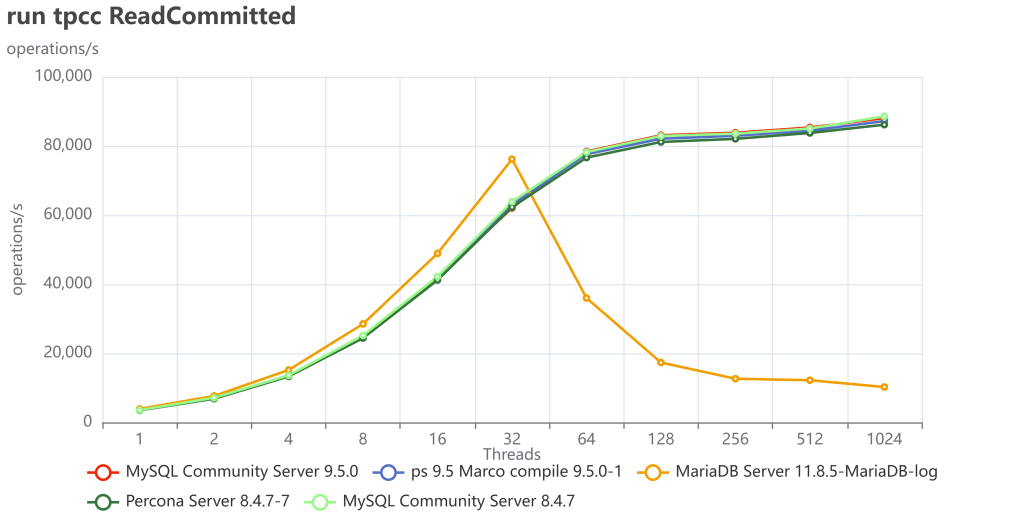
This doesn’t look very good, right? What it seems is that MariaDB is doing great up to 32 threads, then just stops and cannot serve traffic.
Restricting the concurrency to a maximum of 32 threads would have prevented the observation of MariaDB’s saturation point, thereby yielding inaccurate test results and erroneous conclusions. This is why I am always first trying to identify the saturation point, then scale the tests.
Why did we have that? We need to keep in mind that in TPC-C like tests execute a lot of reads and writes 50/50 inside the same transaction and as concurrent operations, better reflecting the reality of what happens on a busy system.
In any case, I was really puzzled by this MariaDB behavior, which seems very weird to me. So I decided to also run all the sysbench tests I have and see what happens (to see the full results, see this.)
What comes up from this exercise is a different scenario. Executing isolated tests, MariaDB is doing great and often surpassing MySQL or Percona server in reads.
Let us see some examples like the range tests all, where I execute all the range tests:
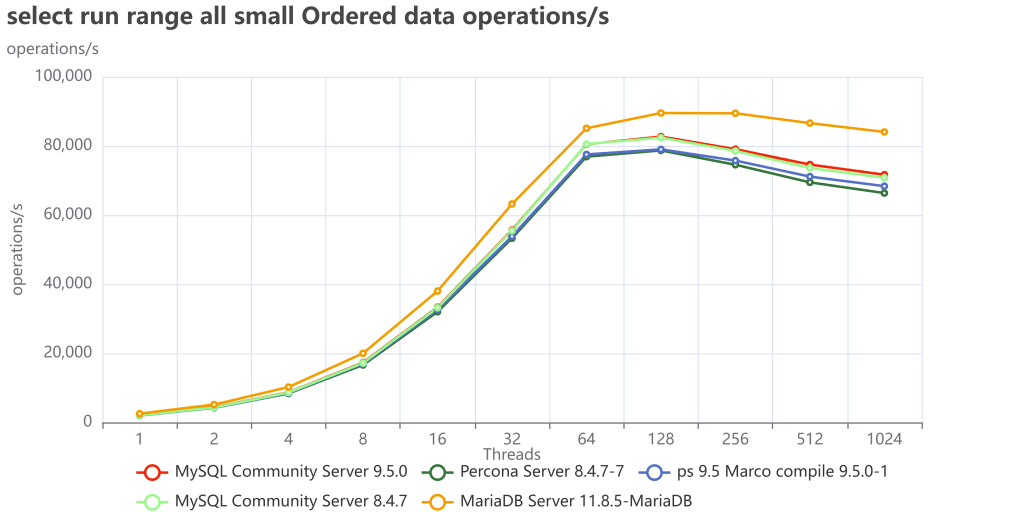
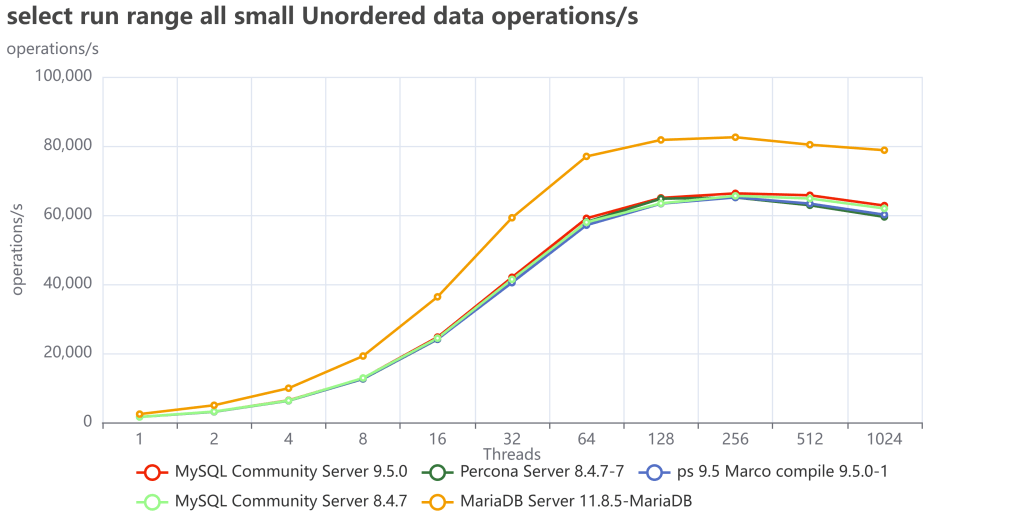
As we can see MariaDB is performing great and in the case of unordered pages is less affected than MySQL/Percona.
And this is the trend for all reads. What about the writes then?
Well in some cases like when we have in list update with hotspot MariaDB it is still doing good:
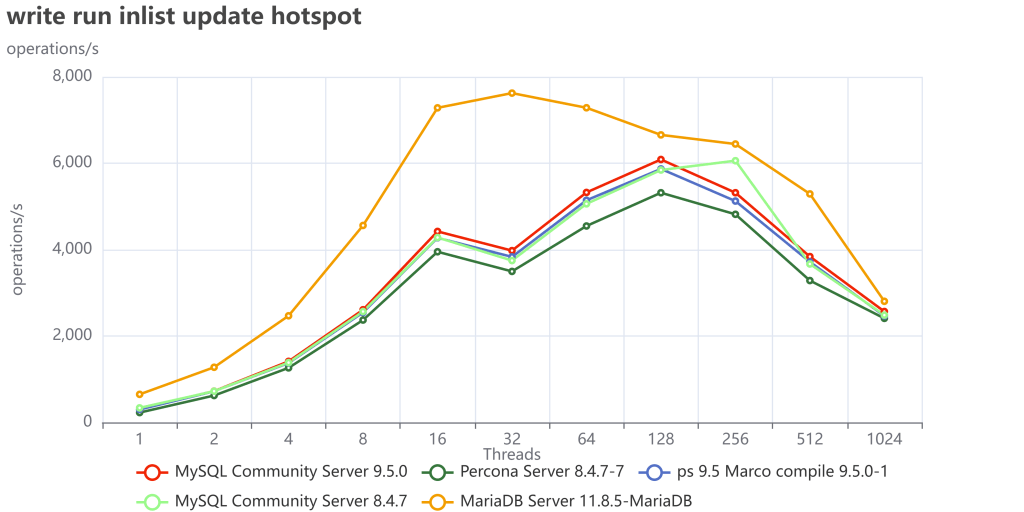
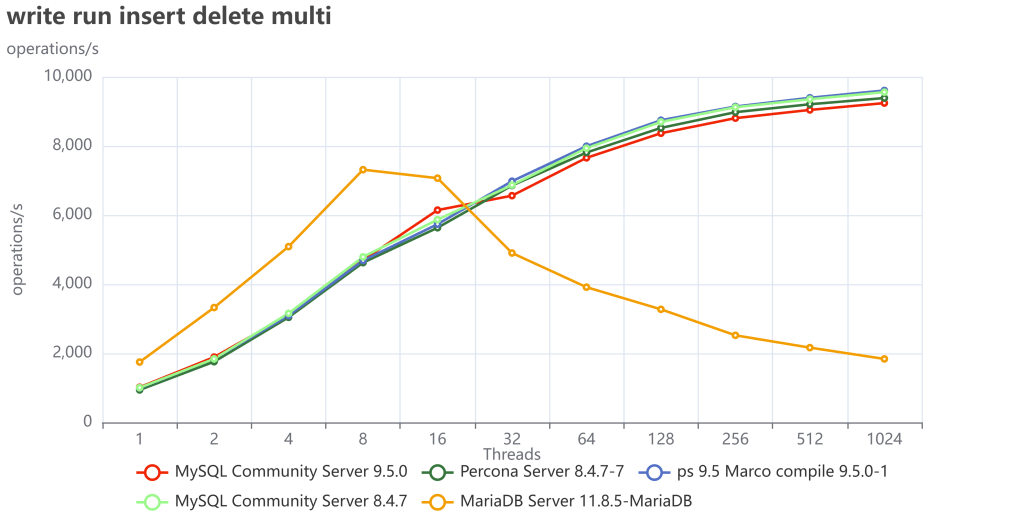
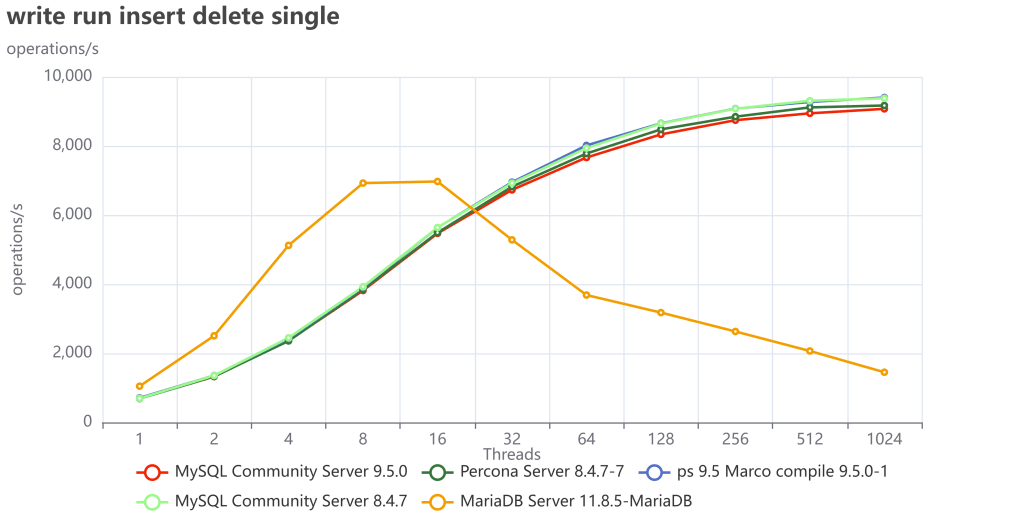
But if we do not have hotspots, when the writes are distributed across the whole dataset:
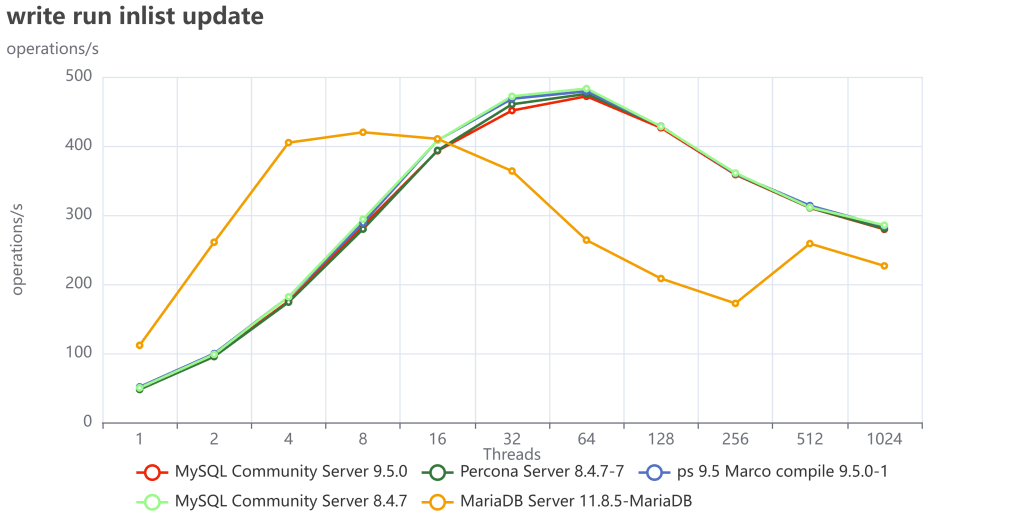
This is even clearer when using insert/delete:
Finally, if we collect the tests that execute read/write operations:
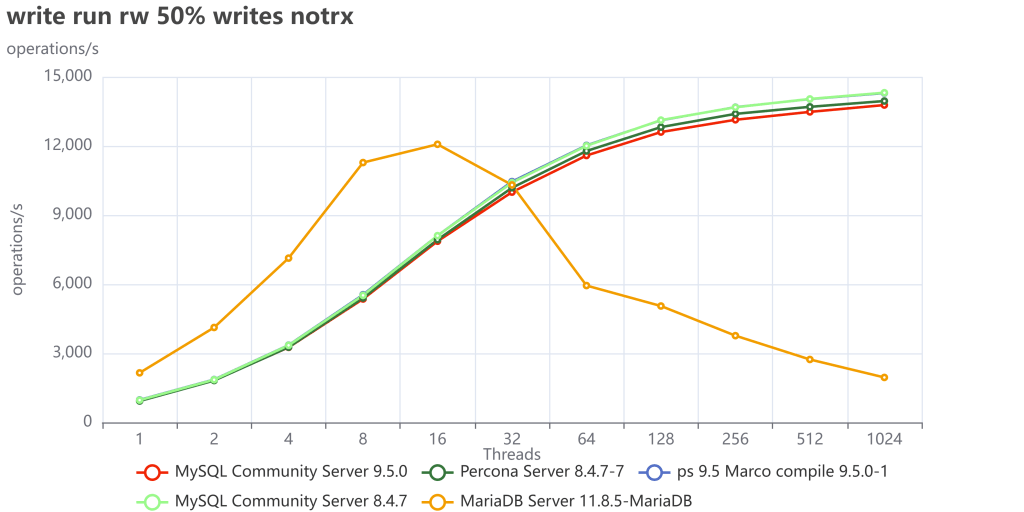
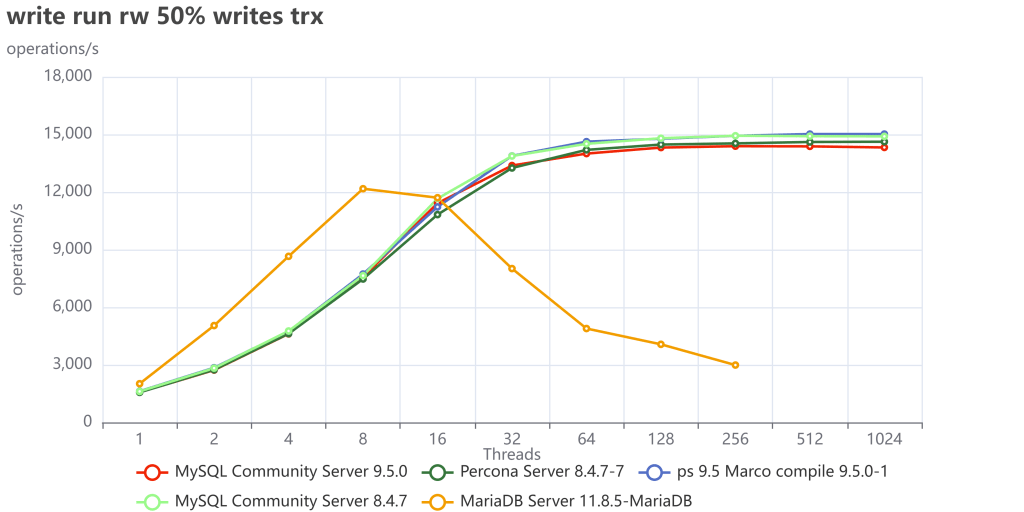
We can see we have a very similar behavior as we had with TPC-C tests.
I did not investigate in detail what is causing MariaDB to fail so much in write operations, but my gut tells me to point toward the InnoDB Buffer pool restructuring they had done, which is probably also the reason why MariaDB is doing better in reads. I am obviously open to collaborate with any MariaDB folk that would like to tune and test again, just ping me.
Conclusions
The tests performed using TPC-C like tests confirm that the MySQL debacle should be over. At the same time, they indicate that the race to get better performance is open again, and I am intrigued to see what will come next, hoping we will see Percona sprint again and add a significant performance gain, not only enterprise features.
For now, MySQL/Percona 9.5 confirms to be the better performing MySQL version currently available, for its stability and scalability.
I also think we should investigate a bit more on MariaDB implementation and identify what is making that solution operating much better in reads and acting so poorly for writes. For sure, we are not in the LAMP era anymore, when the majority of operations were read. Nowadays, the standard load and utilization on a DB sees read/write operations executed with a high level of threads, so a behavior like the one MariaDB has is not acceptable. But I am sure that if they investigate and focus on that, they will be able to identify the bottleneck and fix it.
Finally, I can’t wait to see this product become even better. I truly hope that our push for the community to step up and take charge yields the results we’re aiming for.
In the meanwhile, have a great MySQL (and MariaDB)!
About the Author
 Marco Tusa
Marco Tusa had his own international practice for the past twenty eight years. His experience and expertise are in a wide variety of information technology and information management fields, cover research, development, analysis, quality control, project management and team management. Marco is currently working at Percona as High Availability Practice Manager, previously working at Percona as manager of the Consulting Rapid Response Team on October 2013. He has being working as employee for the SUN Microsystems as MySQL Professional Service manager for South Europe., and previously in MySQL AB. He has worked with the Food and Agriculture Organization of the United Nation since 1994, leading the development of the Organization’s hyper textual environment.Team leader for the FAO corporate database support. For several years he has led the development group in the WAICENT/Faoinfo team. He has assisted in defining the Organization’s guidelines for the dissemination of information from the technology and the management point of view. He has participated in field missions in order to perform analysis, reviews and evaluation of the status of local projects, providing local support and advice. He had collaborates with MIT Media Lab (Massachusetts Institute of Technology laboratory) and FAO as Sustainable Information Technology for developing countries Specialist in relation with the FAO’s Special Program for Food Security for Senegal.


“Because of this, I ran the tests changing only things in a consistent way, with the intent to give the same opportunity to each solution. There is a clear assumption that if you release your product based on the defaults, that implies you have tested with them and consider them the safest for generic use. ” Did you ran the test with all defaults? How you got max-connections to be 1024 then?
Is this a real question? Please read the blog and check the links I pass, you will see the configuration changes were they apply.
Yes, an absolutely real question, not hard to answer. I take it as “yes, I run with ALL DEFAULTS”, since you hesitate to answer.
As I said …
navigate the links I provide and you will see the configuration used.
About if a real question, it is absolutely legit to ask when as you point out we had to scale to 1024, as such some dimension must be changed or nothing will work.
Nah, I have better use of my time, than going through someone else’s github repo with messy shell and python scripts. We leave it as mystery if you do not want to reveal it. To present sysbench results, so it can be reproduced elsewhere, only at most 3 things are necessary – sysbench command line, server parameters, perhaps link to custom LUA script. “this is how I run it, find the links, git clone my repository” – to me those are unnecessarily levels of obfuscation, which I’m admittely to lazy to untangle.
What you are saying is sad also if in line with the attitude I have seen in the past years.
There is nothing hidden or obfuscated; all the things you mention are published and available, as well my availability to check together and do the tests again, in the same environment with the MariaDB help, as also expressed in the blog. As such your comment is specious. Unfortunately it seems that instead of collaborating to make things better, your attitude remains the same; which is to say that the others are wrong, or just discredit. I am open to being wrong, are you?
If you really want to investigate, you can contact me directly and we can work on this as people who have the good of the users in mind. In the meanwhile I wish you all the best.
Hey, I asked a simple question, the answer could be yes or no, or link to the config, but no, you can’t give that. Why obfuscate, then lecture on collaboration. I was not going to collaborate, I was going to run a short test on my WINDOWS system , which is not going to run a bunch of messy hierarchical shell scripts. In this regard, reading whatever you have in your repository is only wasting my time.
It seems to be related to this bug.
https://jira.mariadb.org/browse/MDEV-33966
hi jorhan,
It could be I will investigate.
On the other hand during Fosdem and Mariadb day, I had conversation with Monty and then with technical people MariaDB side and we discussed the test.
It is very likely I have hit these bugs:
https://jira.mariadb.org/browse/MDEV-19749
https://jira.mariadb.org/browse/MDEV-37924
There is also this: https://jira.mariadb.org/browse/MDEV-21923
but it should be fixed in the 11.8.2 version.
However I will test as soon.
Another thing we agreed, with Monty, is to have the output of SHOW GLOBAL VARIABLES when doing the tests, this will simplify the understanding of the server configuration better.
About that the information is already available at the same link used to show the configuration in this blog.
Thank you.