

This blog post will detail the results of Samsung storage in tpcc-mysql benchmark using Percona Server.
I had an opportunity to test different Samsung storage devices under tpcc-mysql benchmark powered by Percona Server 5.7. You can find a summary with details here https://github.com/Percona-Lab-results/201607-tpcc-samsung-storage/blob/master/summary-tpcc-samsung.md
I have in my possession:
- Samsung 850 Pro, 2TB: This is a SATA device and is positioned as consumer-oriented, something that you would use in a high-end user desktop. As of this post, I estimate the price of this device as around $430/TB.
- Samsung SM863, 1.92TB: this device is also a SATA, and positioned for a server usage. The current price is about $600/TB.
- Samsung PM1725, 800GB: This is an NVMe device, in a 2.5″ form factor, but it requires a connection to a PCIe slot, which I had to allocate in my server. The device is high-end, oriented for server-side and demanding workloads. The current price is about $1300/TB.
I am going to use 1000 warehouses in the tpcc-mysql benchmarks, which corresponds roughly to a data size of 100GB.
This benchmark varies the innodb_buffer_pool_size from 5GB to 115GB. With 5GB buffer pool size only a very small portion of data fits into memory, which results in intensive foreground IO reads and intensive background IO writes. With 115GB almost all data fits into memory, which results in very small (or almost zero) IO reads and moderate background IO writes.
All buffer pool sizes in the middle of the interval correspond to resulting IO reads and writes. For example, we can see the read to write ratio on the chart below (received for the PM1725 device) with different buffer pool sizes:
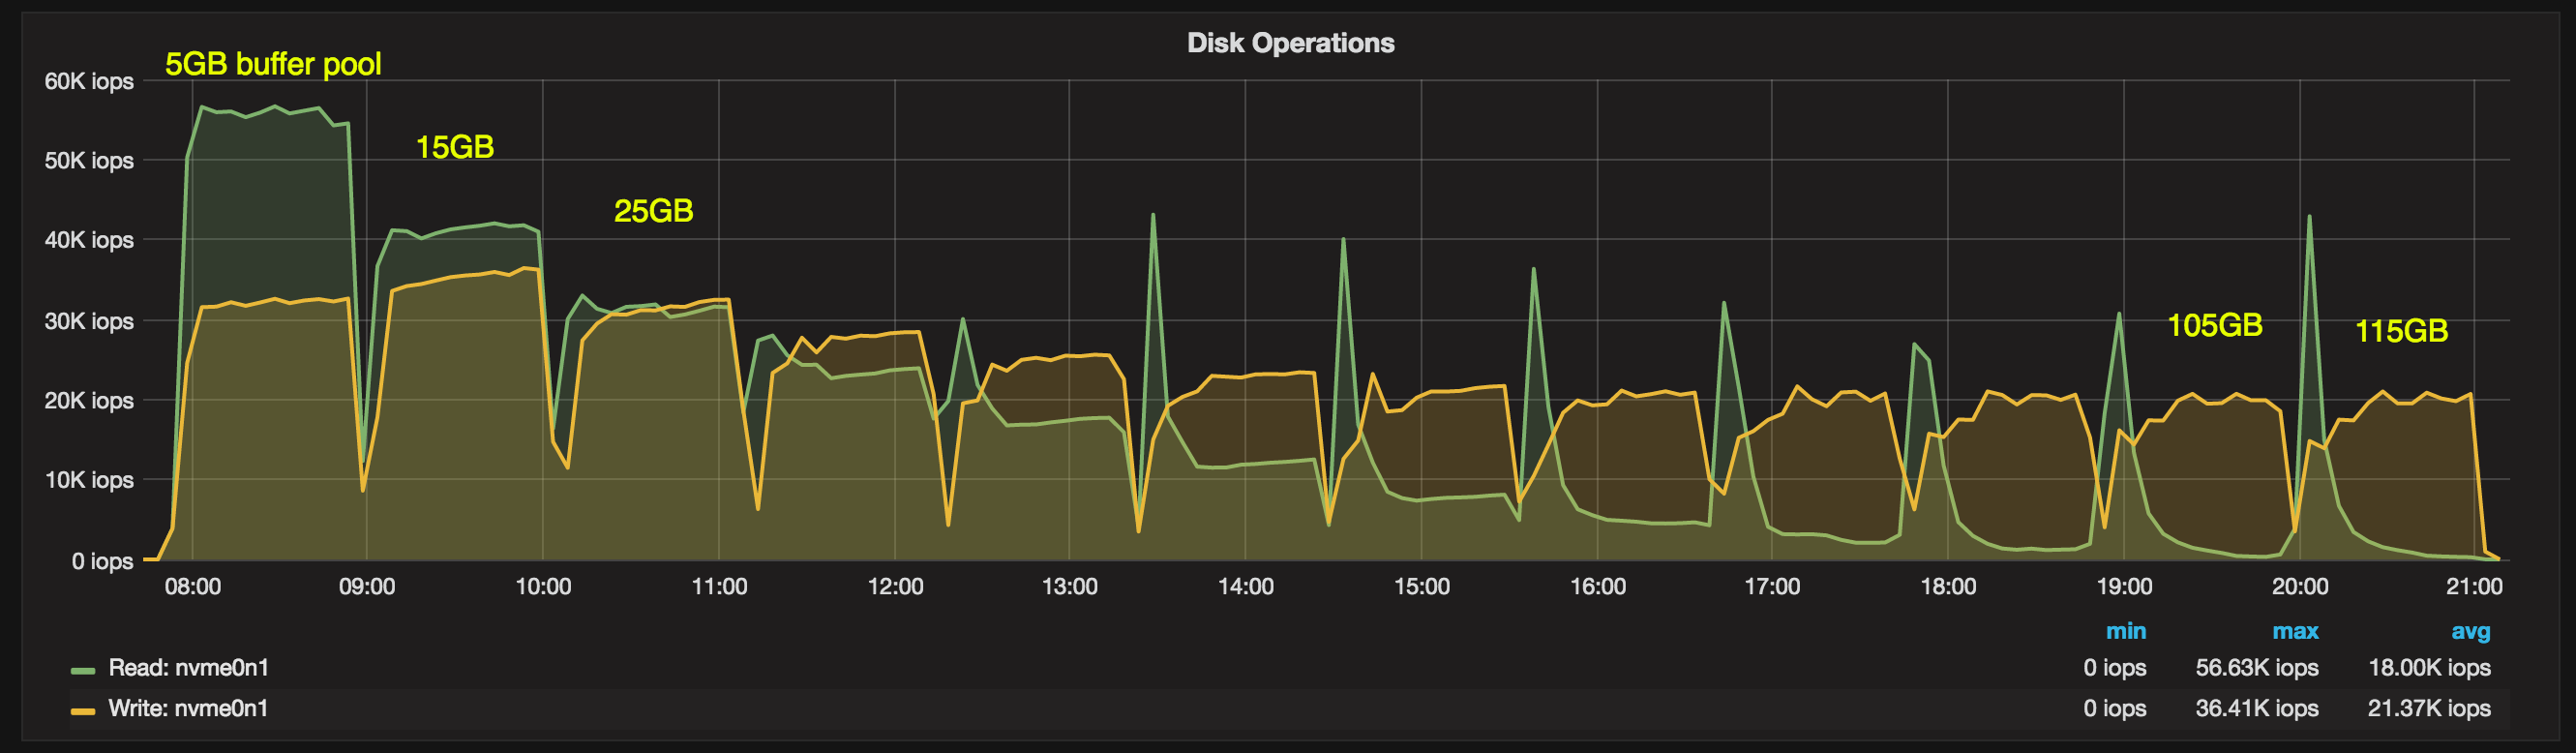
We can see that for the 5GB buffer pool size we have 56000 read IOPs operations and 32000 write IOPs. For 115GB, the reads are minimal at about 300 IOPS and the background writes are at the 20000 IOPs level. Reads gradually decline with the increasing buffer pool size.
The charts are generated with the Percona Monitoring and Management tools.
Results
Let’s review the results. The first chart shows measurements taken every one second, allowing us to see the trends and stalls.

If we take averages, the results are:

In table form (the results are in new order transactions per minute (NOTPM)):
| bp, GB | pm1725 | sam850 | sam863 | pm1725 / sam863 | pm1725 / sam850 |
|---|---|---|---|---|---|
| 5 | 42427.57 | 1931.54 | 14709.69 | 2.88 | 21.97 |
| 15 | 78991.67 | 2750.85 | 31655.18 | 2.50 | 28.72 |
| 25 | 108077.56 | 5156.72 | 56777.82 | 1.90 | 20.96 |
| 35 | 122582.17 | 8986.15 | 93828.48 | 1.31 | 13.64 |
| 45 | 127828.82 | 12136.51 | 123979.99 | 1.03 | 10.53 |
| 55 | 130724.59 | 19547.81 | 127971.30 | 1.02 | 6.69 |
| 65 | 131901.38 | 27653.94 | 131020.07 | 1.01 | 4.77 |
| 75 | 133184.70 | 38210.94 | 131410.40 | 1.01 | 3.49 |
| 85 | 133058.50 | 39669.90 | 131657.16 | 1.01 | 3.35 |
| 95 | 133553.49 | 39519.18 | 132882.29 | 1.01 | 3.38 |
| 105 | 134021.26 | 39631.03 | 132126.29 | 1.01 | 3.38 |
| 115 | 134037.09 | 39469.34 | 132683.55 | 1.01 | 3.40 |
Conclusion
The Samsung 850 obviously can’t keep with the more advanced SM863 and PM1725. The PM1725 shows a greater benefit with smaller buffer pool sizes. In cases using large amounts of memory, there is practically no difference with SM863. The reason is that with big buffer pool sizes, MySQL does not push IO subsystem much to use all the PM1725 performance.
For the reference, my.cnf file is
|
1 2 3 4 5 6 7 8 9 10 11 12 13 14 15 16 17 18 19 20 21 22 23 24 25 26 27 28 29 30 31 32 33 34 35 36 37 38 39 40 41 42 43 44 45 46 47 48 49 50 51 52 53 54 55 56 57 58 59 |
[mysqld] datadir=/var/lib/mysql socket=/tmp/mysql.sock ssl=0 symbolic-links=0 sql_mode=NO_ENGINE_SUBSTITUTION,STRICT_TRANS_TABLES # general thread_cache_size=2000 table_open_cache = 200000 table_open_cache_instances=64 back_log=1500 query_cache_type=0 max_connections=4000 # files innodb_file_per_table innodb_log_file_size=15G innodb_log_files_in_group=2 innodb_open_files=4000 innodb_io_capacity=10000 loose-innodb_io_capacity_max=12000 innodb_lru_scan_depth=1024 innodb_page_cleaners=32 # buffers innodb_buffer_pool_size= 200G innodb_buffer_pool_instances=8 innodb_log_buffer_size=64M # tune innodb_doublewrite= 1 innodb_support_xa=0 innodb_thread_concurrency=0 innodb_flush_log_at_trx_commit= 1 innodb_flush_method=O_DIRECT_NO_FSYNC innodb_max_dirty_pages_pct=90 join_buffer_size=32K sort_buffer_size=32K innodb_use_native_aio=0 innodb_stats_persistent = 1 # perf special innodb_adaptive_flushing = 1 innodb_flush_neighbors = 0 innodb_read_io_threads = 16 innodb_write_io_threads = 8 innodb_purge_threads=4 innodb_adaptive_hash_index=0 innodb_change_buffering=none loose-innodb-log_checksum-algorithm=crc32 loose-innodb-checksum-algorithm=strict_crc32 loose-innodb_sched_priority_cleaner=39 loose-metadata_locks_hash_instances=256 |
About the Author
 Vadim Tkachenko
Vadim Tkachenko co-founded Percona in 2006 and leads Percona Labs, which focuses on technology research and performance evaluations of Percona’s and third-party products. Vadim’s expertise in LAMP performance and multi-threaded programming help optimize MySQL and InnoDB internals to take full advantage of modern hardware. He also co-authored the book High Performance MySQL: Optimization, Backups, and Replication 3rd Edition.


Vadim,
Great results. Interesting to see in these test when you become write bound (higher buffer pool sizes) you can get by with relatively slower storage (sam863) while when very intensive reads required pm1725 shines.
I wonder are all of these storage solutions good enough in terms of durability, in terms of retaining acknowledged data in case of power off ? This might be more critical than raw performance for databases.
It also looks like you used only 10-20% of storage for the test, which can impact especially write performance significantly. You did not test this did you ? Sysbench fileIO can be easy to validate this.
Great analisys.