
Something’s slowing your database down, and everyone feels it.
Dashboards drag. Reports run late. Engineers start rebooting services just to buy time. Nobody’s saying “the database is broken,” but something isn’t right.
You know there’s a problem. What you don’t have is visibility.
PostgreSQL isn’t going to raise its hand and tell you which queries are locking rows or chewing through CPU. And without that insight, you’re stuck guessing or throwing time at the wrong fix.
That’s where the PostgreSQL extension pg_stat_statements changes everything. It gives you a window into which queries are causing problems, how often they’re running, and how much they’re costing you, so you can stop guessing and start solving.
The pg_stat_statemtents extension doesn’t just monitor queries; it gives you a full report card on how your SQL is performing across the board.
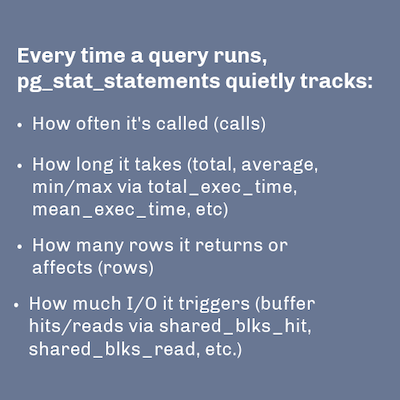
And it collects all this information without making you dig through logs or track down specific query IDs.
The real win? It groups queries by structure, not values, so SELECT * FROM users WHERE id = ? and SELECT * FROM users WHERE id = 42 are treated as the same. This means you can finally spot the patterns that actually matter.
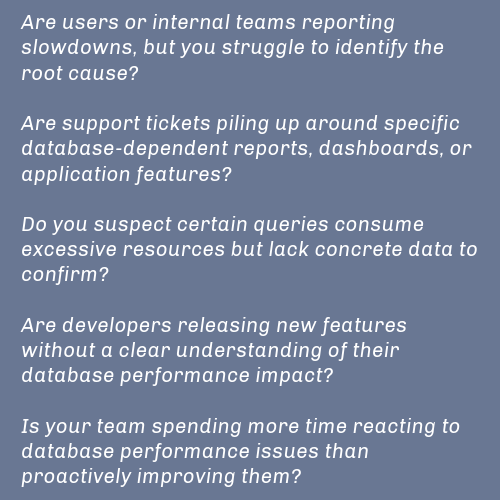
You’ll no longer need to guess:
With pg_stat_statements, you get visibility that speeds troubleshooting, makes performance tuning more precise, and makes planning less of a shot in the dark.
If you’re running PostgreSQL in production, odds are high that most of your performance issues trace back to a handful of queries. The trick is finding them before they start causing real problems.
This is where pg_stat_statements truly shines. It helps you:
You no longer need to wait for user complaints or search through endless logs. pg_stat_statements brings problematic queries to the surface, ranked by total runtime, execution count, or I/O usage.
If a single report consumes 80% of your CPU, you’ll spot it immediately. Visualizing this data (e.g., with tools like Percona Monitoring and Management (PMM)) makes spotting these bottlenecks even faster. Once you identify what’s causing the slowdown, fixing it becomes much simpler.
Because it normalizes queries, you can group and analyze behavior across your application. That means you catch repeated inefficiencies hiding in dynamic SQL or high-volume services. Even something as basic as an unindexed foreign key lookup might be buried in thousands of variations of the same query, so you’ll finally be able to connect those dots.
Thinking about a schema change? Rolling out a new feature? pg_stat_statements lets you capture a before-and-after picture so you can measure the real-world impact of those changes. No more crossing fingers or relying on hunches; you’ll know exactly what improved, what worsened, and what stayed the same.
It’s easy to throw indexes at the problem and hope for the best. But without data to guide you, that work is a gamble. pg_stat_statements helps you focus on the queries that matter most so you can tune with confidence, not guesswork, and show exactly how your changes affect performance.
Instead of hunting through application logs or writing custom query tracking scripts, your team can go straight to the source. You’ll stop wasting hours trying to reproduce a one-off issue and spend more time actually solving it.
In an enterprise environment, you can tune configurations, scale hardware, and refactor applications, but without knowing precisely how your database is being used at the query level, these efforts are often just a guess. Operating PostgreSQL without this visibility has tangible consequences:
pg_stat_statements provides the crucial, data-driven visibility needed to overcome these challenges. It moves database performance management from guesswork to an evidence-based practice, essential for any mission-critical PostgreSQL deployment. The real question isn’t whether your enterprise needs this insight but rather how you should implement and manage it effectively. Let’s explore the common options available.
If you’re already convinced you need better query visibility, the next question is: How do you actually start using pg_stat_statements in production?
There are a few common paths, and depending on how you approach it, you may run into setup hurdles, support gaps, or long-term limitations:

You can enable pg_stat_statements yourself. It’s part of PostgreSQL’s core distribution, so it’s not hard to find. But it’s not exactly plug-and-play.
You’ll need to:
This approach works, but it adds another moving piece to manage, especially as your environment grows or your observability stack gets more complex. It also introduces risks of configuration conflicts or compatibility problems if you’re using other extensions.
PostgreSQL extensions and utilities add powerful capabilities, but they don’t always work seamlessly together. If you’re managing multiple extensions on your own, download our PostgreSQL Extension Handbook to catch potential conflicts early and apply proven integration strategies that work.

Some proprietary PostgreSQL vendors include pg_stat_statements as part of their prepackaged software. That can make the initial setup easier, but before you commit, it’s worth asking:
Convenience is great until it limits your flexibility or drives up your costs.

Percona includes pg_stat_statements as a core component of our fully open source, enterprise-ready PostgreSQL distribution. This means:
Whether you’re already using PostgreSQL or just planning your rollout, Percona gives you a tested, production-grade setup that includes pg_stat_statements from day one.
Choosing the right approach depends on your team’s expertise, infrastructure, and tolerance for operational complexity. Ask yourself:
If any of that sounds familiar, pg_stat_statements gives you a way to see what’s actually happening.
Whether you’re scaling a platform, managing internal analytics, or just trying to keep PostgreSQL stable under pressure, this extension helps you progress from “I think this might be the problem” to “Here’s exactly what we need to fix.”
And when it’s already included, configured, and supported in your PostgreSQL stack, it’s one less thing you have to worry about.
With Percona for PostgreSQL, you’re not just getting access to pg_stat_statements. You receive an enterprise-ready suite of open source software, tools, and services designed to deploy and maintain a reliable production PostgreSQL cluster, enhanced with community extensions that are certified and tested to work together. No license fees, no usage restrictions, and no vendor lock-in.
Enterprise-grade observability: pg_stat_statements comes fully integrated and tested as part of Percona’s PostgreSQL distribution. It works seamlessly with Percona Monitoring and Management (PMM), allowing you to visualize query metrics without adding extra tools.
Ready for real-world deployment: Whether you run PostgreSQL in containers, across multiple clouds, or on bare metal, Percona for PostgreSQL gives you the flexibility to deploy pg_stat_statements alongside your other critical infrastructure.
Expert help when you need it: Our PostgreSQL support team knows this extension inside and out. From configuration advice to performance optimization, you’ll have access to experienced engineers available 24/7/365.
You don’t need to stitch together your own monitoring stack or wait for performance problems to escalate. With pg_stat_statements included in Percona for PostgreSQL, your team gets the insight they need, your database stays healthy, and your users stay satisfied.
Getting query visibility right is crucial for database health. To avoid other common issues when managing enterprise PostgreSQL, download our Enterprise PostgreSQL Buyer’s Guide: 10 Critical Pitfalls to Avoid.