This article will be helpful if you use the Percona Monitoring and Management (PMM) instance and alert notifications, as it is nice to capture the image of the graph when you receive the alert. We will see how to capture and attach the image of the graph when receiving the alert notification (email, telegram, Slack, etc.) to whatever channel it sends it to.
This demo will be done using Telegram. This article assumes that you already have PMM and alert notifications configured with one of the channels and are already receiving the alert notifications. In this demo, we use Telegram for alert notifications.
Existing setup
I have the below installation for PMM:
|
1 2 3 4 |
root@ip-172-31-24-80:~# docker ps -a CONTAINER ID IMAGE COMMAND CREATED STATUS PORTS NAMES 2b521867988a percona/pmm-server:2 "/opt/entrypoint.sh" About an hour ago Up About an hour (healthy) 80/tcp, 0.0.0.0:443->443/tcp, :::443->443/tcp pmm-server f427fed60fdf percona/pmm-server:2 "/bin/true" About an hour ago Created pmm-data |
Alerts and contact points have been configured, and alerts are notified in Telegram.
Here is an example alert for Telegram:
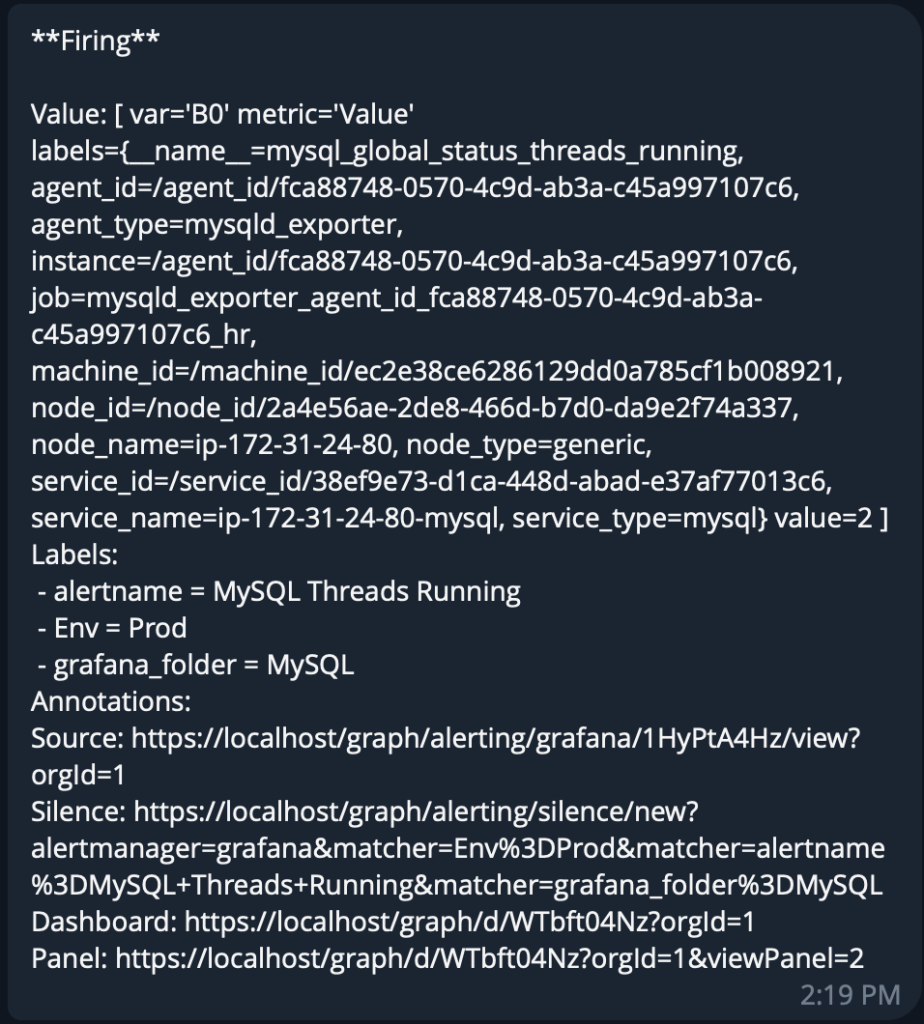
We see no image in the attachment right now with the notifications.
How do we capture images in the alert notifications?
The Grafana image renderer plugin will help us capture the graph image. We would need to set up the grafana-image-render plugin. With the release of our PMM 2.43.2, secure Grafana image renderer installation is supported.
Since the deployment will be in another container, both the PMM container and the Grafana image renderer container need to communicate with each other. We need to connect it by configuring the same docker network.
Setting up the Grafana image renderer remote plugin container
Since we would need the containers to ping with their hostname, we will need to use non-default bridge network. Let’s create one.
|
1 2 |
root@ip-172-31-24-80:~# docker network create percona-pmm 6b14d36f2e8b9ee51f57212e900e6ec747e53df9ae811ad83872eb0653cd14c5 |
We will use it to set up a Grafana image renderer container with the same network.
So, we will use the below docker command to set up the remote container for the grafana-image-renderer plugin.
|
1 2 3 4 5 6 |
docker run -d --name grafana-image-renderer --network percona-pmm --env IGNORE_HTTPS_ERRORS=true --restart=always grafana/grafana-image-renderer:latest |
If you are not using any certificate with PMM, make sure you use IGNORE_HTTP_ERRORS environmental variable so that the image for the graph can be captured successfully. If you have proper SSL certificates for PMM, you can ignore that.
We are also using the network that we created with docker.
|
1 2 3 4 5 6 |
# docker network ls NETWORK ID NAME DRIVER SCOPE c8484aae3879 bridge bridge local 87be41e1f8f2 host host local 40163b8cf855 none null local 6b14d36f2e8b percona-pmm bridge local |
You should see the below output:
|
1 2 3 4 5 |
# docker ps -a CONTAINER ID IMAGE COMMAND CREATED STATUS PORTS NAMES 0f091af155ad grafana/grafana-image-renderer:latest "dumb-init -- node b..." 5 seconds ago Up 4 seconds 8081/tcp grafana-image-renderer 2b521867988a percona/pmm-server:2 "/opt/entrypoint.sh" 7 days ago Up 31 minutes (healthy) 80/tcp, 0.0.0.0:443->443/tcp, :::443->443/tcp pmm-server f427fed60fdf percona/pmm-server:2 "/bin/true" 7 days ago Created pmm-data |
Integrating PMM server with grafana-image-renderer container
Stop your PMM container and remove it.
|
1 2 |
docker stop pmm-server docker rm pmm-server |
NOTE: Make sure that you have pmm-data volume before removing this container. If you were not using pmm-data volume earlier, this will also remove your data.
Start a new PMM server container with the GF_RENDERING_SERVER_URL and GF_RENDERING_CALLBACK_URL environment variables.
|
1 2 3 4 5 6 7 8 9 |
docker run -d --name pmm-server --volumes-from pmm-data -p 443:443 --env GF_RENDERING_SERVER_URL=http://grafana-image-renderer:8081/render --env GF_RENDERING_CALLBACK_URL=https://pmm-server:443/graph/ --env GF_UNIFIED_ALERTING_SCREENSHOTS_CAPTURE=true --network percona-pmm --restart=always percona/pmm-server:latest |
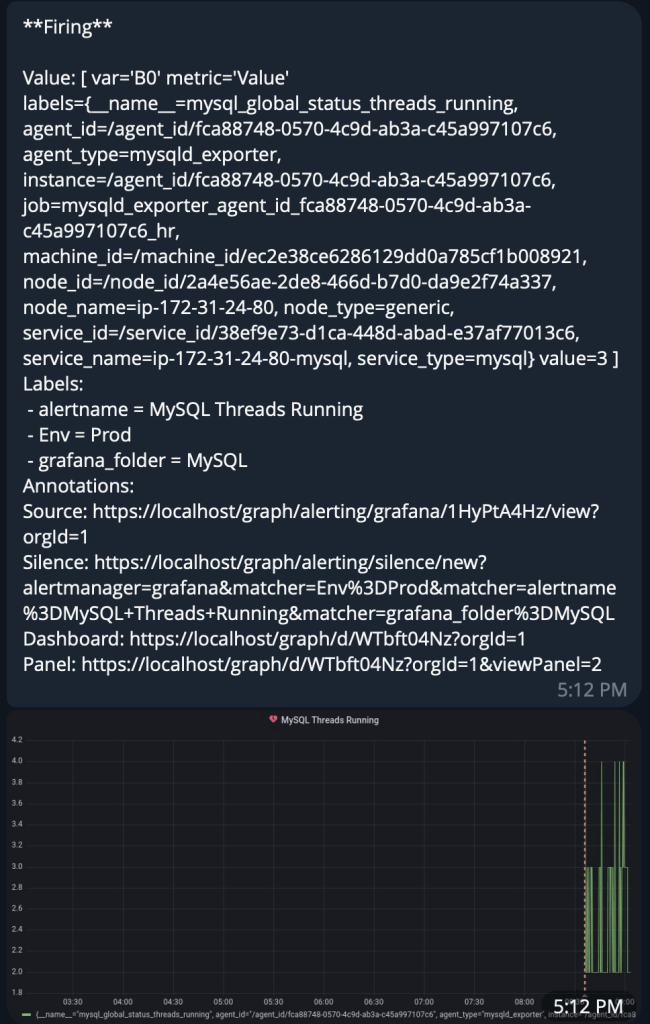
Add the additional parameters in the docker run if you have customized the docker container for the PMM Server.
Now, when the alert triggers, there will be a screenshot attached for the graph:
Summary
You can always go back to the pmm-server to check the graph of the required alerts. The data in PMM is stored by default for 30 days unless you have defined retention. This could be a good feature if you want to review the graphs and the alert notification when the alert is triggered. This can also be helpful to review the graph image if you wish to review the alert before your data retention period to analyze the behavior or for performance comparison. I have also tested this with email, and it works as expected.
Percona Monitoring and Management is a best-of-breed open source database monitoring solution tool for MySQL, PostgreSQL, MongoDB, and the servers on which they run. Monitor, manage, and improve the performance of your databases no matter where they are located or deployed.
Try Percona Monitoring and Management
About the Author
 Yunus Shaikh
Yunus have joined Percona since 2018 as a Database Administrator. He also has spent working as System administrator earlier in his career having good experience in open source tools.