Percona Monitoring and Management (PMM) is a powerful tool for keeping your databases healthy, but what about PMM itself? While it comes pre-packaged as an appliance, PMM’s internal workings can be complex. Many users, including our internal teams, frequently ask: “How can I tell if everything inside PMM is functioning properly?”
To address this need, we’ve developed a new experimental dashboard that goes beyond a simple “yes or no” answer about PMM’s health. This enhanced view provides a spectrum of information, allowing you to identify potential issues and ensure PMM is operating at its peak performance.
This dashboard will reflect PMM Architecture and cover the components we are using.
Let’s take a closer look at the data presented here.
Summary
“Are all components up?” is the first question you will ask yourself when challenging the healthiness of PMM. To address this, we added the top row with a simple status of all components.
If something is not UP – then it is 99% likely the problem is with your PMM

The following rows consist of per-component monitoring data.
Node Summary
 The next row shows the health status of the node on which PMM is running. This section provides essential metrics and data about the main node.
From here, you can also easily navigate to the Node Summary dashboard, which offers extended information about single nodes.
Query Analytics

Query Analytics (QAN) is a unique component of PMM that provides you with deep insights into the internal workings and behavior of database queries, including how they are executed.
On the PMM Server, QAN consists of two main components:
- QAN API: Responsible for receiving and storing QAN data.
- QAN UI: The user interface that presents the data, accessible at https://pmmdemo.percona.com/graph/d/pmm-qan/pmm-query-analytics.
While the QAN UI is just the front end, our focus for the PMM Health dashboard will be on the API/backend.
QAN API metrics are divided into two sections:
- Resource consumption: Monitors CPU and RAM usage.
- Buckets: Represent a queue for data processing. A bucket is a representation of data collected on the client side for different dimensions over a short period of time.
Data is presented in percentiles, and the default time interval for QAN data gathering is 1 minute. It’s important to monitor batch save time to ensure it doesn’t exceed 1 minute for an extended period, as this could result in data delays on the PMM QAN UI.
PMM ManageD
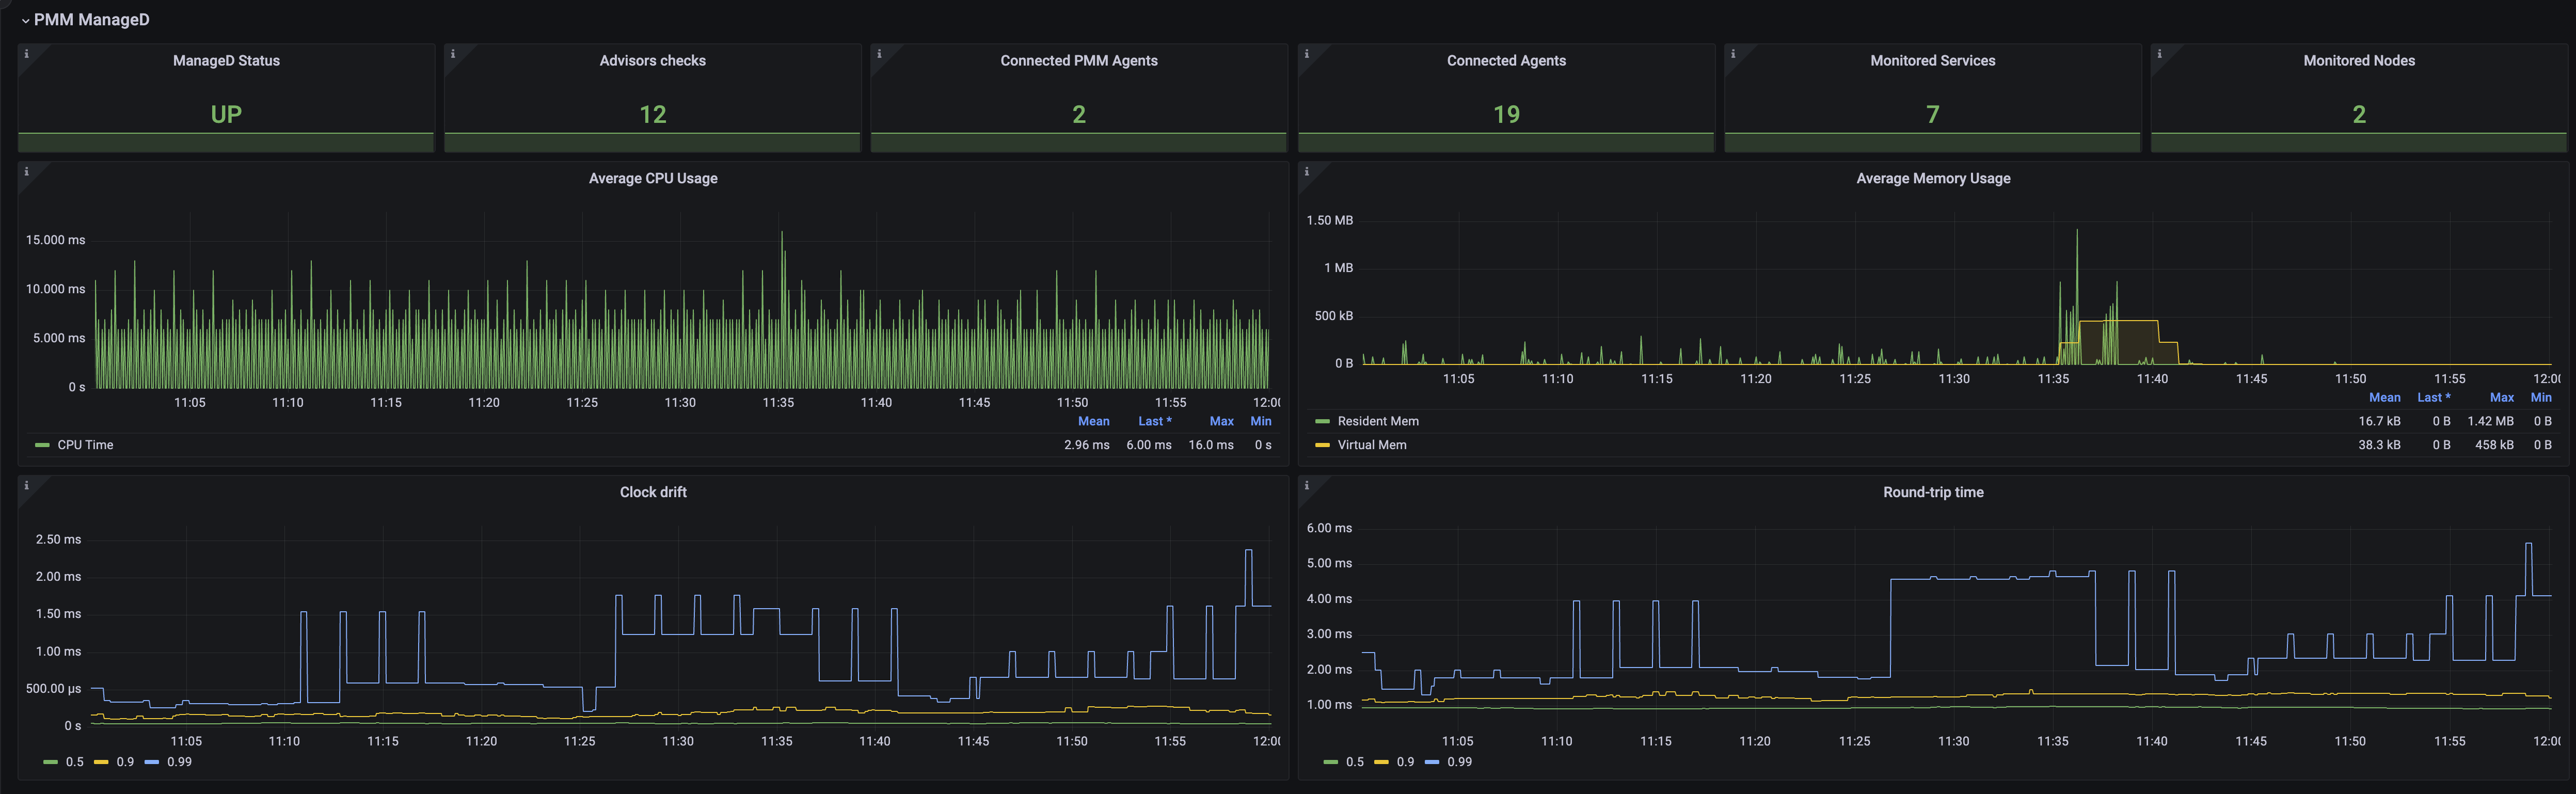
At the heart of PMM lies a critical component named the “PMM-managed.” This component acts as the central command center, managing communication and data collection from all agents deployed on client-side databases. For example, it’s responsible for generating all agent configurations.
While monitoring resource consumption by the PMM Server is important, another key health indicator is the time difference between the server and its connected clients. A significant time drift can signal potential network issues or delays in data transmission. In extreme cases, a large discrepancy might also indicate a misconfiguration on a client host, leading to inaccurate timestamps in the collected monitoring data.
Grafana
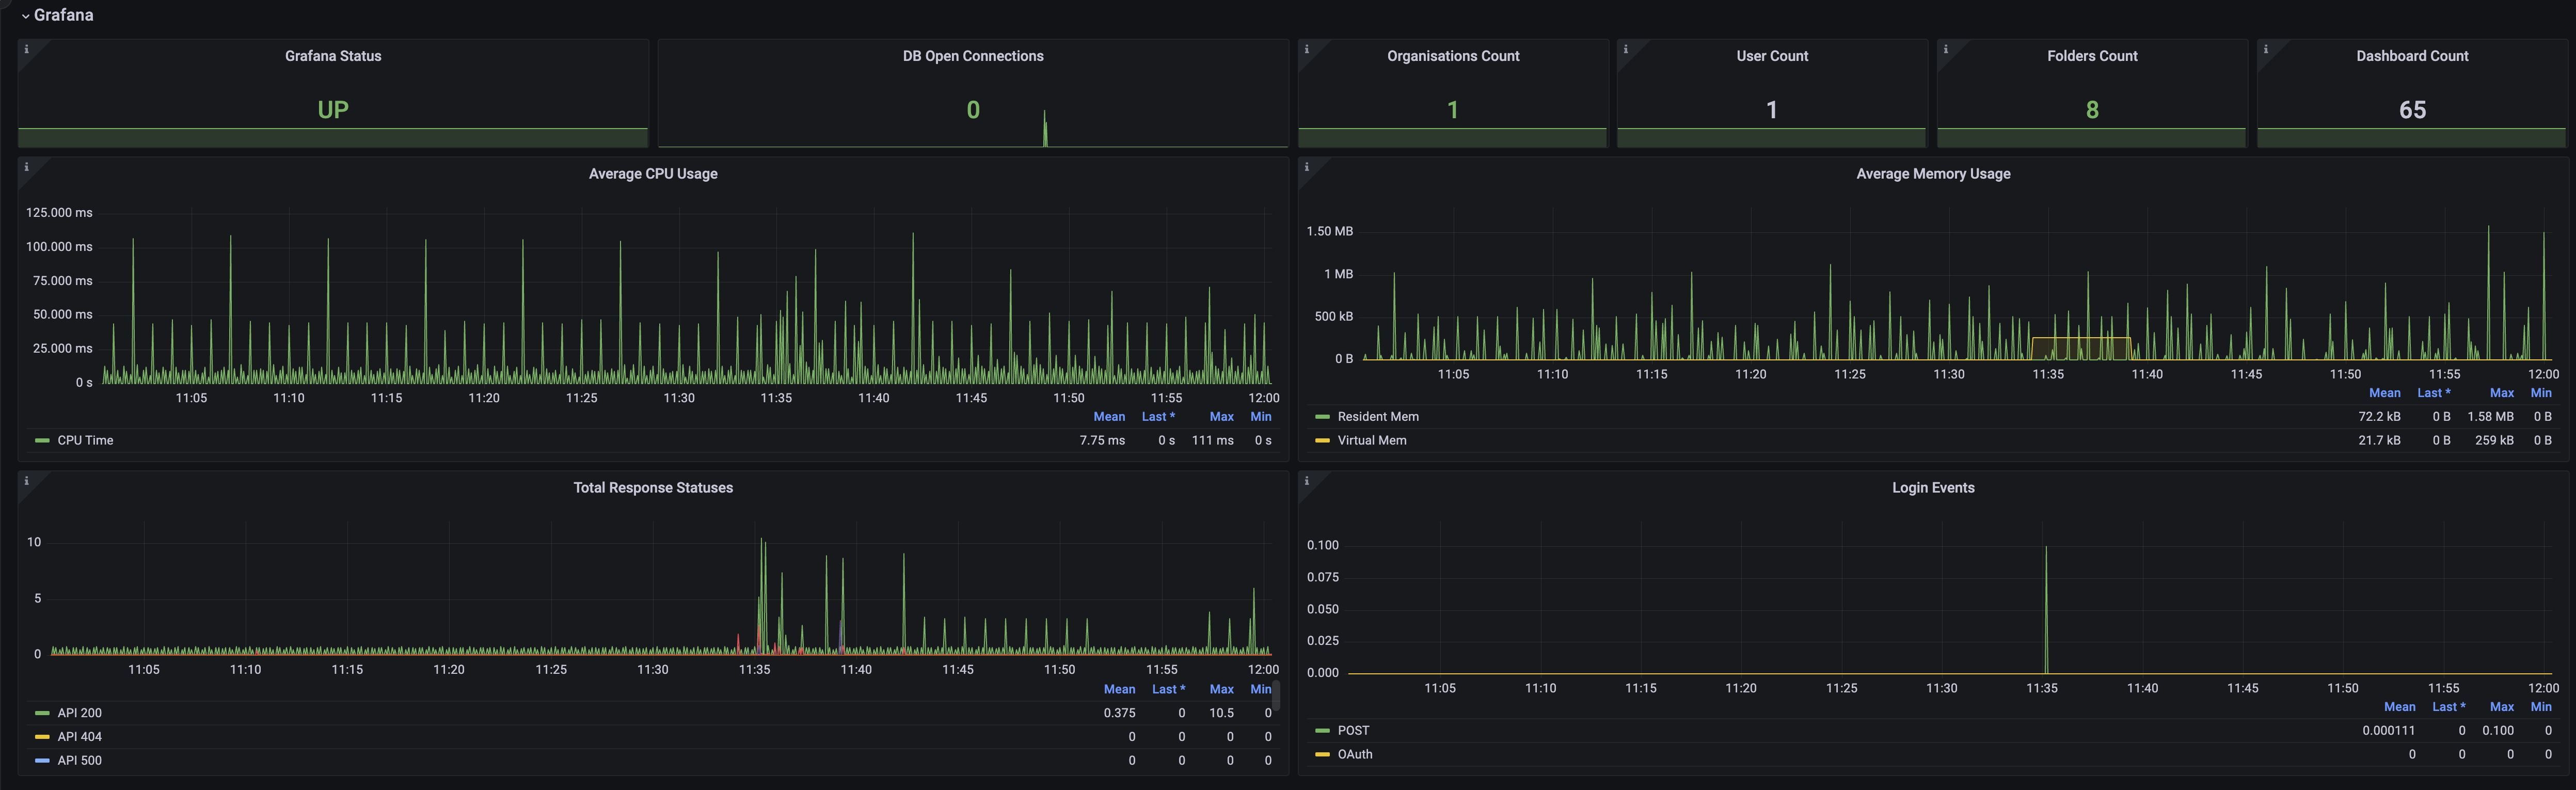
This section will focus on using Grafana in PMM, including the number of users, organizations, and dashboards. In addition to the typical memory and CPU usage data on the dashboard, you can also find overall Grafana metrics related to PMM users and the number of dashboards.
The Response Statuses panel helps monitor the activity levels of dashboards and other Grafana components, making it easier to identify issues such as 404 or 500 response codes.
The Login Events panel provides detailed information about user authentication in PMM, which relies on Grafana as its authentication system.
VictoriaMetrics
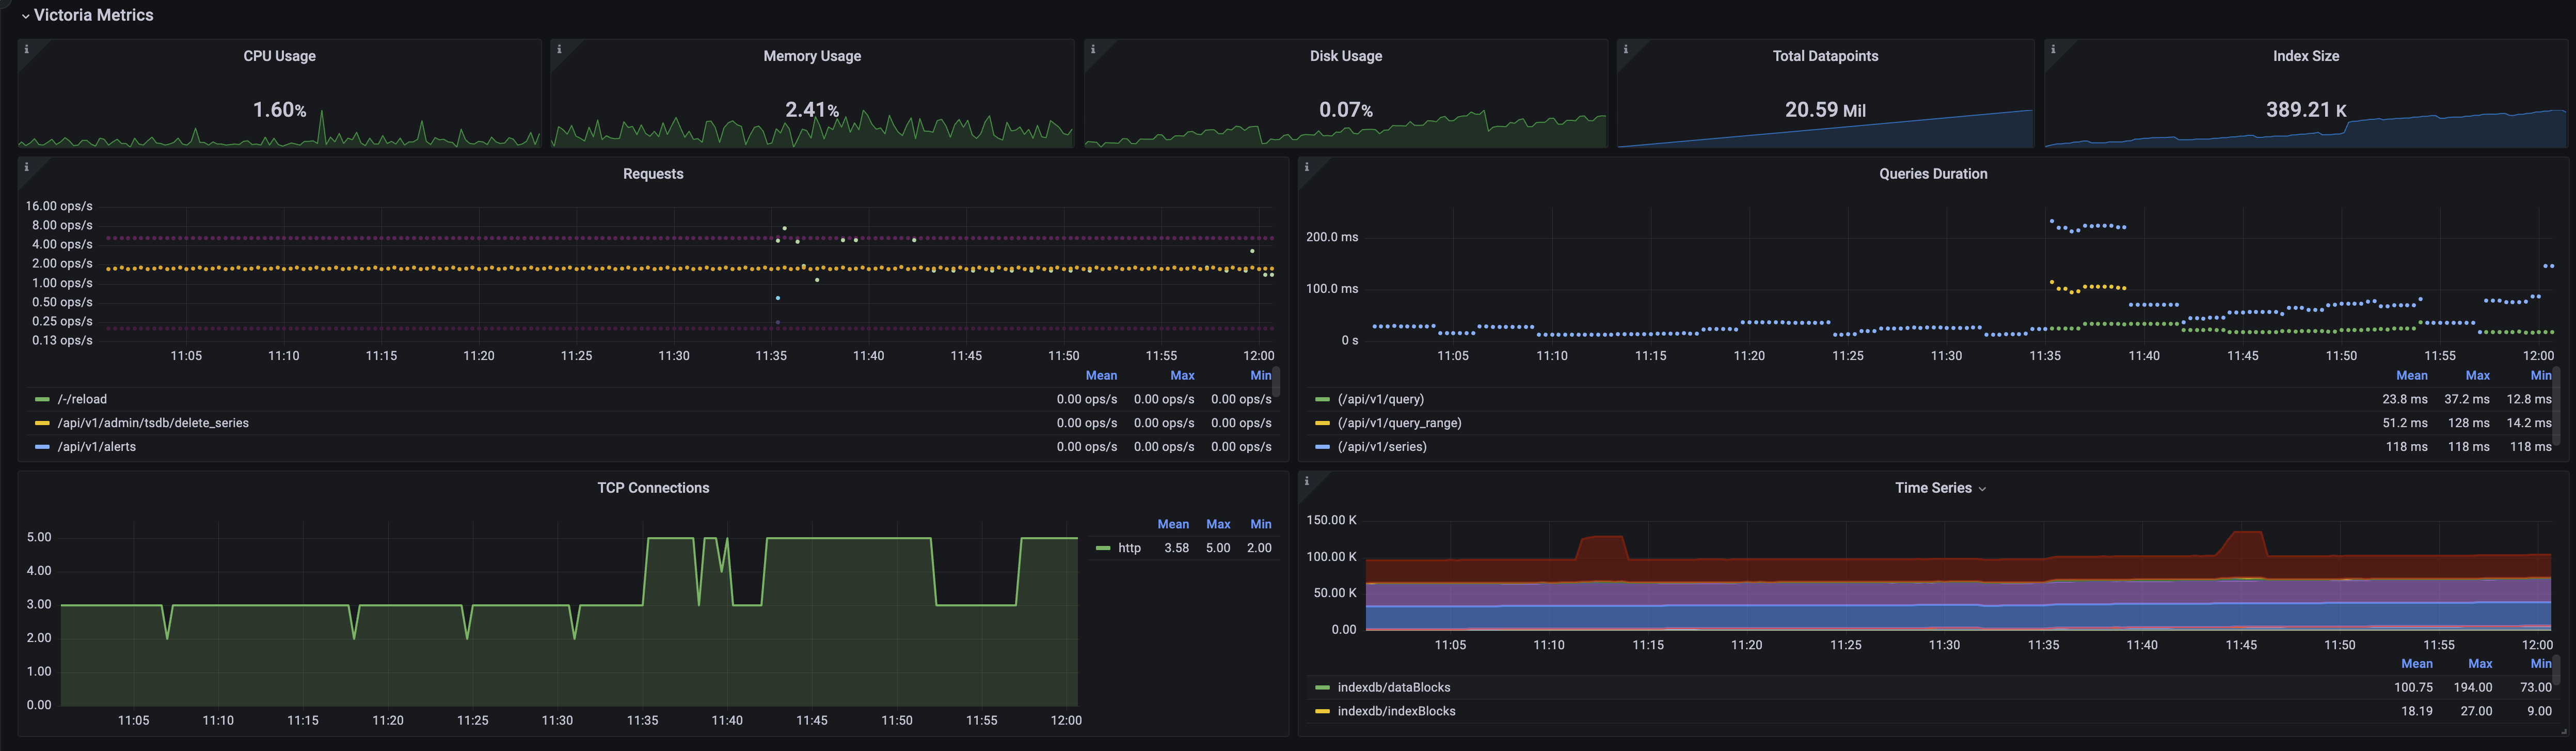
One of the most commonly used storage systems in PMM is VictoriaMetrics (VM), which is responsible for storing all metrics. This section presents various VM metrics, such as CPU and memory usage, disk usage, and sizes of data points and indexes. It also displays the usage of requests and query duration over time, allowing you to identify anomalies. Additionally, the TCP Connections panel provides further insights into PMM usage, while the Number of Time Series panel highlights a crucial metric for efficient PMM performance.
For more detailed VM metrics, you can access the dedicated VictoriaMetrics dashboard located in PMM’s Insight folder.
Clickhouse

Another active database used within PMM is ClickHouse, which stores data for QueryAnalytics. We use builds from Altinity as they provide tested and optimized builds of ClickHouse. For monitoring ClickHouse, we use the Altinity solution available at Altinity Knowledge Base, and we have also enabled Prometheus metrics within ClickHouse itself.
The main parameters of ClickHouse on the dashboards provide information such as version and the number of tables, which are mainly controlled by the PMM version, but this can help identify inconsistencies. Other sections will display the memory usage and the number of connections to ClickHouse.
‘Read backoffs’ refers to the number of times the number of query processing threads was lowered due to slow reads. ‘Slow reads’ indicates the number of number of slow reads from a file, signaling system overload.
PostgreSQL

The last database used in PMM is PostgreSQL primarily storing inventory and other meta-information. This database should have less load in the PMM, as it is not involved in active data gathering and does not execute heavy reporting queries.
Grafana also uses PostgreSQL to store all necessary data, including user information.
We have included PostgreSQL in PMM monitoring by default, enabling internal monitoring through PMM.
This ensures that PostgreSQL benefits from all PMM monitoring features.
The main metrics we focus on are related to connection usage, tuples, and transactions occurring in this database.
The complete PostgreSQL dashboard is the PostgreSQL Instance Summary dashboard, located in the corresponding folder for the pmm-server-postgresql service (example: PostgreSQL Instance Summary
What’s next?
We acknowledge that this initial version of the PMM Health dashboard is not perfect yet and has room for improvement.
For now, it provides a starting point with a set of essential metrics to help you monitor the health and performance of your PMM setup.
We highly encourage you to test this dashboard in your own environment, especially if you have been experiencing or suspecting any issues with PMM.
To access the PMM Health dashboard, update your PMM Server to version 2.42. Once updated, the dashboard will be readily available in the “Experimental” folder within PMM
We greatly value your feedback and input in shaping the future of the PMM Health dashboard. Your real-world experiences, suggestions, and observations will be crucial in refining and enhancing this tool to serve your needs better and turn it into an official dashboard in a future release.
To provide feedback, you have two convenient options:
- Percona Forum: Visit our dedicated PMM forum to share your thoughts, ask questions, and engage with the Percona community and our team.
- Schedule a call: If you prefer a more personal and interactive approach, you can schedule a short call with me directly using my calendar. This will allow us to discuss your feedback in detail and explore ways to incorporate your insights into future iterations of the dashboard.
Percona Monitoring and Management is a best-of-breed open source database monitoring solution tool for use with MySQL, PostgreSQL, MongoDB, and the servers on which they run. Monitor, manage, and improve the performance of your databases no matter where they are located or deployed.
Download Percona Monitoring and Management Today
About the Author
 Roma Novikov
Roma joined Percona at the beginning of 2017 as Director of Platform Engineering. He started programming in 6th grade and has more than 15 years commercial experience in web development. He previously worked as CTO of the biggest web development/web design e-commerce company.