

The MySQL database server is a foundational component of the open-source world. While its impact is undeniable, looking at the raw statistics of its core source code repository reveals a dynamic and sometimes surprising development history. By analyzing the total lines of code inserted, the number of commits over the years, and unique contributors, we can gain a clearer picture of the project’s evolution.
📈 ANALYSIS of REPOSITORY GROWTH and ACTIVITY
The graphs generated provide a timeline-based view of the MySQL server project’s development across several key dimensions.
1. Total Number of Unique Contributors Over the Years
The number of unique contributors per quarter provides an indication of how widely contributors engage with the project. In this analysis, each commit’s “committer name” is counted as a contributor. Unfortunately not all commits have a committer email. If 2 committers share the exact name-lastname, they would be counted as 1. As seen in Figure 1, the number of distinct contributors have been fluctuating.

Figure 1- The total number of unique contributors over the quarters
At its peak, MySQL had 198 unique contributors (Q3 2006). When Oracle acquired Sun Microsystem on 27 January 2010, the unique contributors were around 82 (Q4-2009). We can see that Oracle and the community invested in MySQL where the total number of contributors reached 135 in Q4, 2017. The pool of active contributors has dropped to around 75 by Q3 2025, suggesting a consolidation of development effort among fewer individuals.
2. Number of Commits Over the Years
The commit count is the most direct indicator of development activity as seen in Figure 2 below. The trendline was generated with moving average calculation (period=2).
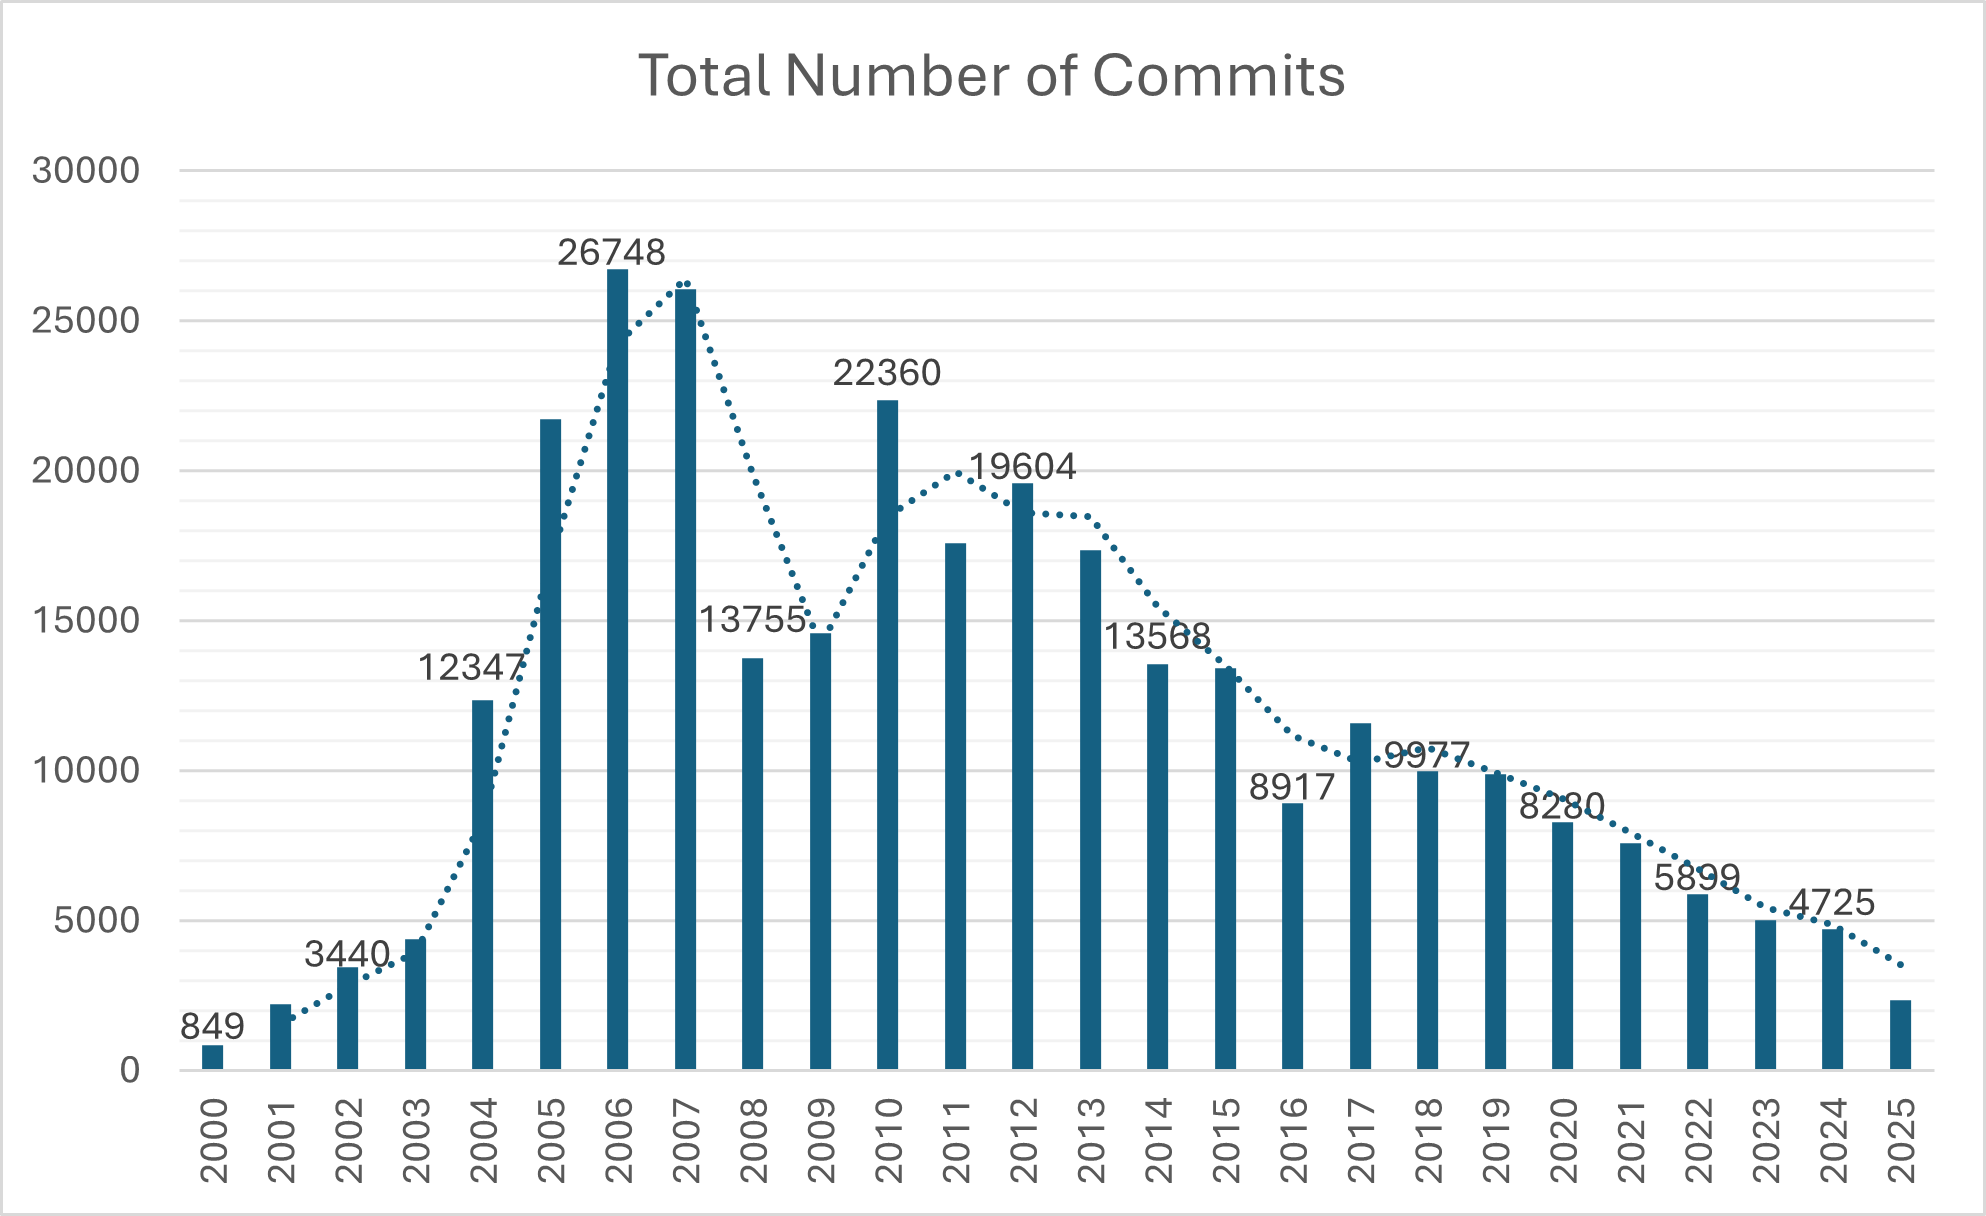
Figure 2 – Total number of commits over the years
The peak number of commits occurred in 2006 and 2007 topping out at over 26,000 commits per year. Given that 2025 has not ended yet, let’s have a comparison between 2010 and 2024. The total number of commits have declined from 22.36K to 4.73K. Approximately a four-fold (4.7) decrease over 14 years.
The yearly view of commits, emphasizes the volatility but clearly validates the long-term declining trend. The linear forecast line extending into the future is a stark visual representation of the predicted decline. Based purely on the historical volume of commits, the project’s activity is projected to continue its decline.
3. Total Number of Inserted Lines Over the Years (Including and Excluding 3rd Party Libraries)
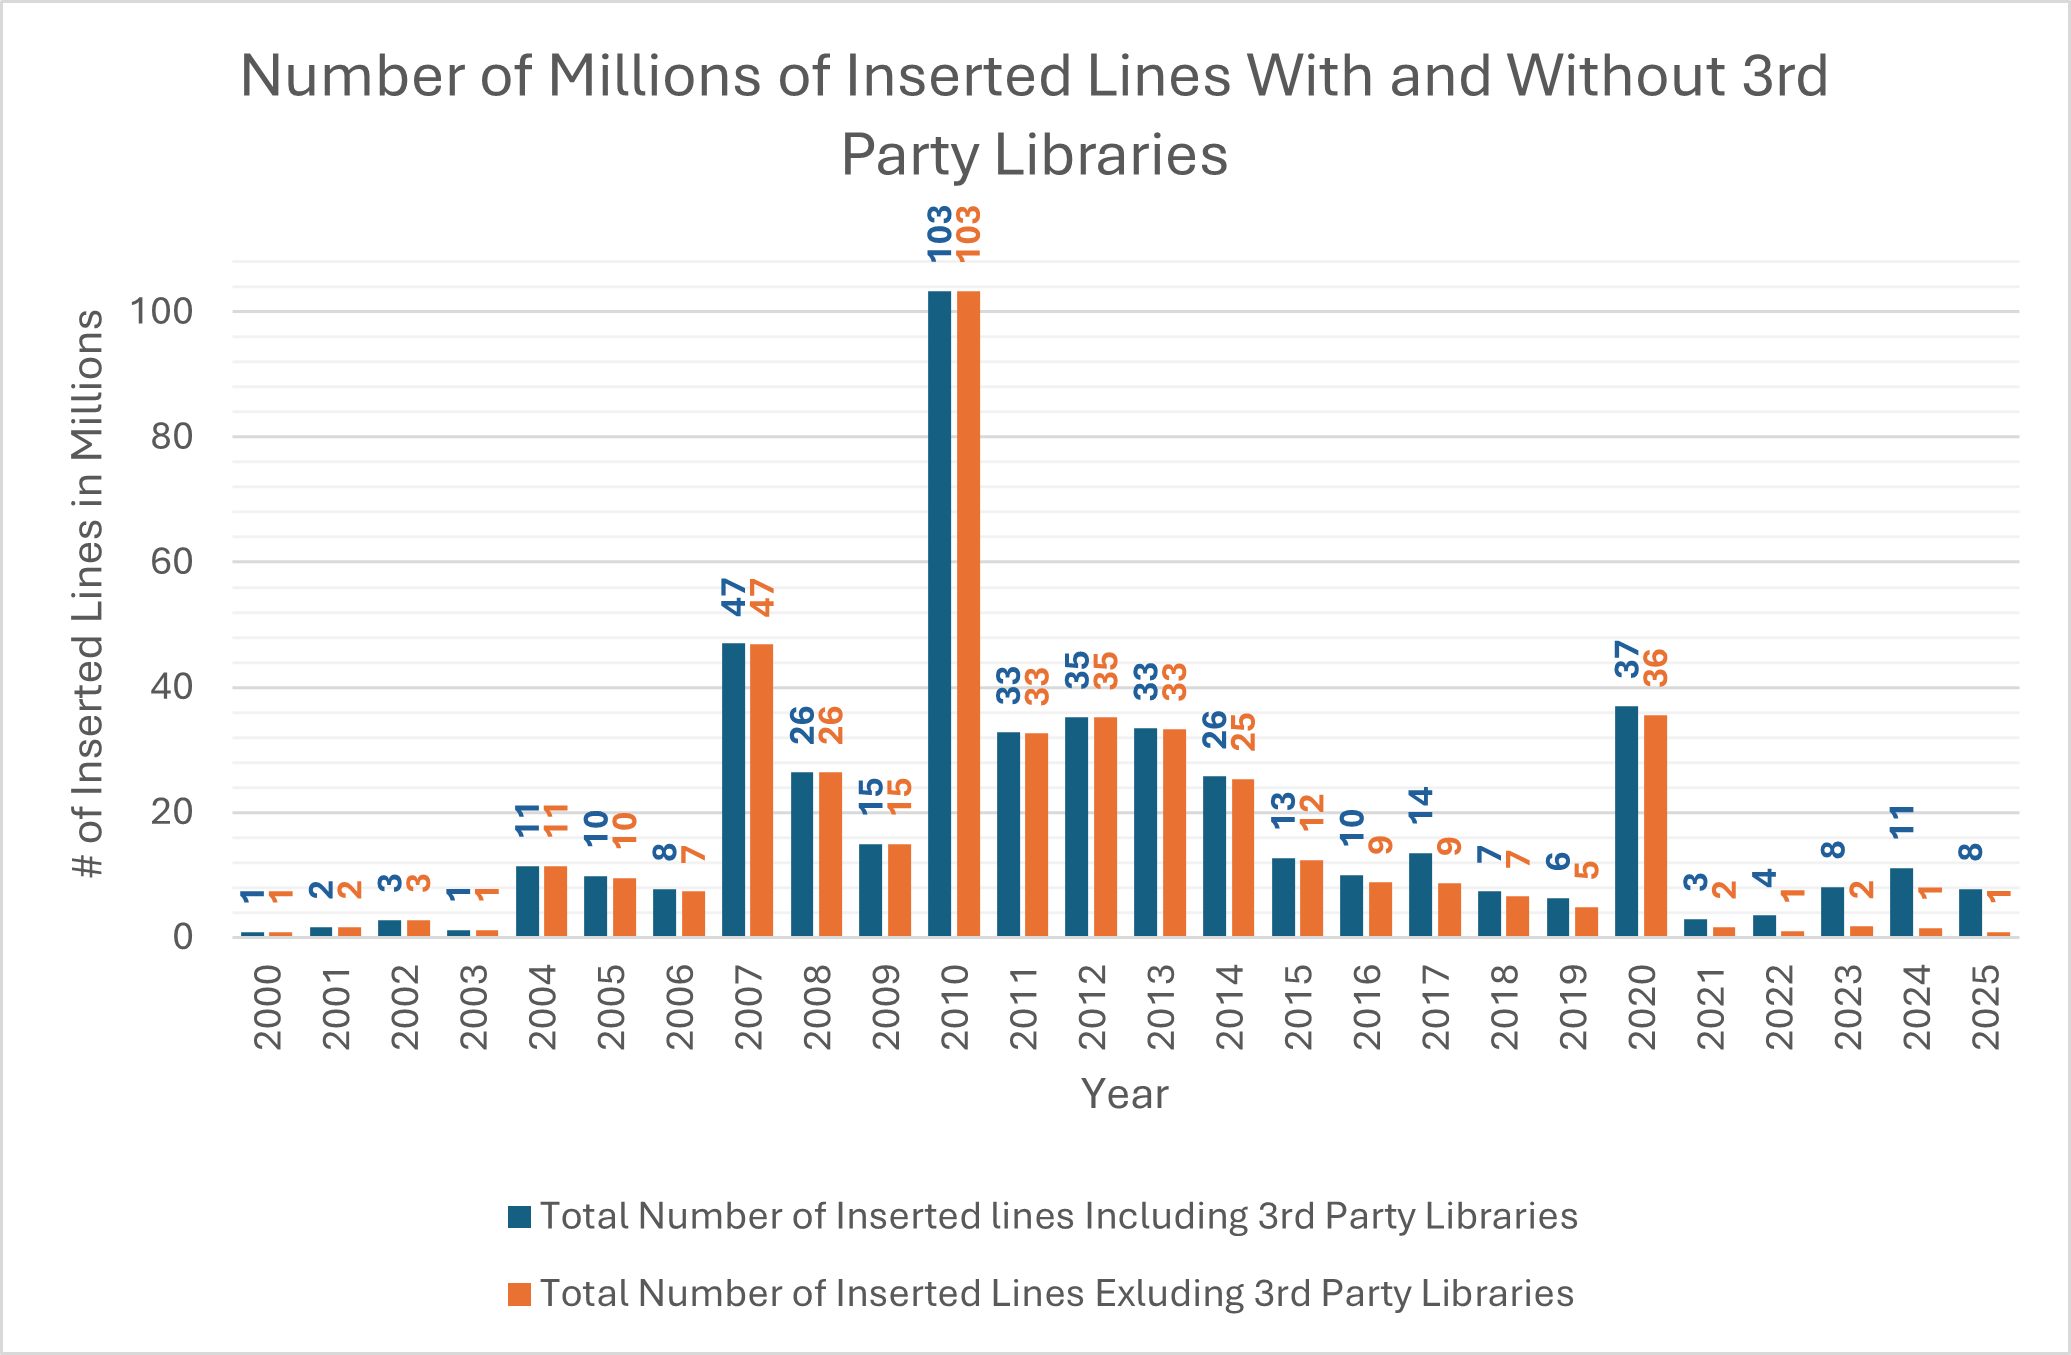
Figure 3- The total number of inserted lines over the years
Figure 3, compares the total number of lines inserted annually, both including and excluding lines from third-party libraries. This distinction is crucial for understanding what constitutes core development versus dependency management.
Third-party libraries are primarily stored in the extra folder of the repository. This folder was included in the initial history import of the Git repository on Monday, July 31, 2000. In order to calculate the 2 measures seen in the graph, the number of inserted lines were summed up for each year (the measure represented in blue in the graph). Then the lines that were under the extra folder have been subtracted to find the total number of inserted lines excluding the 3rd party libraries (the measure represented in orange in the graph).
As seen in Figure 3, except the glitch in 2020 (Dojo update – the related files are not under extra folder), the core development has been decreasing over time (total number of inserted lines excluding 3rd party libraries). Maybe it is because MySQL reached a certain maturity, maybe because quite a bit of investment is made in non-community sections. Unfortunately enterprise and heatwave offerings are not open source and cannot be included in this analysis.
4. Number of Commits with “Heatwave” in the Commit Message
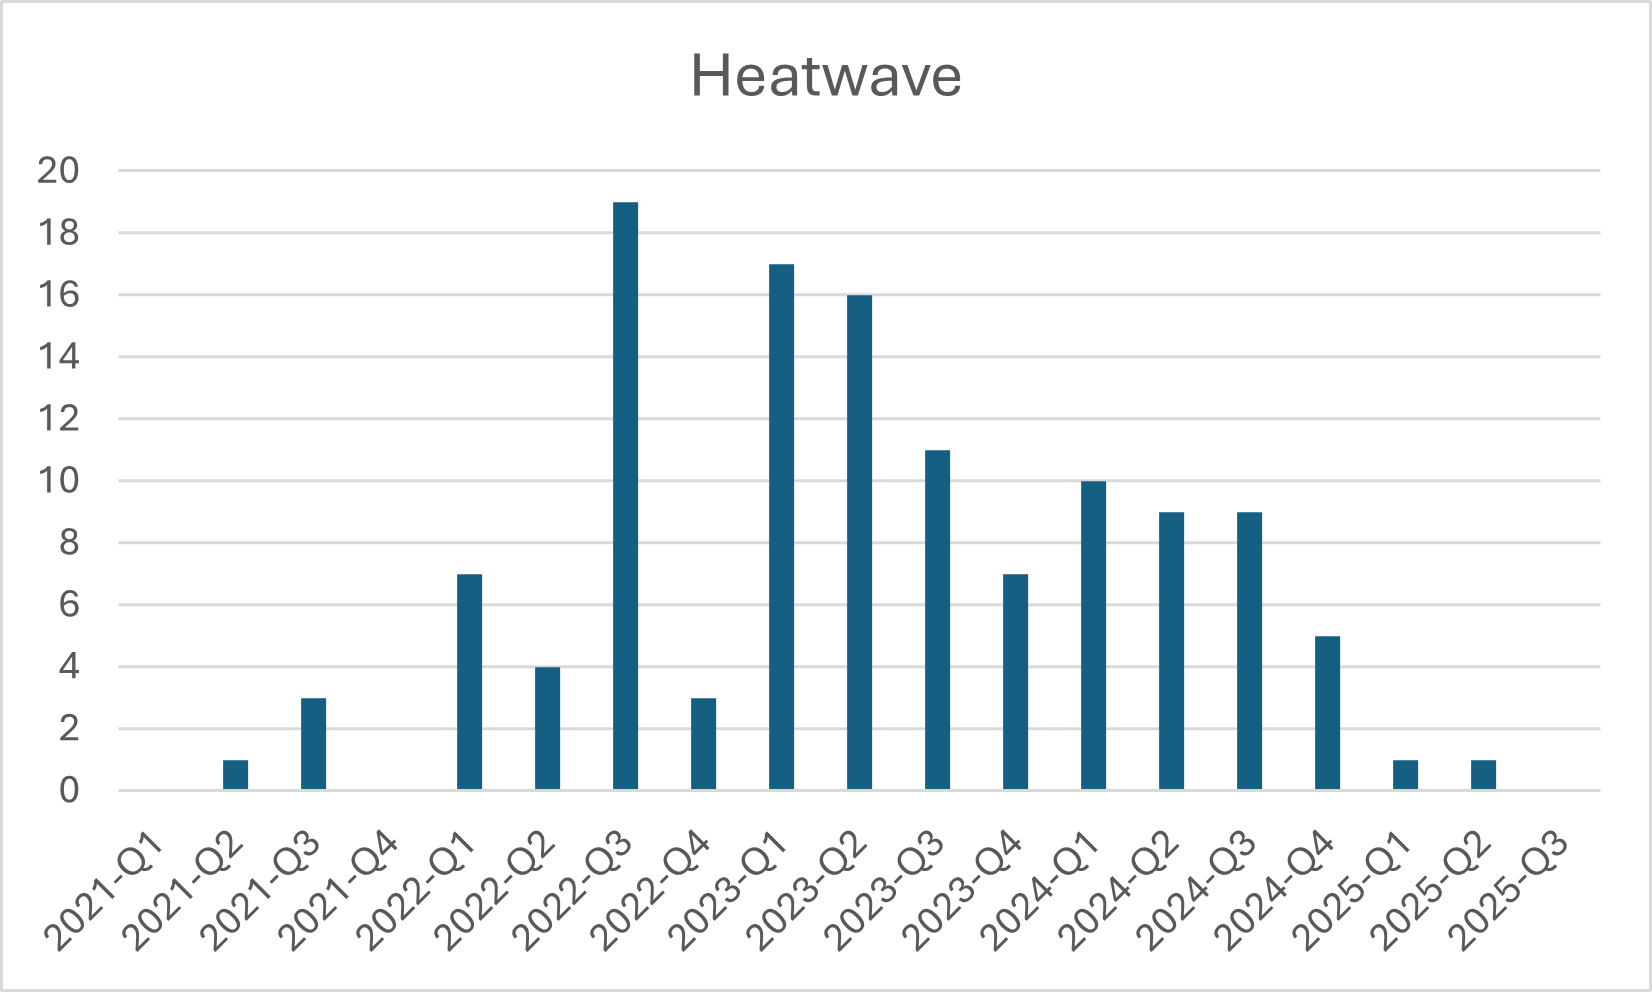
Figure 4- The total number of commits with “heatwave” text in the commit message
To gauge the effort directed towards specific initiatives, we analyze commits explicitly mentioning “Heatwave” in the commit message. Compared to the total number of commits for that year, it is obvious that the commits with heatwave in the message are not that big. The one interesting point is that since 2021, the numbers were increasing but in 2025, there are a total of 5 commits only. Does it mean the need to update the community (core) is no longer there? Or the effort to improve the heatwave is not the focus. Or can it be that the commit messages no longer mention heatwave even though they are targeting heatwave. Just looking at this data point is not conclusive.
🛠️ REPRODUCING the RESULTS: A HIGH-LEVEL OVERVIEW
The statistics presented here were generated by analyzing the entire commit history of the MySQL server repository.
Repository Analysis: A local clone of the official MySQL server Git repository was analyzed using custom Python scripts (available on GitHub).
Data Extraction: The scripts leverage formatted git log commands (–all, –numstat and detailed –pretty=format) to extract key metrics for every single commit: commit hash, commit date, lines added, lines deleted, author identity, has “heatwave” string in message.
Aggregation and Visualization: The raw, per-commit statistics were then aggregated by year and quarter and fed into a visualization tool to produce the final charts, including trend analysis like the moving average prediction.
🧐 CONCLUSION: A SHIFTING HEARTBEAT
The statistics reveal a project that has fundamentally changed its pace and focus over the last two decades.
The project saw its most intense period of commit activity and community breadth in the mid-2000s, followed by the largest core code insertion event in 2010.
The overall trend since 2011 shows a sustained decline in the number of commits and a shrinking pool of unique contributors. The trendline is a clear warning that, without intervention, the general development pace is expected to slow further.
However, the increasing, focused effort on “Heatwave” suggests that development resources are being strategically allocated to high-priority, commercial initiatives within the broader MySQL ecosystem. The project’s heartbeat has not stopped, but it has become quieter in volume and more targeted in its rhythm.


Thanks you, Julia, for this fascinating and thought-provoking analysis. It would be interesting to see a similar analysis for the PostgreSQL repository, to allow us to compare the two projects side-by-side.
Thank you David, great idea for a follow-up blog post.
What about mariadb?
Comparing all three makes sense, and I plan to work on this in the coming weeks as time allows.