On some occasions, we realize the necessity of throttling the number of requests that MongoDB tries to execute per second, be it due to resource saturation remediation, machine change planning, or performance tests. The most direct way of doing this is by tuning the WiredTiger transaction ticket parameters.
Applying this throttle provides more controlled and predictable resource usage, which then protects the instance from unexpected increases in the number of requests that can overwhelm it, saturate its resources, and cause service instability.
MongoDB provided this feature with the concurrency tickets of the algorithm fixedConcurrentTransactions, which allows us to set a maximum number of read and write transactions accepted per second. At MongoDB 7.0, MongoDB Inc. introduced the throughputProbing algorithm to control these concurrency tickets dynamically by probing the ongoing throughput and reacting to it, and it has been the default algorithm since then. Unfortunately, we have seen some specific cases in which the dynamic tickets remain too low for the ongoing throughput in relation to the available resources, so the clients ended up suffering from enqueued requests and increased latency unnecessarily.
One way to overcome this problem is by disabling the new algorithm, which is achieved by setting the parameters storageEngineConcurrentWriteTransactions and storageEngineConcurrentReadTransactions. This change automatically switches throughputProbing with fixedConcurrentTransactions internally. While MongoDB Inc. has not announced when the older algorithm will be deprecated, it may happen in any of the next major version releases. Also, it is very likely that the new algorithm will receive more fixes and optimizations than the old one, so it is a good idea to get used to it. This leads us to wanting more control over it and the ability to customize it to our specific use cases.
To achieve this, we can use the new (and still undocumented to date on the server parameters page) parameters, also added in v7.0: throughputProbingInitialConcurrency, throughputProbingMaxConcurrency, and throughputProbingMinConcurrency. As their names imply, we can now set initial, maximum, and minimum values for the concurrency tickets. A notable change in their behavior is that they are no longer divided into read and write. The values set for maximum and minimum are equally applied to both types of operations, while the initial one is a single one to divide by them, meaning that the initial value per operation type will be half of what is defined in the parameter.
Another change in this new algorithm is that the metrics that report the tickets’ behavior have new names in the output of serverstatus(). They are now exposed as serverstatus.queues.execution.{write,read}.{available,out,totalTickets}.
Environment
To create the tests for this post, I provisioned 2 VMs in Percona’s internal cloud: the first with 4 CPUs and 8 GB RAM (easily stressable), on which I installed Percona Server for MongoDB (PSMDB) v8.0.8 (the latest available to date); and the second with 16 CPUs and 32 GB RAM, on which I installed Mongosh 2.5.6 to serve as a client.
After that, I created eight different collections in the test database and added 500k simple documents to each one. Why eight instead of a big one? Because I was going to spam the server with queries, and the intention was to cause cache misses, resulting in more CPU and disk usage. It is easier to miss with eight collections than with one.
Process
As this post is not about the performance of MongoDB 8.0, but about the new ticket system usage, customization, and metrics, I did not focus on making too many different tests and measuring their durations.
The process involved spamming the server with random queries after loading it with data and checking the metrics for parameterization compliance, ticket saturation, and resource usage.
Metric outputs
Although I tested five different scenarios, only two resulted in numbers that clearly show the impact of the customization.
The first scenario had the default values:
|
1 2 3 4 |
throughputProbingInitialConcurrency: 0 // actually absent. The value zero is the default, but is not accepted in the parameter throughputProbingMaxConcurrency: 128 throughputProbingMinConcurrency: 4 |
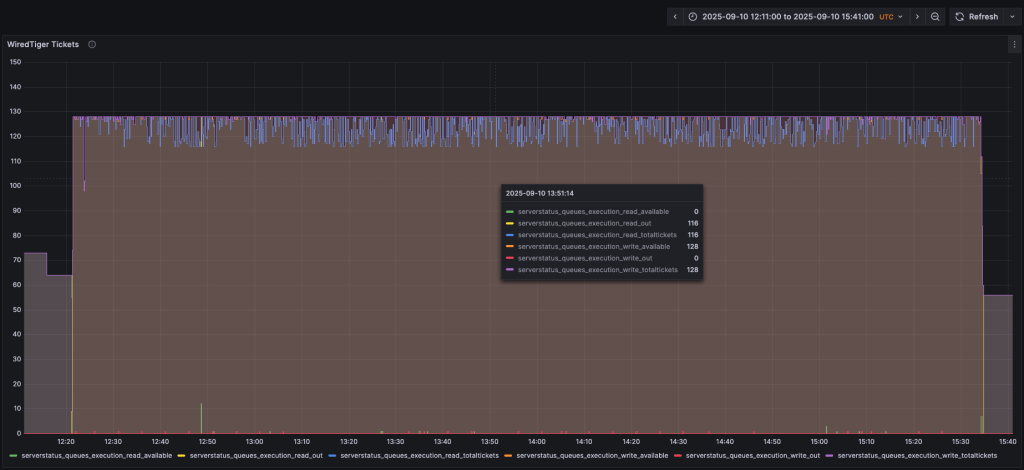
It resulted in a CPU usage always at 100% during the query spam, and multiple spikes of Disk IOPS passing the 10k limit:

The second scenario has a very low maximum limit, very close to the minimum one:
|
1 2 3 |
throughputProbingInitialConcurrency: 4 throughputProbingMaxConcurrency: 8 throughputProbingMinConcurrency: 4 |
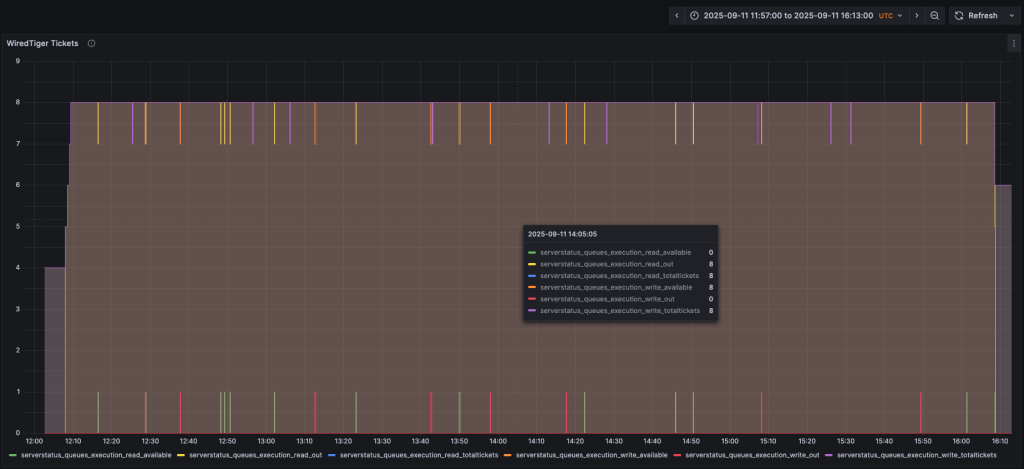
The change resulted in a visible impact on the CPU usage (never over 50%, except for a peak in the end) and Disk IOPS (never reaching the 10k limit):

As a downside, we can observe a reduction in the Ops In Progress rate, which resulted in a notable increase in the Queued Ops rate. As explained in the Introduction, this parameterization applies a throttle to the quantity of requests served to the client. While this protects the instance resources and stability, it can result in queued requests and increased latency perceived by the clients if not properly adjusted to their daily workload.
Conclusion
As the database evolves, we need to keep pace with new features, and concurrency control in MongoDB is an important aspect for the environment’s stability. There are analyses to be done before and after the changes, which is why having a monitoring system in place (Percona Monitoring and Management, for example) to display the metrics is so important. With that, we can reduce the risks and impacts of the downsides for administrators, applications, and clients. If you need any help with setting up and tuning your environment, analyzing metrics for optimization, or any other issues with your databases, Percona Experts are available 24/7 to assist you.