

Evolution is one of the inherent traits of modern software. Many people reach out to product teams daily, asking to add more functionality to the software products they use and love. This is understandable: there will always be ways to make a product better by adding more features to the users’ delight so they can solve their problems in less time and with less effort.
We are always hard at work trying to keep Percona Monitoring and Management (PMM) as competitive as possible. While PMM does a good job today in terms of monitoring users’ infrastructure, it does not offer logging functionality yet. However, logging is one of the three pillars of observability, and we seriously consider making it part of our product at a certain point in time. To that effect, we have recently had a number of discussions to get the ball rolling and figure out the optimal architecture for logging so we can keep PMM robust, performant, and capable of handling substantial workloads.
You may say that sounds good, but it’ll take you guys some time to deliver it. Can I add logging to PMM by myself?
By all means! In this post, I will explore one of the possible ways to do it.
What’s the plan?
There’s really not much to it:
- Take the latest version of PMM v3
- Add a logging stack to it
- Configure the installed tools
- Start PMM and enjoy logging!
OK, let’s see how we can get there by following the plan above.
Which PMM distribution should I take and why?
We ship PMM in three flavors: container image, AMI, and OVF. Currently, PMM’s most popular distribution is the container image. You can deploy it with Docker or Podman or with any other OCI-compatible container orchestration system, including Kubernetes. One of the greatest features of containers is multi-stage builds. It allows you to grab an arbitrary image and install some software to it in order to augment its capabilities. Actually, many companies around the world, including Percona, are leveraging multi-stage builds to produce their software, be it for public or private distribution. This makes it a good fit for such a purpose.
What logging tool should I choose?
There are plenty of awesome open source logging tools out there. One important thing to keep in mind is their compatibility with PMM. So far, we have tested only two products:
I’ll choose the former for two main reasons:
- Better overall performance, including disk and CPU
- Lower contribution to the increase in container image size
You will probably notice that Victorialogs is authored by Victoriametrics, whose product we already use in PMM as a Prometheus-compatible metrics engine. I agree; that sounds biased. Therefore, if Loki looks like a better choice, it will also do the job.
The tech stack
When it comes to logging, it’s important to visualize the whole process from start to finish.

One of the challenges of any logging solution is that log files may come in a variety of different formats. Therefore, for Victorialogs to be able to understand the format and efficiently store the logs, they need to be parsed first. Parsing is shown as the first phase on the diagram. The parser needs to know where to locate the log file, which format the logs are written in, and where to send the parsed logs. To make it rather simple, we will use a well-known and battle-tested parser called promtail.
The second phase is normally referred to as log ingestion, which is when Victorialogs receives the logs from the parser and compresses and stores the parsed log lines for later retrieval.
Phase three is known as log querying or, otherwise, log retrieval. Normally, any logging solution would offer a log query language. Victorialogs’ query language is called LogsQL. It features a lot of language constructs and parameters, which you probably don’t need to learn all from the start. The majority of simple queries and use cases, like retrieving log errors or finding a specific attribute value, are abstracted away by the data source’s user interface. This last phase is called log visualization or log analysis. When I started exploring Victorialogs for the first time, I was able to get up to speed in a record time. Certainly, more complex tasks would require the user to get some degree of familiarity with the query language. Luckily, their documentation is abundant with examples, which may be super helpful.
Choosing the automation tool
I like to use automation whenever I can, simply because it allows me to create reproducible scenarios. Whether you need to make a change, upgrade dependencies, or simply experiment with your code — automation is your friend. You write it once, but you can run it as many times as you need.
You can obviously choose any automation tool you like, but I’ll use the one that ships with PMM: Ansible. We use Ansible playbooks mainly to build PMM, but Ansible also kicks in when the users migrate from an older version to the most recent one.
Preparing an Ansible playbook
First, let’s see what our directory structure will ultimately look like:
|
1 2 3 4 5 6 7 8 9 10 11 |
victorialogs ├── files │ ├── json_log_format.conf │ ├── promtail.yml │ ├── victorialogs.ini │ ├── victorialogs.yml │ └── vlogs_location.conf ├── tasks │ └── main.yml ├── Dockerfile └── victorialogs.yml |
The playbook file victorialogs.yml is stored in the root directory along with Dockerfile. Following the conventional directory structure of Ansible, the tasks are stored in the tasks directory, and the rest of the auxiliary files are stored in the files directory.
We’ll create our playbook victorialogs.yml, which is very simple:
|
1 2 3 4 5 6 7 8 9 |
--- - hosts: localhost become: yes vars: victorialogs_version: "1.17.0" # <https://github.com/VictoriaMetrics/VictoriaMetrics/releases> victorialogs_datasource_version: "0.16.2" # <https://github.com/VictoriaMetrics/victorialogs-datasource/releases> tasks: - name: Provisioning tasks ansible.builtin.import_tasks: tasks/main.yml |
For your convenience, I’m providing the software versions as variables in this playbook, along with their respective URLs, which you can visit to find the latest software versions. These products are well maintained and get quite frequent updates. When reading this article, you will find the versions above outdated, and you will most probably want to install the most recent version.
The tasks file contains a set of ansible tasks that will be executed to:
- Download the tools
- Install them
- Configure them
- Clean up cache and tmp files
Let’s create main.yml file with the following content and save it in the tasks directory:
|
1 2 3 4 5 6 7 8 9 10 11 12 13 14 15 16 17 18 19 20 21 22 23 24 25 26 27 28 29 30 31 32 33 34 35 36 37 38 39 40 41 42 43 44 45 46 47 48 49 50 51 52 53 54 55 56 57 58 59 60 61 62 63 64 65 66 67 68 69 70 71 72 73 74 75 76 77 78 79 80 81 82 83 84 85 86 87 88 89 90 91 92 93 94 95 96 97 98 99 100 101 102 103 104 105 106 107 108 109 110 111 112 113 114 115 116 117 118 119 120 121 122 123 124 125 |
--- - name: Download and unarchive Victorialogs unarchive: src: "<https://github.com/VictoriaMetrics/VictoriaMetrics/releases/download/v>{{ victorialogs_version }}-victorialogs/victoria-logs-linux-amd64-v{{ victorialogs_version }}-victorialogs.tar.gz" dest: /tmp remote_src: yes - name: Copy victorialogs binary copy: src: /tmp/victoria-logs-prod dest: /usr/local/bin/victoria-logs mode: 0755 - name: Remove the temporary file file: path: /tmp/victoria-logs-prod state: absent - name: Download and unarchive victorialogs-datasource unarchive: src: "<https://github.com/VictoriaMetrics/victorialogs-datasource/releases/download/v>{{ victorialogs_datasource_version }}/victoriametrics-logs-datasource-v{{ victorialogs_datasource_version }}.tar.gz" dest: /srv/grafana/plugins remote_src: yes - name: Change ownership of victoriametrics-logs-datasource file: path: /srv/grafana/plugins/victoriametrics-logs-datasource owner: pmm group: pmm recurse: yes - name: Add Grafana RPM repository yum_repository: name: grafana description: Grafana repository baseurl: <https://rpm.grafana.com> gpgcheck: yes enabled: no gpgkey: <https://rpm.grafana.com/gpg.key> sslverify: yes sslcacert: /etc/pki/tls/certs/ca-bundle.crt - name: Install Promtail dnf: name: promtail state: latest disablerepo: "*" enablerepo: grafana - name: Create promtail user user: name: "{{ item.name }}" uid: "{{ item.uid }}" comment: "{{ item.comment }}" shell: "{{ item.shell }}" group: "{{ item.group }}" create_home: false loop: - { name: promtail, uid: 1001, comment: "Promtail user", shell: "/sbin/nologin", group: pmm, } - name: Create a directory for Victorialogs file: path: /srv/victorialogs/data state: directory owner: pmm group: pmm recurse: yes - name: Copy Supervisord config file for Victorialogs and Promtail copy: src: victorialogs.ini dest: /etc/supervisord.d/victorialogs.ini owner: pmm group: pmm - name: Copy Promtail config file copy: src: promtail.yml dest: /srv/victorialogs/promtail.yml owner: pmm group: pmm - name: Copy Victorialogs datasource file copy: src: victorialogs.yml dest: /usr/share/grafana/conf/provisioning/datasources/victorialogs.yml owner: pmm group: pmm - name: Remove the end of log_format line in nginx.conf command: sed -i 's/^([[:space:]]*log_format main).*/1/' /etc/nginx/nginx.conf - name: Remove the log_format in nginx.conf command: sed -i '/log_format/{n;N;d;}' /etc/nginx/nginx.conf - name: Replace the original log_format with a json one blockinfile: path: /etc/nginx/nginx.conf marker: "{mark}" marker_begin: "#LOG_FORMAT_BEGIN" marker_end: "#LOG_FORMAT_END" insertafter: "log_format" block: "{{ lookup('ansible.builtin.file', '/tmp/ansible/files/nginx_logfmt.conf') }}" - name: Remove ansible markers from nginx.conf command: sed -i '/^#LOG_FORMAT_.*/d' /etc/nginx/nginx.conf - name: Add VictoriaLogs location to pmm.conf blockinfile: path: /etc/nginx/conf.d/pmm.conf marker: "{mark}" marker_begin: "#VLOGS_LOCATION_BEGIN" marker_end: "#VLOGS_LOCATION_END" insertbefore: "# Swagger UI" block: "{{ lookup('ansible.builtin.file', '/tmp/ansible/files/vlogs_location.conf') }}" - name: Remove ansible markers from pmm.conf command: sed -i '/^#VLOGS_LOCATION_.*/d' /etc/nginx/conf.d/pmm.conf - name: Clean dnf cache command: dnf clean all - name: Remove dnf and yum cache directories command: rm -rf /var/cache/dnf /var/cache/yum |
Configuring the tools
To configure the tools, we will need to create five more files, all of which will be placed in the files directory.
Let’s proceed with creating the victorialogs.ini file. This file configures the runtime parameters for promtail and victorialogs and delegated process management to the supervisor.
|
1 2 3 4 5 6 7 8 9 10 11 12 13 14 15 16 17 18 19 20 21 22 23 24 25 26 27 28 29 30 31 32 33 |
priority = 20 command = /usr/local/bin/victoria-logs -storageDataPath=/srv/victorialogs/data -retentionPeriod=30d -httpListenAddr=0.0.0.0:9428 -envflag.enable -envflag.prefix=VL_ user = pmm autorestart = true autostart = true startretries = 1000 startsecs = 3 stopsignal = TERM stopwaitsecs = 10 stdout_logfile = /srv/logs/victorialogs.log stdout_logfile_maxbytes = 20MB stdout_logfile_backups = 3 redirect_stderr = true [program:promtail] priority = 21 command = /usr/bin/promtail -config.file /srv/victorialogs/promtail.yml user = pmm autorestart = true autostart = true startretries = 1000 startsecs = 3 stopsignal = TERM stopwaitsecs = 10 stdout_logfile = /srv/logs/promtail.log stdout_logfile_maxbytes = 20MB stdout_logfile_backups = 3 redirect_stderr = true |
I have to mention that victoria-logs executable can be further configured using the environment variables, which you must prefix with VL_ and pass to the PMM container as usual. For example, let’s assume you want to set the retention period for your logs to be 8 weeks instead of 30 days:
|
1 |
docker run -d --name pmm-server -e VL_RETENTION_PERIOD=8w ... |
What logs to collect?
In production environments, you’ll want to collect the logs from various types of infrastructure, such as database nodes. However, that kind of setup is quite complex and is, therefore, out of the scope of this post. So, we’ll target only the logs that are generated by PMM components within the container. Let’s go ahead and create promtail.yml file that provides a so-called “scrape configuration” per each log file, including promtail itself:
|
1 2 3 4 5 6 7 8 9 10 11 12 13 14 15 16 17 18 19 20 21 22 23 24 25 26 27 28 29 30 31 32 33 34 35 36 37 38 39 40 41 42 43 44 45 46 47 48 49 50 51 52 53 54 55 56 57 58 59 60 61 62 63 64 65 66 67 68 69 70 71 72 73 74 75 76 77 78 79 80 81 82 83 |
server: http_listen_port: 9080 grpc_listen_port: 0 positions: filename: /tmp/positions.yaml clients: - url: <http://127.0.0.1:9428/insert/loki/api/v1/push?_stream_fields=instance,job,host&_msg_field=msg&_time_field=time&ignore_fields=filename,stream> scrape_configs: - job_name: nginx static_configs: - targets: - 127.0.0.1 labels: job: nginx __path__: /srv/logs/nginx.log - job_name: grafana static_configs: - targets: - 127.0.0.1 labels: job: grafana __path__: /srv/logs/grafana.log - job_name: pmm-agent static_configs: - targets: - 127.0.0.1 labels: job: pmm-agent __path__: /srv/logs/pmm-agent.log node_name: pmm-server - job_name: pmm-managed static_configs: - targets: - 127.0.0.1 labels: job: pmm-managed __path__: /srv/logs/pmm-managed.log - job_name: qan static_configs: - targets: - 127.0.0.1 labels: job: qan __path__: /srv/logs/qani-api2.log - job_name: victoriametrics static_configs: - targets: - 127.0.0.1 labels: job: victoriametrics __path__: /srv/logs/victoriametrics.log - job_name: clickhouse static_configs: - targets: - 127.0.0.1 labels: job: clickhouse __path__: /srv/logs/clickhouse-server.log - job_name: supervisor static_configs: - targets: - 127.0.0.1 labels: job: supervisor __path__: /srv/logs/supervisord.log - job_name: promtail static_configs: - targets: - 127.0.0.1 labels: job: promtail __path__: /srv/logs/promtail.log |
Nice job! This configuration allows the injection of logs from nine different sources.
You will note that the path to every log file begins with /srv/logs – this is the root directory where PMM stores the logs of all the components. You can use a special labels: section to assign custom labels to every log line being parsed. That is necessary so you can tell where the logs originate from when making queries.
I will not expand on the log ingestion format but only mention that Victorialogs allows you to ingest logs in many different formats, including the “Loki” format, which promtail will use to send the logs in (see above).
Next, we need to configure the data source, which is essentially a Grafana plugin. It allows users to query and visualize the logs in the PMM user interface. Let’s create one more file — victorialogs.yml — with the following content:
|
1 2 3 4 5 6 7 8 9 10 11 12 |
apiVersion: 1 datasources: # <string, required> Name of the VictoriaLogs datasource displayed on panels. - name: VictoriaLogs # <string, required> Sets the data source type. type: victoriametrics-logs-datasource uid: victorialogs # <string, required> Sets the access mode, either proxy or direct. access: proxy # <string> Sets URL for sending queries to VictoriaLogs server. # see <https://docs.victoriametrics.com/victorialogs/querying/> url: <http://127.0.0.1:9428> |
We will also create vlogs_location.conf, which will be used to patch the configuration of our Nginx proxy. This will expose two more URLs within PMM. The first URL lets the user navigate to the Victoriametrics UI, while the second proxies the log query requests to the Victoriametrics backend.
|
1 2 3 4 5 6 7 8 9 10 11 12 13 |
location /vmui { proxy_pass <http://127.0.0.1:9428/select/vmui>; proxy_http_version 1.1; proxy_read_timeout 600; proxy_set_header Connection ""; } location /select/logsql { proxy_pass http://127.0.0.1:9428$request_uri; proxy_http_version 1.1; proxy_read_timeout 600; proxy_set_header Connection ""; } |
One final patch to nginx proxy configuration is needed to make sure nginx logs are formatted in “logfmt” similar to other PMM logs. Create a file nginx_logfmt.conf as follows:
|
1 2 3 4 5 6 7 8 9 10 11 12 |
'time="$time_iso8601" ' 'host=$http_host ' 'remote_addr=$remote_addr ' 'request_method=$request_method ' 'request="$request_uri" ' 'request_time=$request_time ' 'body_bytes_sent=$body_bytes_sent ' 'server_protocol="$server_protocol" ' 'status=$status ' 'http_referrer="$http_referer" ' 'http_x_forwarded_for="$http_x_forwarded_for" ' 'http_user_agent="$http_user_agent"'; |
Building the image
Now that we have prepared the stage let’s see how we can actually build the container. Our Dockerfile is very simple:
|
1 2 3 4 5 6 7 8 9 10 11 |
FROM percona/pmm-server:3 USER root COPY ./ /tmp/ansible RUN ansible-playbook -vvv -c local /tmp/ansible/victorialogs.yml EXPOSE 9428 # optional, to enable external log ingestion USER pmm |
With FROM percona/pmm-server:3 we are making sure to pull the latest version of PMM available at the time of building. Then, we just copy over the playbook files we created earlier and run the playbook. Once the playbook succeeds, we can optionally expose port 9428, which Victorialogs will be listening on, to make it possible to inject logs from outside of PMM.
Finally, you can proceed with building the container by running the following command, which should give you a fresh container image named local/pmm-server:victorialogs:
|
1 |
docker buildx build --platform=linux/amd64 --progress=plain -t local/pmm-server:victorialogs . |
When launching the container, do not forget to use the new image name:
|
1 |
docker run -d --restart=always --name pmm-server -p 443:8443 -v pmm-data:/srv local/pmm-server:victorialogs |
Exploring the user interface
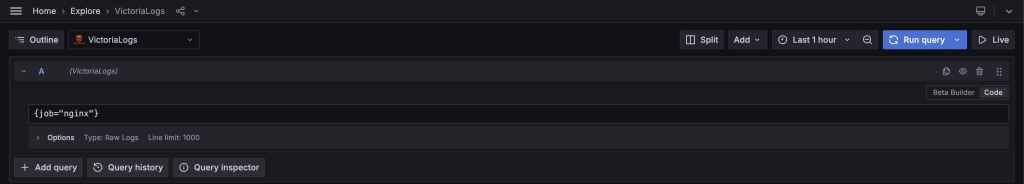
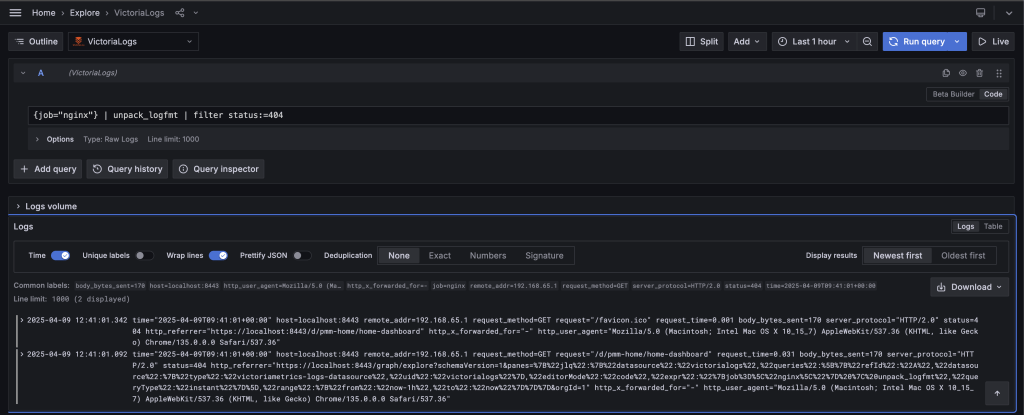
Once you get your PMM instance up and running, you can let it run for a while to generate some logs. Then click on the “Explore” menu item, choose the “Victorialogs” data source that we have provisioned at build time, and switch the editor mode (in the upper right) to “Code.”
Now, you can begin querying the logs. Let’s choose the source of logs. In my case, Nginx logs seem to be a good starting point (check the syntax below).
However, as we mentioned before, for Victorialogs to query the logs, we need to instruct it on their format. This can be achieved by passing our logs through the unpack_logfmt pipe (see below).
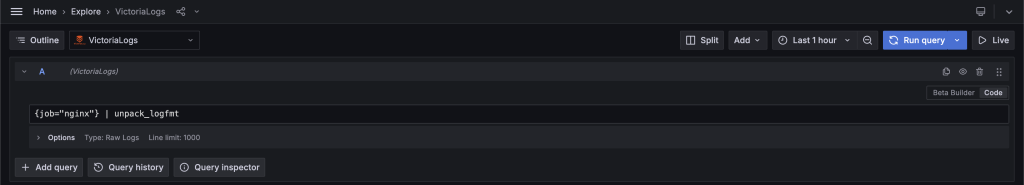
Victorialogs features quite a number of pipes for different use cases, including unpack_json, which you’ll want to use if the logs are produced in JSON format. I encourage you to get familiar with the pipes since they provide a way to extract virtually anything you like from the logs.
To query and visualize the logs, adjust the time range (in my case, it’s “Last 1 hour”) and press Run query. You should see a list of log lines ordered by time in descending order, i.e., “Newest first.”
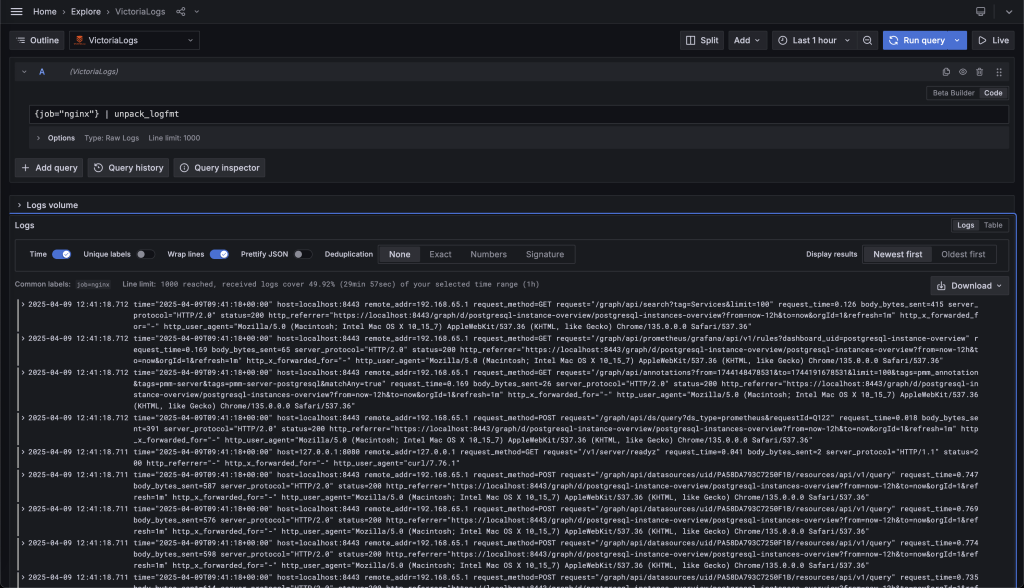
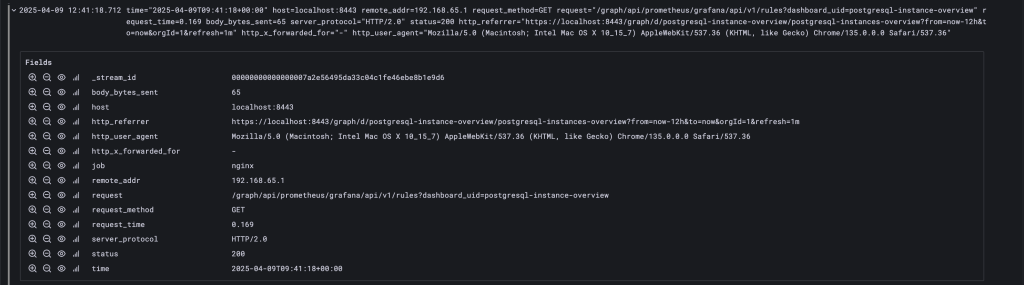
All the lines are collapsed by default, so if a certain line is of interest, you can always expand it by clicking the little “chevron” icon that can be found at the beginning of each line.
Now, let’s imagine you want to know which Nginx requests end up with a 404 error, which stands for “Not found.” Again, that can be achieved using another very powerful filter pipe (see below).
You can certainly use the filter pipe with any other log attribute, be it remote_addr, host, body_bytes_sent, etc. You can also use boolean operators to combine several attributes.
Just keep in mind that every log file will have its own set of log attributes to filter on.
Conclusion
PMM is an extremely flexible product thanks to its architecture. In this post, we just scratched the surface of what’s possible to augment its functionality. We hope it will inspire you to experiment with PMM in any way you like 🔬
Hold on, did I mention that Victorialogs integrates well with PMM alerting? Well, it does! But I prefer to save this topic for another blog post! 😊
We can’t wait to hear how far you can go with your logging tool added to PMM and what your experience is. It will help us better understand your needs and use cases.
Percona Monitoring and Management is a best-of-breed open source database monitoring solution tool for MySQL, PostgreSQL, MongoDB, and the servers on which they run. It allows you to monitor, manage, and improve the performance of your databases, no matter where they are located or deployed.
Download Percona Monitoring and Management Today
About the Author
 Alexander Demidoff
I'm a software engineer and architect with decades of experience in the software industry. In the past, I developed scalable web apps powered by open source databases. Now I'm contributing to the software experiences of the users of our own monitoring and management solution known as PMM.


Great post! I was wondering what kind of feature requests have been made for PMM to add logging support. I’d like to contribute, but I’m not sure how to get started.
I have some experience with observability, mostly using Elastic/OpenSearch, which are both quite heavy. Still, I’m interested in learning about other tools that could help.
I also read that Promtail is reaching end-of-life next year — could I help by contributing support for another log shipper like Fluent Bit?
If needed, I’m also happy to create an Ansible playbook with a Dockerfile to help with deployment or testing.
I only know of two tickets raised internally, but those are more of a PoC nature rather than feature requests.
https://perconadev.atlassian.net/browse/PMM-13391
https://perconadev.atlassian.net/browse/PMM-9315
However, I have no doubt the logging functionality would be appreciated by the community.
I agree, OpenSearch doesn’t seem to be a good fit for PMM, primarily for the reasons of performance. On top of that it’s a huge component, and we want to see PMM grow that much in size.
In terms of the choice of tools, we are looking to leverage the underutilized power of ClickHouse, which seems to be a great choice for several reasons:
Regarding Promtail and Fluent Bit: both are great products, but IMO both are probably not the best fit for PMM. The reason I picked up Promtail was to show what’s possible, and with minimal, ideally “no-code”, effort.
When it comes to experimenting or contributing, I suggest you look at the combination of open-telemetry (Otel) collector and ClickHouse. I do not rule out those two could work well together. Otel seems to be truly committed to open-source and it’s popularity is growing.
Sure, Ansible and Dockerfile are what we think would be the easiest way to contribute.
Thanks for your feedback and have fun!