

When working with MongoDB replication in environments using the WiredTiger storage engine, you may encounter data size discrepancies between PRIMARY and SECONDARY nodes. When this problem arises, the SECONDARY node uses significantly more disk space than the PRIMARY instance.
When this issue first appeared at Percona Support a few years ago, the most notable discussion thread emerged in the following MongoDB JIRA ticket:
https://jira.mongodb.org/browse/SERVER-39656
Long story short, a theory for this issue is that a high percentage of dirty pages, combined with the requirement to keep documents in cache until a majority concern is confirmed, leads to memory pressure and aggressive eviction in the secondary, which can result in increased page splitting.
Some background information: As described in the WiredTiger documentation, MongoDB chose a 4 KB allocation size for several reasons. Here are the key points, quoted ipsis litteris from the documentation:
Default: 4 KB
Motivation to tune the value:
- Most applications should not need to tune the allocation size.
- The 4 KB size is chosen to be compatible with virtual memory page sizes and direct I/O requirements on most platforms (4 KB for most common server platforms).
- Smaller values decrease the file space required by overflow items. For example, if the allocation size is set to 4 KB, an overflow item of 18,000 bytes requires 5 allocation units and wastes about 2 KB of space. If the allocation size is 16 KB, the same overflow item would waste more than 10 KB.
WiredTiger Documentation – Tuning Page Size and Compression
Identifying the problem
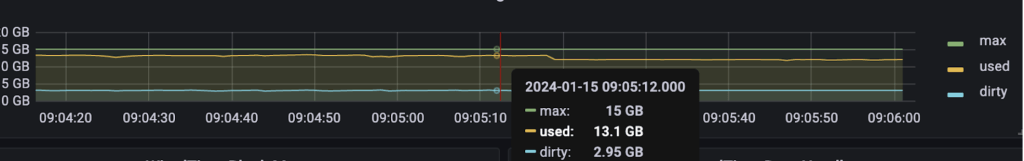
In one of our scenarios, we observed aggressive eviction occurring on the secondary node, accompanied by a steady 20% of dirty pages in the WiredTiger cache. This could be seen in analyzing the MongoDB metrics with a monitoring tool such as Percona Monitoring and Management:
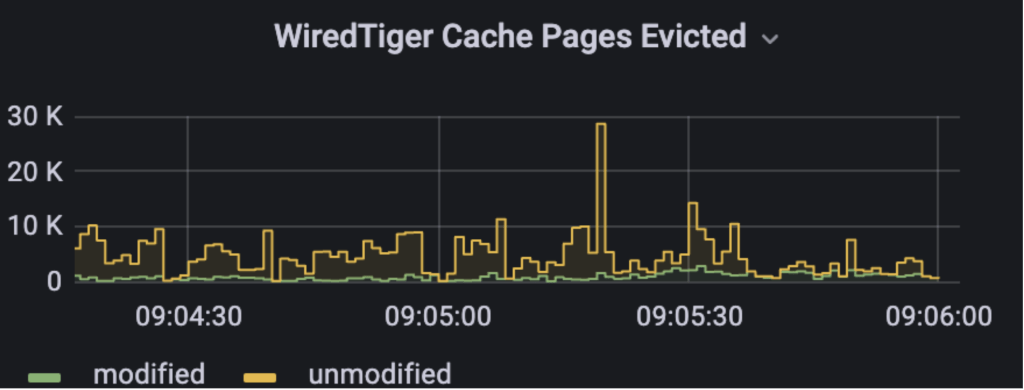
It is important to note that 20% is the default value for the eviction_dirty_trigger parameter. Once this threshold is reached, application threads will be throttled, which can result in not only disk size issues but also performance problems. However, we will not delve into the performance aspects in this post, as it would extend the discussion significantly. In case you are interested in the details of the WiredTiger eviction process, please refer to the official documentation:
https://source.wiredtiger.com/11.2.0/tune_cache.html#cache_eviction
A Perconian also wrote a blog post that addresses this issue for bulk loads:
Tuning MongoDB For Bulks Loads
Addressing the data size issue
To address this issue, I suggest two configuration changes that can be tested to alleviate the problem:
- Lower the replBatchLimitOperations:
This setting controls the maximum number of operations applied in a single batch during replication. We can reduce the memory pressure on the secondary node by reducing this limit by processing smaller batches.
Recommended change: Set replBatchLimitOperations(default is 5000) to 500-1000. This setting can be changed both dynamically and in the configuration file. To change it online:
1mongo> db.adminCommand( { "setParameter": 1, "replBatchLimitOperations": 1000})
To modify the configuration file:
12setParameter:replBatchLimitOperations: 1000 - Lower the replWriterThreadCount:
This parameter controls the number of threads used for replication writes(the default is 16) on the secondary node. Reducing the thread count can decrease the out-of-order application of writes, allowing more write-combining and less page splitting, which could alleviate the bloating issue. Setting it to 1 will remove both parallelism and the out-of-order issue.Recommended change: This parameter is not dynamic, so it is necessary to set replWriterThreadCount to 1 in the configuration file.
12setParameter:replWriterThreadCount: 1
It’s essential to test these changes carefully, as they may have varying impacts on the replication performance.
Important note: These changes are intended to prevent further data differences from occurring. They will not resolve any existing discrepancies in the dataset. Executing an initial sync or a compact operation is necessary to solve past disk size differences.
We recommend applying one change at a time to determine which adjustment effectively addresses the issue.
Conclusion
Addressing data size discrepancies between PRIMARY and SECONDARY nodes in MongoDB environments requires a balance of configuration adjustments. The problem often arises due to memory pressure on the secondary nodes, leading to aggressive eviction and page splitting. By adjusting the replBatchLimitOperations and replWriterThreadCount settings, we can alleviate memory pressure and reduce the risk of data size discrepancies. However, these changes should be applied and tested incrementally to assess their impact on replication performance.
MongoDB Performance Tuning is a collection of insights, strategies, and best practices from Percona’s MongoDB experts. Use it to diagnose — and correct — the issues that may be affecting your database’s performance.
Download MongoDB Performance Tuning
About the Author
 Vinicius Grippa
Vinicius Grippa is a Lead Database Engineer at Percona, an Oracle ACE Director, MySQL Rockstar, and co-author of Learning MySQL. With a Bachelor’s degree in Computer Science and 18 years of experience, he specializes in designing databases for mission-critical applications, focusing on MySQL and MongoDB ecosystems. As part of Percona’s Support team, he has assisted customers in resolving complex database challenges across a wide range of scenarios. An active member of the open-source community, he leads the MySQL User Group in Brazil and engages in knowledge sharing through Slack, Meetups, and international conferences, including FOSDEM, Percona Live, and events across Europe, Asia, and the Americas.


How to identify the issue without PMM? What queries might be used?
These metrics come from the
db.serverStatus()command.The metrics from the dashboard above of pages evicted:
And for WT cache numbers:
Note, however, that you will need to calculate the details manually.
FTDC data also have this information; you can use keyhole or big hole to visualize the metrics. The big hole repo:
https://github.com/zelmario/Big-hole