

Downsampling is the process by which we can selectively prune (discard, summarize, or recalculate) data from a series of samples in order to decrease how much storage is consumed. This has the downside of reducing the accuracy of the data, but has the great benefit of allowing us to store data from a wider sampling (time) range in less space. In Percona Monitoring and Management (PMM), this can be used for metrics that are no longer needed at the default high-rate resolutions while still being able to have a reference on the order of magnitude at any given time in the past. This allows us to easily and cost-effectively scale up the number of days we store metrics for; in other words, we can increase the data retention period without the need to proportionally add more resources.
PMM and VictoriaMetrics
From version 2.12 onwards, PMM dropped Prometheus in favor of VictoriaMetrics. As part of our partnership with VictoriaMetrics, the downsampling functionality, which is otherwise an enterprise-only feature, is available to be used with PMM. Briefly quoting the online documentation, we can see what it is and how easy it is to use:
https://docs.victoriametrics.com/#downsampling
“VictoriaMetrics Enterprise supports multi-level downsampling via -downsampling.period=offset:interval command-line flag. This command-line flag instructs leaving the last sample per each interval for time series samples older than the offset. For example, -downsampling.period=30d:5m instructs leaving the last sample per each 5-minute interval for samples older than 30 days while the rest of the samples are dropped.
The -downsampling.period command-line flag can be specified multiple times in order to apply different downsampling levels for different time ranges (aka multi-level downsampling). For example, -downsampling.period=30d:5m,180d:1h instructs leaving the last sample per each 5-minute interval for samples older than 30 days, while leaving the last sample per each 1-hour interval for samples older than 180 days.
VictoriaMetrics supports configuring independent downsampling per different sets of time series via -downsampling.period=filter:offset:interval syntax. In this case the given offset:interval downsampling is applied only to time series matching the given filter. The filter can contain arbitrary series filter. For example, -downsampling.period='{__name__=~”(node|process)_.*”}:1d:1m instructs VictoriaMetrics to deduplicate samples older than one day with one minute interval only for time series with names starting with node_ or process_ prefixes. The de-duplication for other time series can be configured independently via additional -downsampling.period command-line flags.”
Enabling downsampling in PMM
By default, PMM will only store data for the past 30 days, so we’ll use this as a baseline for our initial most basic example (check the online documentation here and here for more information on defaults). Let’s say we want to keep default sampling rates for the first 10 days and then downsample them in two tiers: between 10 and 20 days, we want one metric per five-minute range, and between 20 and 30 days, we want one metric per one-hour range. (These are some random sampling numbers I’m using, and they don’t follow any good practices or proportions you should consider using yourself.) The only thing to take into consideration is that the intervals should be multiples of each other, so we can’t use either a five-minute interval for the 10-day offset and then a seven-minute interval for the 20-day offset, nor a five-minute interval and then a one-minute interval (scroll down for more on this).
Based on the example above, we should use the following:
|
1 |
downsampling.period=10d:5m,20d:1h |
This translates to adding the following additional flag to the docker run command (note that we are changing the dot for an underscore and prepending VM_ to the variable name):
|
1 |
-e VM_downsampling_period=10d:5m,20d:1h |
Following the PMM online documentation for setting up a docker server:
https://docs.percona.com/percona-monitoring-and-management/setting-up/server/docker.html
The full set of commands needed would be:
|
1 2 3 4 5 6 7 8 |
shell> docker pull percona/pmm-server:2 shell> docker volume create pmm-data shell> docker run --detach --restart always --publish 443:443 -v pmm-data:/srv -e VM_downsampling_period=10d:5m,20d:1h --name pmm-server percona/pmm-server:2 |
And that’s it! This will instruct VictoriaMetrics to apply the downsampling for the aforementioned time ranges.
Increasing metric retention days
With the 30-day default retention period, it may not be too interesting unless you are monitoring hundreds of database nodes (which you can, and there are environments that currently do it). However, let’s say we want to ramp up data retention to have metrics for the past 15 months to compare year-over-year trends. This could be impractical for PMM environment monitoring, even a low amount of nodes, unless we used downsampling. If we correctly choose our downsampling offsets and intervals, this is something that is now doable.
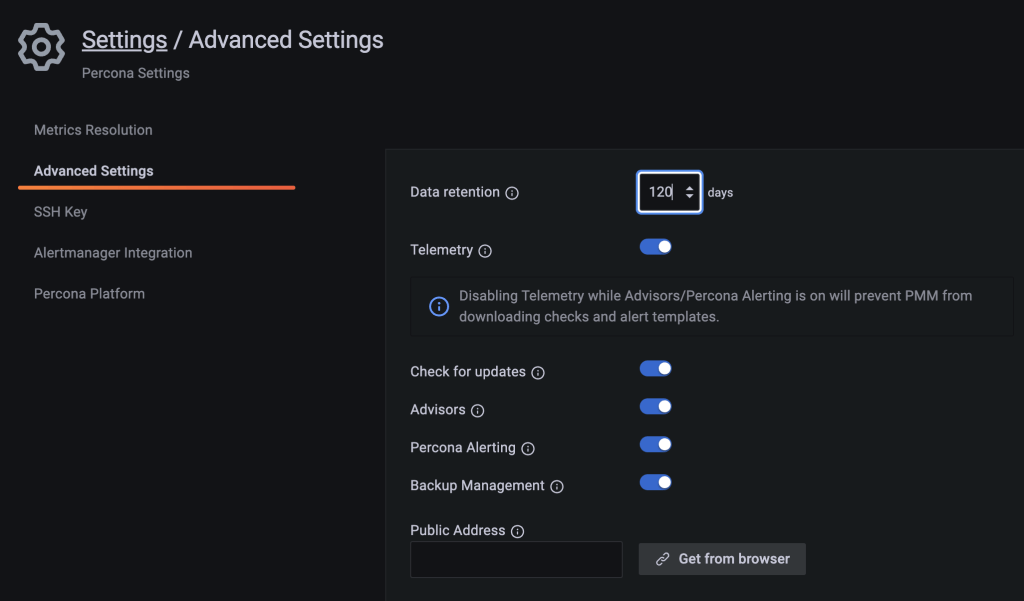
To modify the retention, go to Settings -> Advanced Settings, modify the Data Retention field, and scroll down to click on Apply Changes:
Even better: you can add an environment variable to your docker run command, so 15 months (or 10944 hours) retention would look like this:
|
1 |
-e DATA_RETENTION=10944 |
I tested it with low values, and it is working as intended. However, due to obvious time constraints, I haven’t had the time to test this on a larger scale (like six months or more). However, we do have customers already using it with good results, so try it out and let us know how things go!
One other thing to note is that if you select a period of time that is long enough to include two or more offsets, the one with the lowest interval will be used. For instance, if we use:
|
1 |
downsampling.period=30d:5m,60d:10m,120d:20m |
When we select “Last 3 months,” we will get graphs showing metrics at 10-minute intervals, even if the first 30 days have default five-second metrics and the second 30 days have five-minute aggregations. If needed, we can zoom in or select the appropriate offset time ranges to have metrics at the lowest possible intervals for them, but that requires us to know the exact values used for the downsampling.period configuration variable, which may not always be the case. Things get a bit more complicated due to the fact that Grafana itself will do a scale-down of sorts to the amount of metrics shown as we “zoom out”, so be aware that what you may be looking at is not produced by VictoriaMetrics downsampling, but by Grafana masking that to show a more discrete set of values in a graph.
Error scenarios
We mentioned that there are some restrictions on how we can choose the intervals, so let’s briefly mention what happens when we fail to set them correctly. Note that VictoriaMetrics doesn’t enforce the offsets to actually be in order, so the following would be analogous and valid:
|
1 |
> -e VM_downsampling_period=30d:1m,60d:5m |
and
|
1 |
> -e VM_downsampling_period=60d:5m,30d:1m |
Multiples of previous intervals
The first type of error can happen when we fail to properly set intervals at a value that is multiple of a previous one. For example, using:
|
1 |
> -e VM_downsampling_period=30d:1m,60d:5m,120d:7m |
This will yield the following errors:
|
1 |
fatal /home/builder/rpm/BUILD/VictoriaMetrics-pmm-6401-v1.93.4/app/victoria-metrics/main.go:82 cannot parse -downsampling.period: downsamping intervals must be multiples; prev: 420000, current: 300000 |
The prev and current values are intervals in milliseconds:
|
1 2 |
420000 / 1000 = 420 seconds / 60 = 7 minutes 300000 / 1000 = 300 seconds / 60 = 5 minutes |
In this case, to resolve this issue, we could use 10m (or 15m, 20m, etc.) instead of 7m for the 120d offset. Using “previous” to point out the largest offset is a bit counterintuitive, in my opinion, and it made analyzing the error log a bit tricky at times.
Bigger than next interval
The second type of error happens when we use a smaller interval for a future offset. For example, using:
|
1 |
> -e VM_downsampling_period=10d:3m,40d:45s |
This will yield the following errors:
|
1 |
fatal /home/builder/rpm/BUILD/VictoriaMetrics-pmm-6401-v1.93.4/app/victoria-metrics/main.go:82 cannot parse -downsampling.period: prev downsampling interval 45000 must be bigger than the next interval 180000 |
The prev and next values are, again, the intervals in milliseconds:
|
1 2 |
45000 / 1000 = 45 seconds 180000 / 1000 = 180 seconds / 60 = 3 minutes |
This tells us that the interval we chose for the 40-day offset (45 seconds) should be bigger than the one at the 10-day offset, set at three minutes. Of course, we should remember the aforementioned multiple rule, which gives us 6m, 9m, 12m (etc.) as possible values for this interval.
Conclusion
Using downsampling in PMM is easy as long as we clearly understand the rules behind setting the intervals for each offset. Downsampling will allow us to store data for more days in the same space (at the cost of precision) and help us lower the resources needed when querying data for large periods of time from Grafana. Try it out, and let us know the results you get!
Percona Monitoring and Management is a best-of-breed open source database monitoring solution tool for use with MySQL, PostgreSQL, MongoDB, and the servers on which they run. Monitor, manage, and improve the performance of your databases no matter where they are located or deployed.
Download Percona Monitoring and Management Today
About the Author
 Agustín
Agustín joined Percona's Support team in December 2013, after being part of the Administrative team from February 2012. He has previously worked as a Cambridge IT examinations Supervisor and as a Junior BI, SQL & C# developer. He is studying to get a Computer Systems Engineer degree at the Universidad de la República, in Uruguay.


Is downsampling supported in the open-source version of Victoria Metrics that PMM includes? The documentation says it’s an Enterprise only feature.
The downsampling would not be done in the open-source version, even if it accepts the arguments for it…
Hi Francisco,
This feature is included in PMM, as I mentioned in the blog:
This is so great to hear and see! We’ve currently got data retention on our production PMM of … 500 days. Which is great for a view of how things are changing over time, but we’re generally not interested in the fine detail of a year ago – this looks like a great way to extend the timeframe we can keep while reducing the storage required to have it on hand.
Looking at ways of reducing the footprint while maintaining the ability to see longer term trends was next up on the Things-to-sort-with-PMM, too.
Hi Julian,
Nice! Hopefully, you’ll be able to get even more out of your PMM environment! Let us know how things go.