
Everyone knows that MongoDB has FTDC (Full-Time Diagnostic Data Capture), which helps MongoDB engineers analyze server behavior, tune parameters, and conduct forensic work when issues occur within their clusters.
Here at Percona, we’ve been using the Keyhole tool for a while, and it’s great! It’s very useful for tuning parameters or analyzing what happened at any moment in a MongoDB instance.
With newer versions of MongoDB, we often require additional metrics to analyze specific issues reported by our customers. Based on Keyhole’s idea, I wrote this script to collect extra metrics, plot them in a Grafana dashboard, and ensure we have all the data we need to resolve the issues.
The instructions for using the script are available in the repository, so I won’t duplicate them in this blog post. You can visit it here: https://github.com/zelmario/Big-hole
After you run the script, a link to a Grafana dashboard will be printed on the screen. The dashboard is divided into sections:
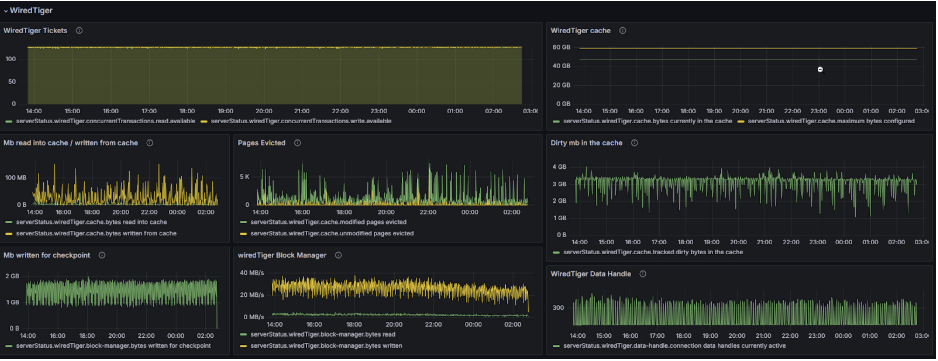
WiredTiger section
This section contains all the metrics from WiredTiger.*, including tickets, cache, pages evicted, block manager, and checkpoints.
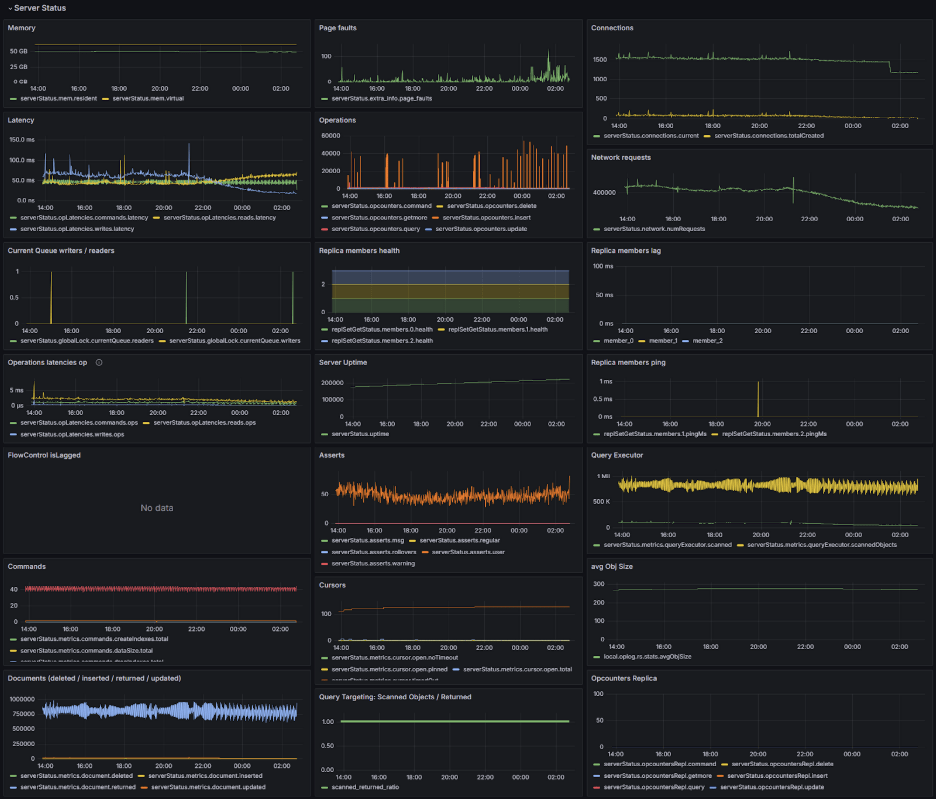
Server status section
In this section, we have metrics from serverstatus.* We can see Memory, Connections, Latency, Replica member lag, Flowcontrol, and more.
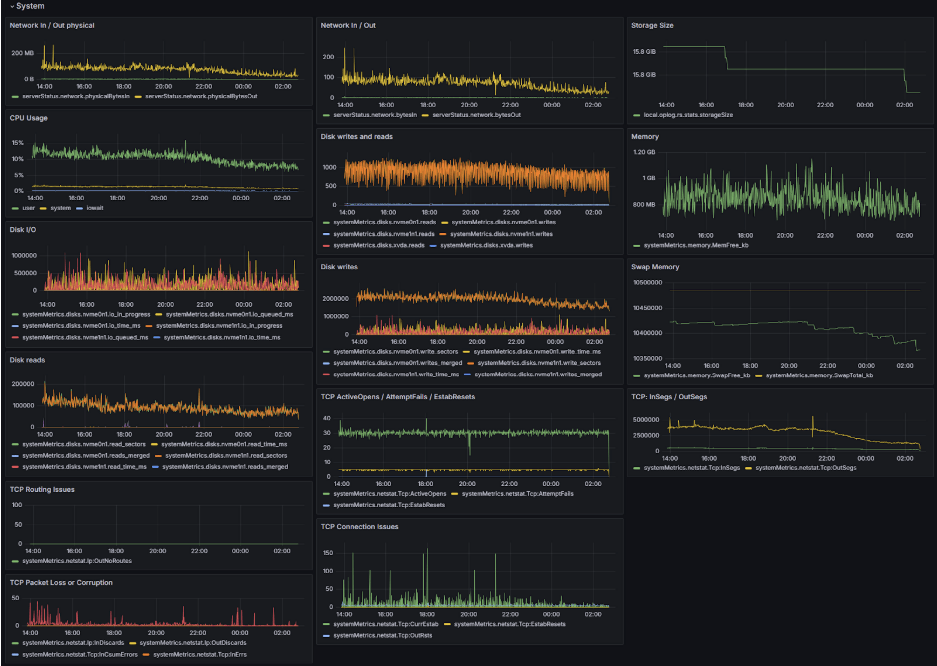
System section
This section contains various systemMetrics.* metrics. It includes all disk, memory, swap, TCP, and network-related metrics.
If those metrics aren’t sufficient for your needs, you can modify a file on your cloned repository to collect additional metrics. Remember to include them in the Grafana dashboard.
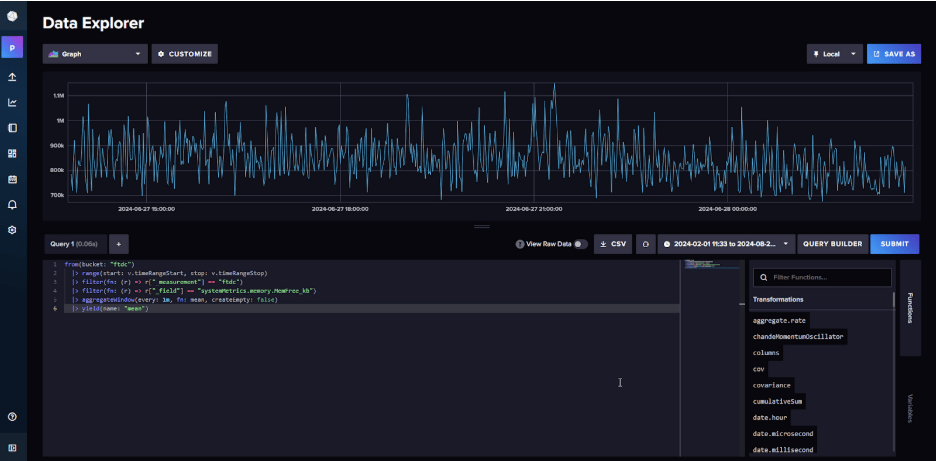
The script sends all metric data to a Dockerized InfluxDB instance. As a bonus, you can visit the Influx dashboard to check the metrics and construct the queries needed to display them in Grafana or send them to another software to analyze them.
Because the script pulls a lot of metrics, it is a bit slow, so I’m trying to improve it to run faster. While I may not be a professional developer, contributions towards enhancing the script are warmly welcome! 🙂

About the Author
 Zelmar Michelini
Zelmar, a MongoDB specialist, joined Percona in 2022 as a Support Engineer. With a sharp focus on performance optimization and a knack for troubleshooting, he's recognized for his expertise in MongoDB intricacies, delivering top-notch support.