
This post was originally published in October 2018 and was updated in March 2023.
pt-query-digest is one of the most commonly used tools for query auditing in MySQL. By default, pt-query-digest reports the top ten queries consuming the most amount of time inside MySQL. A query that takes more time than the set threshold for completion is considered slow, but it’s not always true that tuning such queries makes them faster. Sometimes, when resources on the server are busy, it will impact every other operation on the server, and so will impact queries too. In such cases, you will see the proportion of slow queries going up. That can also include queries that work fine in general.
This article explains a small trick to identify such spots using pt-query-digest and the slow query log. pt-query-digest is a component of Percona Toolkit, open source software that is free to download and use.
The MySQL slow query log is a feature of MySQL that logs information about queries that take longer than a specified threshold to execute. It is a useful tool for identifying performance issues in MySQL databases.
When enabled, the slow query log records information about each slow query, including query text, execution time, and query timestamp. This information can be used to analyze and optimize database performance.
Once enabled, you can analyze the log file using various tools, such as the MySQL command-line tool, Percona Toolkit, or Percona Monitoring and Management (PMM).
slow_query_log = 1

slow_query_log_file = /path/to/your/log/file.log

long_query_time = 5
Here, “slow_query_log” enables the slow query log, “slow_query_log_file” specifies the location and name of the file, and “long_query_time” specifies the number of seconds (example, you can enter your own number) that a query must take to be considered “slow” and logged.
After enabling the slow query log, MySQL will log all queries that take longer than the “long_query_time” value you entered.
To verify that the slow query log is working correctly, run a slow query to test if the slow query log is working. If the query takes longer than the specified time (in this example, five seconds), check the slow query log file to verify that it contains the slow query.
To enable the MySQL slow query log, you need to modify the MySQL server configuration file (usually my.cnf or my.ini) and set the following parameters:
slow_query_log: This specifies whether the slow query log is enabled or disabled. The default value is OFF. To enable the slow query log, set it to ON.slow_query_log_file: This parameter specifies the name and location of the file where slow queries will be logged. The default value is hostname-slow.log and it is stored in the data directory of the MySQL server.long_query_time: This specifies the amount of time a query must take to be considered “slow” and logged in the slow query log. The default value is 10 seconds. You can adjust this value.log_queries_not_using_indexes: This parameter specifies whether to log queries that are not using indexes. If you want to log queries that are not using indexes, set it to ON as the default value is OFF.log_slow_admin_statements: This parameter specifies whether to log administrative statements that take a long time to execute. The default value is OFF. If you want to log slow administrative statements, set it to ON.The slow query log provides information that helps identify queries that are taking too long and can be optimized. The types of slow query log statements include the following:
By analyzing the MySQL slow query log, you can identify queries that are taking too long to execute and causing performance issues. In order to read the slow query log, follow these steps:
Let’s have a look at sample data in Percona Server for MySQL 5.7. The slow query log is configured to capture queries longer than ten seconds with no limit on the logging rate, which is generally considered for throttling the IO that comes while writing slow queries to the log file.
|
1 2 3 4 5 6 7 8 9 10 11 12 13 14 15 16 |
mysql> show variables like 'log_slow_rate%' ; +---------------------+---------+ | Variable_name | Value | +---------------------+---------+ | log_slow_rate_limit | 1 | --> Log all queries | log_slow_rate_type | session | +---------------------+---------+ 2 rows in set (0.00 sec) mysql> show variables like 'long_query_time' ; +-----------------+-----------+ | Variable_name | Value | +-----------------+-----------+ | long_query_time | 10.000000 | --> 10 seconds +-----------------+-----------+ 1 row in set (0.01 sec) |
When I run pt-query-digest, I see in the summary report that 80% of the queries have come from just three query patterns.
|
1 2 3 4 5 6 7 8 9 10 11 12 13 |
# Profile # Rank Query ID Response time Calls R/Call V/M # ==== ============================= ================ ===== ======== ===== # 1 0x7B92A64478A4499516F46891... 13446.3083 56.1% 102 131.8266 3.83 SELECT performance_schema.events_statements_history # 2 0x752E6264A9E73B741D3DC04F... 4185.0857 17.5% 30 139.5029 0.00 SELECT table1 # 3 0xAFB5110D2C576F3700EE3F7B... 1688.7549 7.0% 13 129.9042 8.20 SELECT table2 # 4 0x6CE1C4E763245AF56911E983... 1401.7309 5.8% 12 116.8109 13.45 SELECT table4 # 5 0x85325FDF75CD6F1C91DFBB85... 989.5446 4.1% 15 65.9696 55.42 SELECT tbl1 tbl2 tbl3 tbl4 # 6 0xB30E9CB844F2F14648B182D0... 420.2127 1.8% 4 105.0532 12.91 SELECT tbl5 # 7 0x7F7C6EE1D23493B5D6234382... 382.1407 1.6% 12 31.8451 70.36 INSERT UPDATE tbl6 # 8 0xBC1EE70ABAE1D17CD8F177D7... 320.5010 1.3% 6 53.4168 67.01 REPLACE tbl7 # 10 0xA2A385D3A76D492144DD219B... 183.9891 0.8% 18 10.2216 0.00 UPDATE tbl8 # MISC 0xMISC 948.6902 4.0% 14 67.7636 0.0 <10 ITEMS> |
Let’s take a closer look at the queries recorded in the slow query log.
|
1 2 3 4 5 6 7 8 9 10 11 12 13 14 15 16 17 |
# grep -B3 DIGEST mysql-slow_Oct2nd_4th.log .... .... # User@Host: ztrend[ztrend] @ localhost [] Id: 6431601021 # Query_time: 139.279651 Lock_time: 64.502959 Rows_sent: 0 Rows_examined: 0 SET timestamp=1538524947; SELECT DIGEST, CURRENT_SCHEMA, SQL_TEXT FROM performance_schema.events_statements_history; # User@Host: ztrend[ztrend] @ localhost [] Id: 6431601029 # Query_time: 139.282594 Lock_time: 83.140413 Rows_sent: 0 Rows_examined: 0 SET timestamp=1538524947; SELECT DIGEST, CURRENT_SCHEMA, SQL_TEXT FROM performance_schema.events_statements_history; # User@Host: ztrend[ztrend] @ localhost [] Id: 6431601031 # Query_time: 139.314228 Lock_time: 96.679563 Rows_sent: 0 Rows_examined: 0 SET timestamp=1538524947; SELECT DIGEST, CURRENT_SCHEMA, SQL_TEXT FROM performance_schema.events_statements_history; .... .... |
Now you can see two things.
Now I want to check if I can group the count of queries based on their time of execution. If there are multiple queries at a given time captured into the slow query log, time will be printed for the first query but not all. Fortunately, in this case, I can rely on the Unix timestamp to compute the counts. The timestamp gets captured for every query. Luckily, without a long struggle, a combination of grep and awk utilities displayed what I wanted to display.
|
1 2 3 4 5 6 7 8 9 10 11 12 13 |
# grep -A1 Query_time mysql-slow_Oct2nd_4th.log | grep SET | awk -F "=" '{ print $2 }' | uniq -c 2 1538450797; 1 1538524822; 3 1538524846; 7 1538524857; 167 1538524947; ---> 72% of queries have happened at this timestamp. 1 1538551813; 3 1538551815; 6 1538602215; 1 1538617599; 33 1538631015; 1 1538631016; 1 1538631017; |
You can use the command below to check the regular date time format of a given timestamp. So, Oct 3, 05:32 is when there was something wrong on the server:
|
1 2 |
# date -d @1538524947 Wed Oct 3 05:32:27 IST 2018 |
Query tuning can be carried out alongside this, but identifying such spots helps avoid spending time on query tuning where badly written queries are not the problem. Having said that, from this point, further troubleshooting may take different sub-paths such as checking log files at that particular time, looking at CPU reports, reviewing past pt-stalk reports if set up to run in the background, and dmesg, etc. This approach is useful for identifying at what time (or time range) MySQL was more stressed just using a slow query log when no robust monitoring tools, like Percona Monitoring and Management (PMM), are deployed.
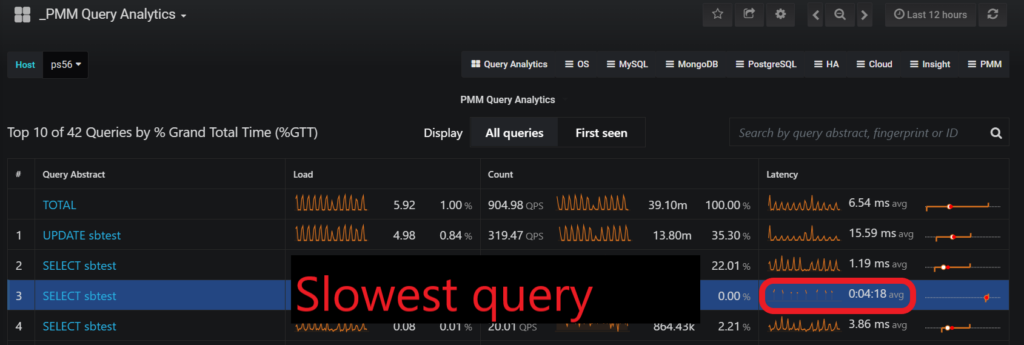
If you have PMM, you can review Query Analytics to see the topmost slow queries, along with details like execution counts, load, etc. Below is a sample screen copy for your reference:
NOTE: If you use Percona Server for MySQL, a slow query log can report time in microseconds. It also supports extended logging of other statistics about query execution. These provide extra power to see the insights of query processing. You can see more information about these options here.
For more tips and tools on MySQL slow query log, visit our other blogs here and here.
In versions before MySQL 5.7.5, generally, the default location of the slow query log is the MySQL data directory, and the file name is “hostname-slow.log.”
For versions later than MySQL 5.7.5, the default location of the slow query log is also the MySQL data directory, and the file name is “slow.log.”
The data directory location can vary depending on the operating system, but it is typically “/var/lib/mysql” on Linux systems.
To exclude certain queries from the slow query log, you can use the MySQL configuration option slow_query_log and specify a value of 0 to completely disable the slow query log. To meet specific criteria, you can also enable the log only for those queries, using the slow_query_log and long_query_time options.
To prevent slow queries that do not use indexes from being logged, you can use the log_queries_not_using_indexes option. Additionally, the min_examined_row_limit option excludes queries that examine fewer rows than a specified threshold.
Enabling the MySQL slow query log can have a small impact on database performance, as it involves additional I/O operations to write the slow query log to disk. However, the benefits often outweigh any costs.
MySQL logs those queries that take longer than 10 seconds to execute by default. This limit can be adjusted using the long_query_time variable. However, if you set it too low, it can cause an excessive number of queries to be logged, which can increase disk I/O and affect overall performance.
Yes, you can. A few examples include the following:
Others are available, and their use will depend on your specific needs.
Percona Distribution for MySQL is the most complete, stable, scalable, and secure open source MySQL solution available, delivering enterprise-grade database environments for your most critical business applications… and it’s free to use!
Resources
RELATED POSTS