Overview
Servers Tested:
- MySQL 9.7.0 (PGO-enabled build released by Oracle)
- MySQL 9.7.0 Non-PGO (built without Profile-Guided Optimization — see BUILD.md)
Tier Configurations:
- Tier 2G: 2GB InnoDB buffer pool
- Tier 12G: 12GB InnoDB buffer pool
- Tier 32G: 32GB InnoDB buffer pool
View Results
📊 Interactive Reports
The benchmark reports are available as interactive HTML pages at:
https://percona-lab-results.github.io/2026-pgo/index.html
Performance Graphs
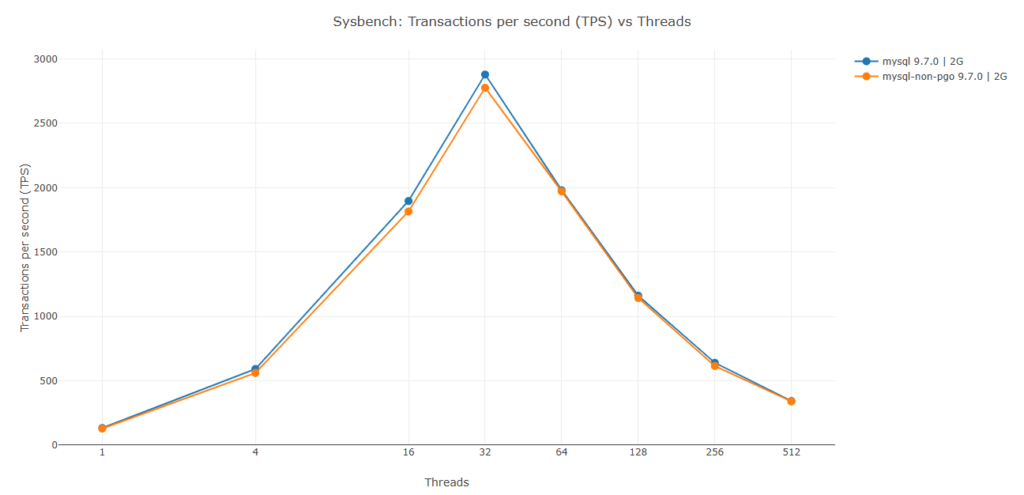
Tier 2G (2GB Buffer Pool):
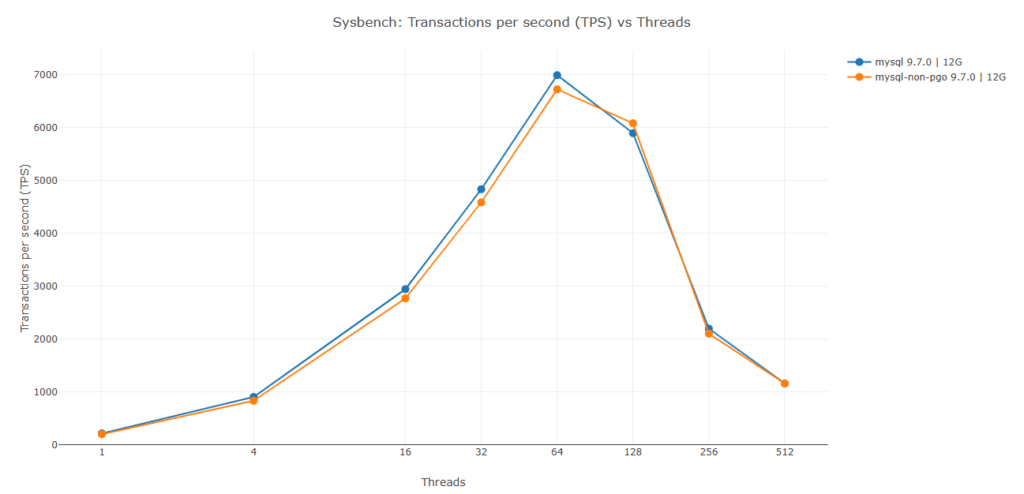
Tier 12G (12GB Buffer Pool):
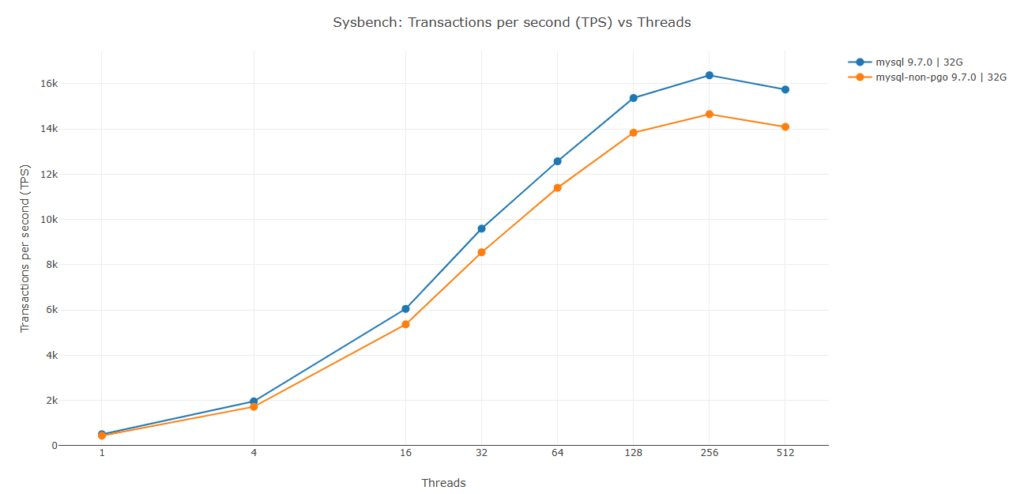
Tier 32G (32GB Buffer Pool):
Key Findings
Performance Impact of PGO
MySQL 9.7.0 with Profile-Guided Optimization (PGO) demonstrates measurable performance improvements over the non-PGO build:
Overall Performance Summary:
- Average improvement: 6.5% across all configurations
- Peak improvement: 14.3% (Tier 32G, 1 thread), gradually tapering to 10.3% at 512 threads as concurrency increases
- Performance gains range from 0.5% to 14.3% in most scenarios
- Minor regression (-3.1% at Tier 12G, 128 threads)
Performance by Buffer Pool Size:
- Tier 2G (2GB buffer pool): Average improvement of 3.0%
– Best gains at 4 threads (5.5% improvement)
– Gains range from 0.5% to 5.5% across all thread counts
– Modest improvements with no regressions
- Tier 12G (12GB buffer pool): Average improvement of 4.1%
– Best gains at 4 threads (8.6% improvement)
– Strong gains at low concurrency (1-4 threads: 7.3%-8.6%)
– Minor regression at 128 threads (-3.1%), neutral at 512 threads (-0.0%)
- Tier 32G (32GB buffer pool): Average improvement of 12.2%
– Consistently strong gains across all thread counts (10.3% to 14.3%)
– Peak performance at lowest concurrency (1 thread: 14.3%)
– Maintains 11-12% improvement even at highest concurrency (128-512 threads)
Key Observations:
- PGO provides the most significant benefits with larger buffer pools (32GB tier shows 12.2% average improvement)
- Largest buffer pool configuration benefits from PGO across all concurrency levels with no regressions
- Low to moderate concurrency (1-32 threads) shows best PGO gains across all tiers
- Smaller buffer pools (2GB, 12GB) show more modest improvements and occasional regressions at very high thread counts
- The performance improvements demonstrate PGO’s effectiveness in optimizing hot code paths, particularly when memory resources are abundant
InnoDB Metrics Analysis
Deep analysis of InnoDB metrics reveals the source of PGO’s performance improvements:
Root Cause: CPU-Level Optimizations
- PGO improvements are NOT from I/O optimization, caching, or lock reduction
- Buffer pool hit ratios remain virtually identical between PGO and non-PGO builds
- Lock contention is minimal in both builds
- All I/O metrics scale proportionally with increased throughput
What PGO Actually Optimizes:
- ✓ Better instruction cache utilization
- ✓ Improved branch prediction in hot code paths
- ✓ Optimized function inlining
- ✓ More efficient CPU instruction ordering
The metrics confirm that PGO’s 6.5% average improvement comes entirely from making the CPU more efficient at executing MySQL’s hot code paths, allowing it to process more transactions per second with the same hardware resources.
What is PGO?
Profile-Guided Optimization (PGO) is a compiler optimization technique that uses runtime profiling data to guide code optimization. The compiler first instruments the code, collects execution profiles during typical workload runs, and then recompiles the code with optimizations targeted at the most frequently executed code paths.
Benefits of PGO:
- Improved branch prediction
- Better instruction cache utilization
- Optimized function inlining
- Reduced code bloat
- Better register allocation
Benchmark Methodology
Workload
- Tool: Sysbench OLTP Read/Write benchmark
- Tables: 20 tables
- Table Size: 5,000,000 rows per table
- Thread Counts: 1, 4, 16, 32, 64, 128, 256, 512
Configuration
– Read-only: 180 seconds
– Read-write: 600 seconds
- Measurement Duration: 900 seconds (15 minutes) per thread count
- Runs: Single run per configuration
System Metrics Collected
- InnoDB storage engine metrics
- MySQL status variables
- MySQL system variables
- System I/O statistics (iostat)
- Virtual memory statistics (vmstat)
- CPU statistics (mpstat)
- System statistics (dstat)
Appendix
For Repository structure, Build steps and Technical details go to https://github.com/Percona-Lab-results/2026-pgo/blob/main/README.md#report-categories