
 Database-as-a-Service (DBaaS) is a managed database that doesn’t need to be installed and maintained but is instead provided as a service to the user. The Percona Monitoring and Management (PMM) DBaaS component allows users to CRUD (Create, Read, Update, Delete) Percona XtraDB Cluster (PXC) and Percona Server for MongoDB (PSMDB) managed databases in Kubernetes clusters.
PXC and PSMDB implement DBaaS on top of Kubernetes (k8s), and PMM DBaaS provides a nice interface and API to manage them.
The easiest way to play with and test PMM DBaaS is to use minikube. Please follow the minikube installation guideline. It is possible that your OS distribution provides native packages for it, so check that with your package manager as well.
In the examples below, Linux is used with kvm2 driver, so additionally kvm and libvirt should be installed. Other OS and drivers could be used as well. Install the kubectl tool as well, it would be more convenient to use it and minikube will configure kubeconfig so k8s cluster could be accessed from the host easily.
Let’s create a k8s cluster and adjust resources as needed. The minimum requirements can be found in the documentation.
|
1 |
$ minikube start --cpus 12 --memory 32G --driver=kvm2 |
|
1 2 |
$ curl -sSf -m 30 https://raw.githubusercontent.com/percona-platform/dbaas-controller/main/deploy/pmm-server-minikube.yaml | kubectl apply -f - |
|
1 2 3 4 5 6 7 8 9 10 11 12 13 14 15 16 17 18 19 20 21 |
$ kubectl get deployment NAME READY UP-TO-DATE AVAILABLE AGE pmm-deployment 1/1 1 1 3m40s $ kubectl get pods NAME READY STATUS RESTARTS AGE pmm-deployment-d688fb846-mtc62 1/1 Running 0 3m42s $ kubectl get pv NAME CAPACITY ACCESS MODES RECLAIM POLICY STATUS CLAIM STORAGECLASS REASON AGE pmm-data 10Gi RWO Retain Available 3m44s pvc-cb3a0a18-b6dd-4b2e-92a5-dfc0bc79d880 10Gi RWO Delete Bound default/pmm-data standard 3m44s $ kubectl get pvc NAME STATUS VOLUME CAPACITY ACCESS MODES STORAGECLASS AGE pmm-data Bound pvc-cb3a0a18-b6dd-4b2e-92a5-dfc0bc79d880 10Gi RWO standard 3m45s $ kubectl get service NAME TYPE CLUSTER-IP EXTERNAL-IP PORT(S) AGE kubernetes ClusterIP 10.96.0.1 <none> 443/TCP 6m10s pmm NodePort 10.102.228.150 <none> 80:30080/TCP,443:30443/TCP 3m5 |
|
1 |
$ minikube service pmm |
NOTE:
To not go into too much detail: PV (kubectl get pv) and PVC(kubectl get pvc) are essentially the storage for PMM data (/srv directory). Service is a network for PMM and how to access it.
Attention: this PMM Server deployment is not supposed to be used in production, but just as a sandbox for testing and playing around, as it always starts with the latest version of PMM and k8s is not yet a supported environment for it.
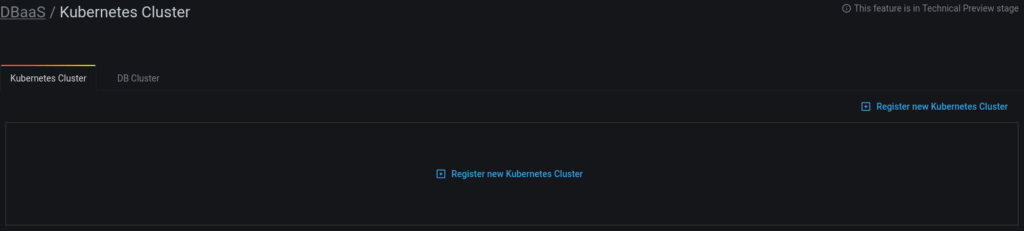
Now PMM DBaaS Dashboard can be used and a k8s cluster could be added, DB added, as well as configured.
NOTE:
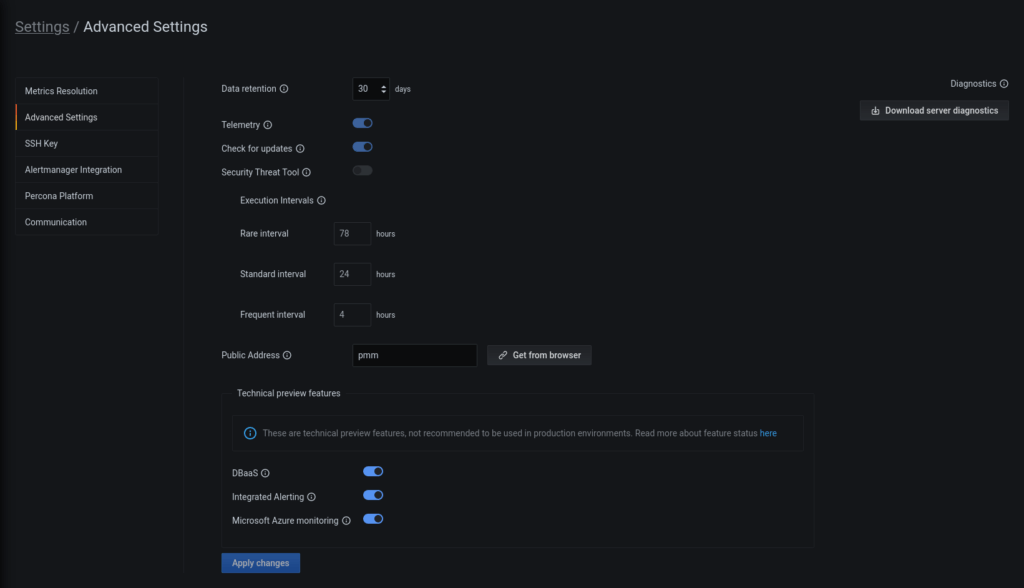
To enable the PMM DBaaS feature you need to either pass a special environment (ENABLE_DBAAS=1) to the container or enable it in the settings (next screenshot).
To allow PMM managing k8s cluster – it needs to be configured. Check the documentation, but here are short steps:
pmm on Configuration -> Settings -> Advanced Settings page
|
1 |
kubectl config view --flatten --minify |
Let’s get into details on what that all means.
The Public Address is propagated to pmm-client containers that are run as part of PXC and PSMDB deployments to monitor DB services pmm-client containers run pmm-agent, which would need to connect to the PMM server. It uses Public Address. DNS name pmm is set by Service in pmm-server-minikube.yaml file for our PMM server deployment.
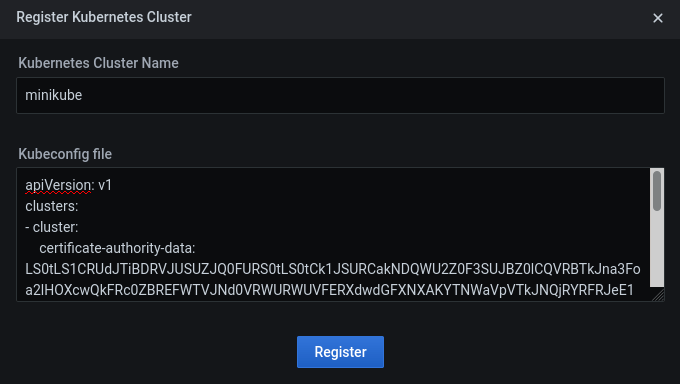
So far, PMM DBaaS uses kubeconfig to get access to k8s API to be able to manage PXC and PSMDB operators. The kubeconfig file and k8s cluster information is stored securely in PMM Server internal DB.
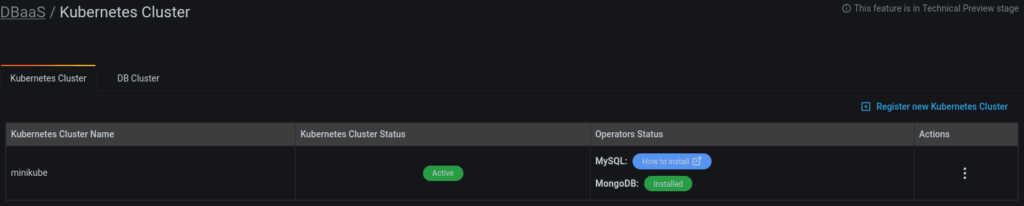
PMM DBaaS couldn’t deploy operators into the k8s cluster for now, but that feature will be implemented very soon. And that is why Operator status on the Kubernetes Cluster dashboard shows hints on how to install them.
What are the operators and why are they needed? This is defined very well in the documentation. Long story short, they are the heart of DBaaS that deploy and configure DBs inside of k8s cluster.
Operators themselves are complex pieces of software that need to be correctly started and configured to deploy DBs. That is where PMM DBaaS comes in handy, to configure a lot for the end-user and provide a UI to choose what DB needs to be created, configured, or deleted.
Let’s deploy the PSMDB operator and DBs step by step and check them in detail.
|
1 2 |
curl -sSf -m 30 https://raw.githubusercontent.com/percona/percona-server-mongodb-operator/v1.7.0/deploy/bundle.yaml | kubectl apply -f - |
|
1 2 3 4 5 6 7 8 9 10 |
$ kubectl get deployment NAME READY UP-TO-DATE AVAILABLE AGE percona-server-mongodb-operator 1/1 1 1 46h pmm-deployment 1/1 1 1 24h $ kubectl get pods NAME READY STATUS RESTARTS AGE percona-server-mongodb-operator-586b769b44-hr7mg 1/1 Running 2 46h pmm-deployment-7fcb579576-hwf76 1/1 Running 1 24h |
Now it is seen on the PMM DBaaS Kubernetes Cluster Dashboard that the MongoDB operator is installed.
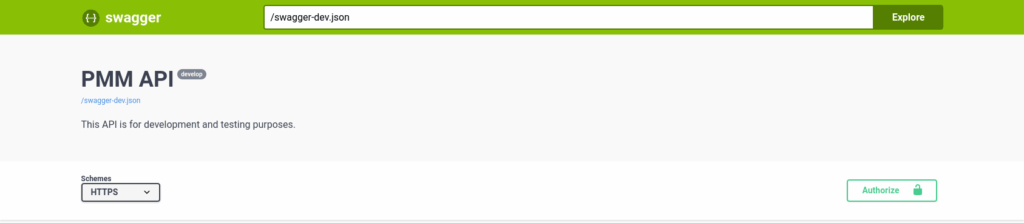
All REST APIs could be discovered via Swagger; it is exposed on both ports (30080 and 30443 in case of minikube) and could be accessed by appending /swagger to the PMM server address. It is recommended to use https (30443 port), and for example, the URL could look like this: https://192.168.39.202:30443/swagger.
As DBaaS is a feature under active development, replace /swagger.json to /swagger-dev.json and push the Explore button.
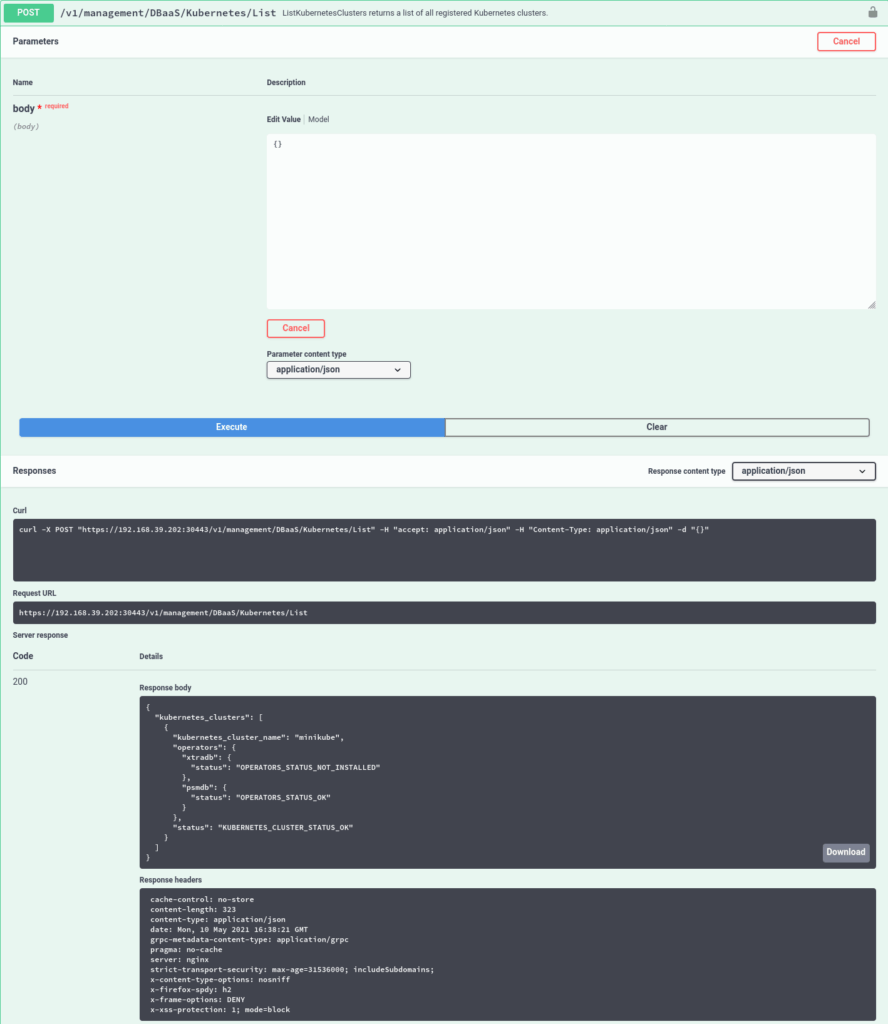
Now all APIs can be seen and even executed.
Let’s try it out. First Authorize and then find /v1/management/DBaaS/Kubernetes/List and push Try it out and Execute. There will be an example of curl as well as response to the REST API POST request. The curl example could be used from the command line as well:
|
1 2 3 4 5 6 7 8 9 10 11 12 13 14 15 16 17 |
$ curl -kX POST "https://192.168.39.202:30443/v1/management/DBaaS/Kubernetes/List" -H "accept: application/json" -H "authorization: Basic YWRtaW46YWRtaW4=" -H "Content-Type: application/json" -d "{}" { "kubernetes_clusters": [ { "kubernetes_cluster_name": "minikube", "operators": { "xtradb": { "status": "OPERATORS_STATUS_NOT_INSTALLED" }, "psmdb": { "status": "OPERATORS_STATUS_OK" } }, "status": "KUBERNETES_CLUSTER_STATUS_OK" } ] } |
PMM Server consists of different components, and for the DBaaS feature, here are the main ones:
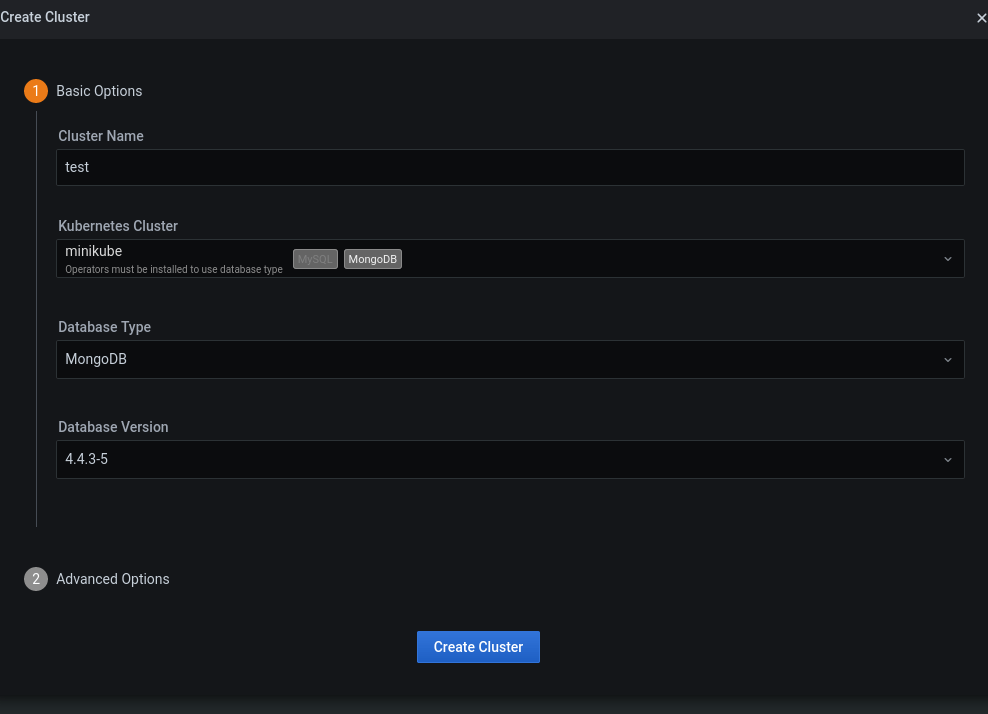
The Grafana UI is what users see, and now when operators are installed, the user could create the MongoDB instance. Let’s do this.
DBaaS -> DB Cluster page and push Create DB Cluster link
Create Cluster button
It has more advanced options to configure resources allocated for the cluster:
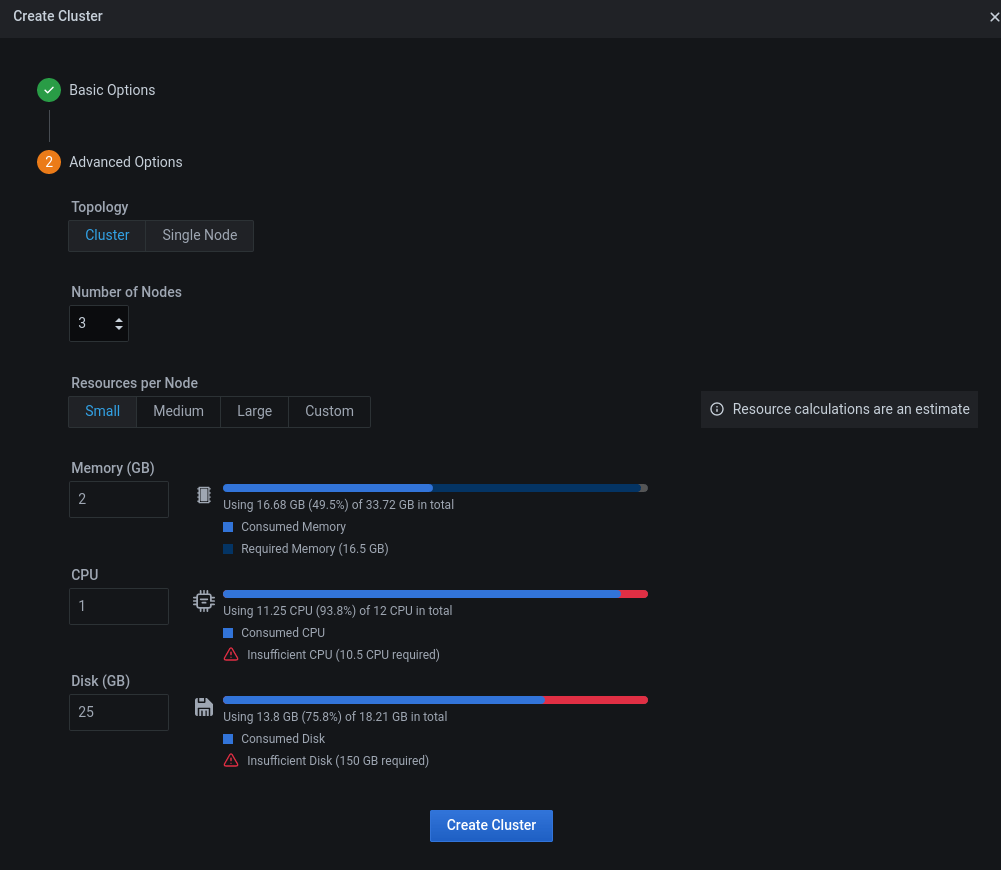
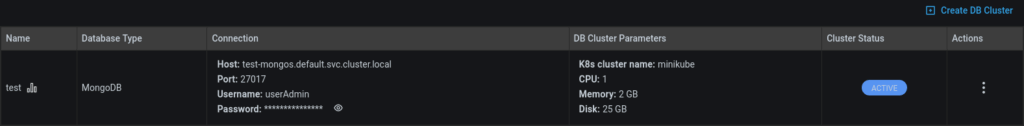
As seen, the cluster was created and could be manipulated. Now let’s see in detail what has happened underneath.
When the user pushes the Create Cluster button, Grafana UI POSTS /v1/management/DBaaS/PSMDBCluster/Create request to pmm-managed. pmm-managed handles the request and sends it via gRPC to the dbaas-controller together with kubeconfig.
dbaas-controller handles requests, and with knowledge of operator structure (Custom Resources/CRD), it prepares CR with all needed parameters to create a MongoDB cluster. After filling all needed structures, dbaas-controller converts CR to yaml file and applies it with kubectl apply -f command. kubectl gets pre-configured with kubeconf file (that was passed by pmm-managed from its DB) to talk to the correct cluster, and the kubeconf file is temporarily created and deleted immediately after the request.
The same happens when some parameters change or dbaas-controller gets some parameters from the k8s cluster.
Essentially, the dbaas-controller automates all stages to fill CRs with correct parameters, check that everything works correctly, and returns details about clusters created. The kubectl interface is used for simplicity but it is subject to change before GA, most probably to k8s Go API.
All together, PMM Server DBaaS provides a seamless experience for the user to deploy DB clusters on top of Kubernetes with simple and nice UI without the need to know operators’ internals. Deploying PXC and PSMDB clusters it also configures PMM Agents and exporters, thus all monitoring data is present in PMM Server right away.
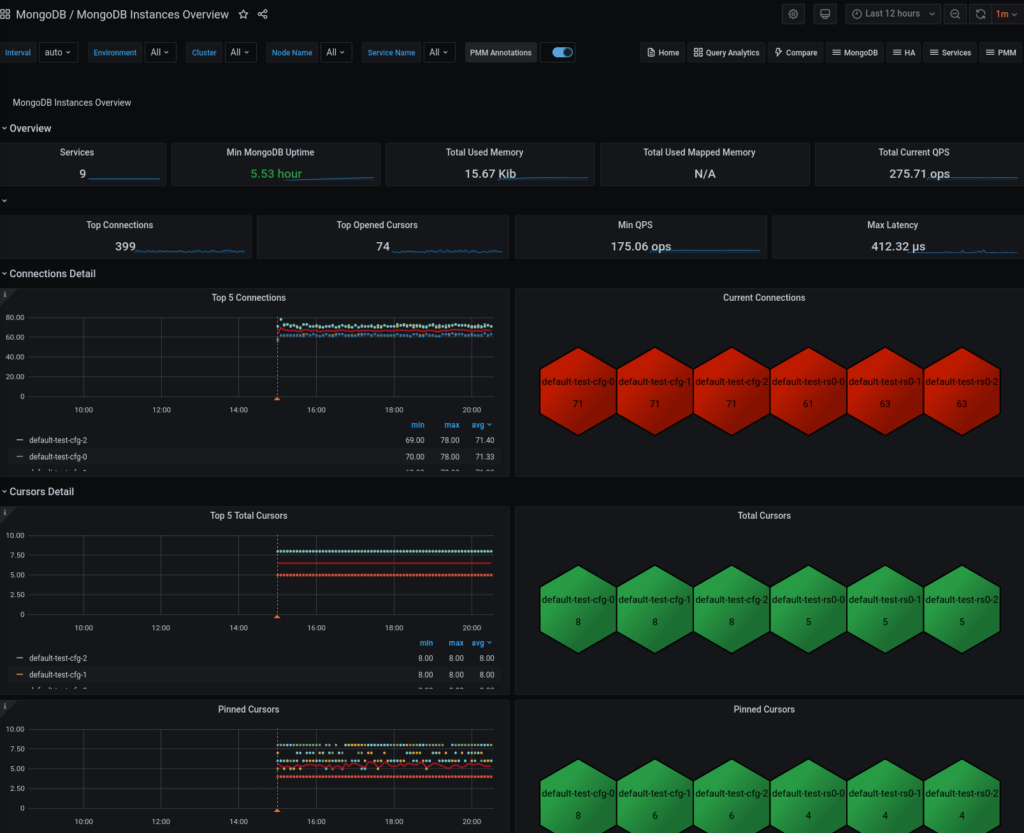
Go to PMM Dashboard -> MongoDB -> MongoDB Overview and see MongoDB monitoring data, explorer nodes, and service monitoring too, which comes pre-configured with the help of the DBaaS feature.
Give it a try, submit feedback, and chat with us, we would be happy to hear from you!
Don’t forget to stop and/or delete your minikube cluster if it is not used:
start again)
|
1 |
$ minikube stop |
|
1 |
$ minikube delete |
Resources
RELATED POSTS


Hi I have configured the PMM 1.7V and i can all the required data to monitor the Mongo database, however below 3 are missing, now sure how to get the or is it that function of all 3 are not on-boarded in PMM.
1- Database size
2- Index Size
3- Slow Query count and collection name with query type.
can someone help with above points
Hi Sachin Rana,
1.7 doesn’t look like a new version, with this question it is better to go to: https://forums.percona.com/ and ask there.
Thanks,
Denys