As a Solutions Engineer at Percona, one of my responsibilities is to support our customer-facing roles such as the sales and customer success teams. This affords me the opportunity to speak to many current and new customers who partner with Percona. I often find that many people are interested in Percona Monitoring and Management (PMM) as a free and open-source monitoring solution due to its robust monitoring capabilities when compared to many SaaS-based monitoring solutions. They are interested in installing PMM for PostgreSQL for the first time and want a “quick start guide” with a brief overview to get their feet wet. I have included the commands to get started for both PMM 1 and PMM 2 (PMM2 is still in beta).
For a brief overview of the PMM Architecture and how to install PMM Server, please see my previous post PMM for MongoDB: Quick Start Guide.
When deploying PMM in this example, I am making the following assumptions about the environment:
|
1 2 |
ALTER SYSTEM SET track_io_timing=ON; SELECT pg_reload_conf(); |
|
1 |
CREATE USER postgres WITH SUPERUSER ENCRYPTED PASSWORD 'postgres'; |
If you are using RDS:
|
1 |
CREATE USER postgres WITH rds_superuser ENCRYPTED PASSWORD 'postgres'; |
We must first enable the Percona package repository on our PostgreSQL instance and install the PMM Client. Please refer to PMM for MongoDB: Quick Start Guide to accomplish the first three steps below (but come back here before doing MongoDB-specific things)
Now we provide the PMM Client credentials necessary for monitoring the PostgreSQL database. Execute the following command to start monitoring and communicating with the PMM server:
|
1 |
sudo pmm-admin add postgresql --user=postgres --password=postgres |
To start monitoring and communicating with the PMM 2 Server:
|
1 |
pmm-admin add postgresql --username=postgres --password=postgres |
You should get a similar output as below if it was successful:
![]()
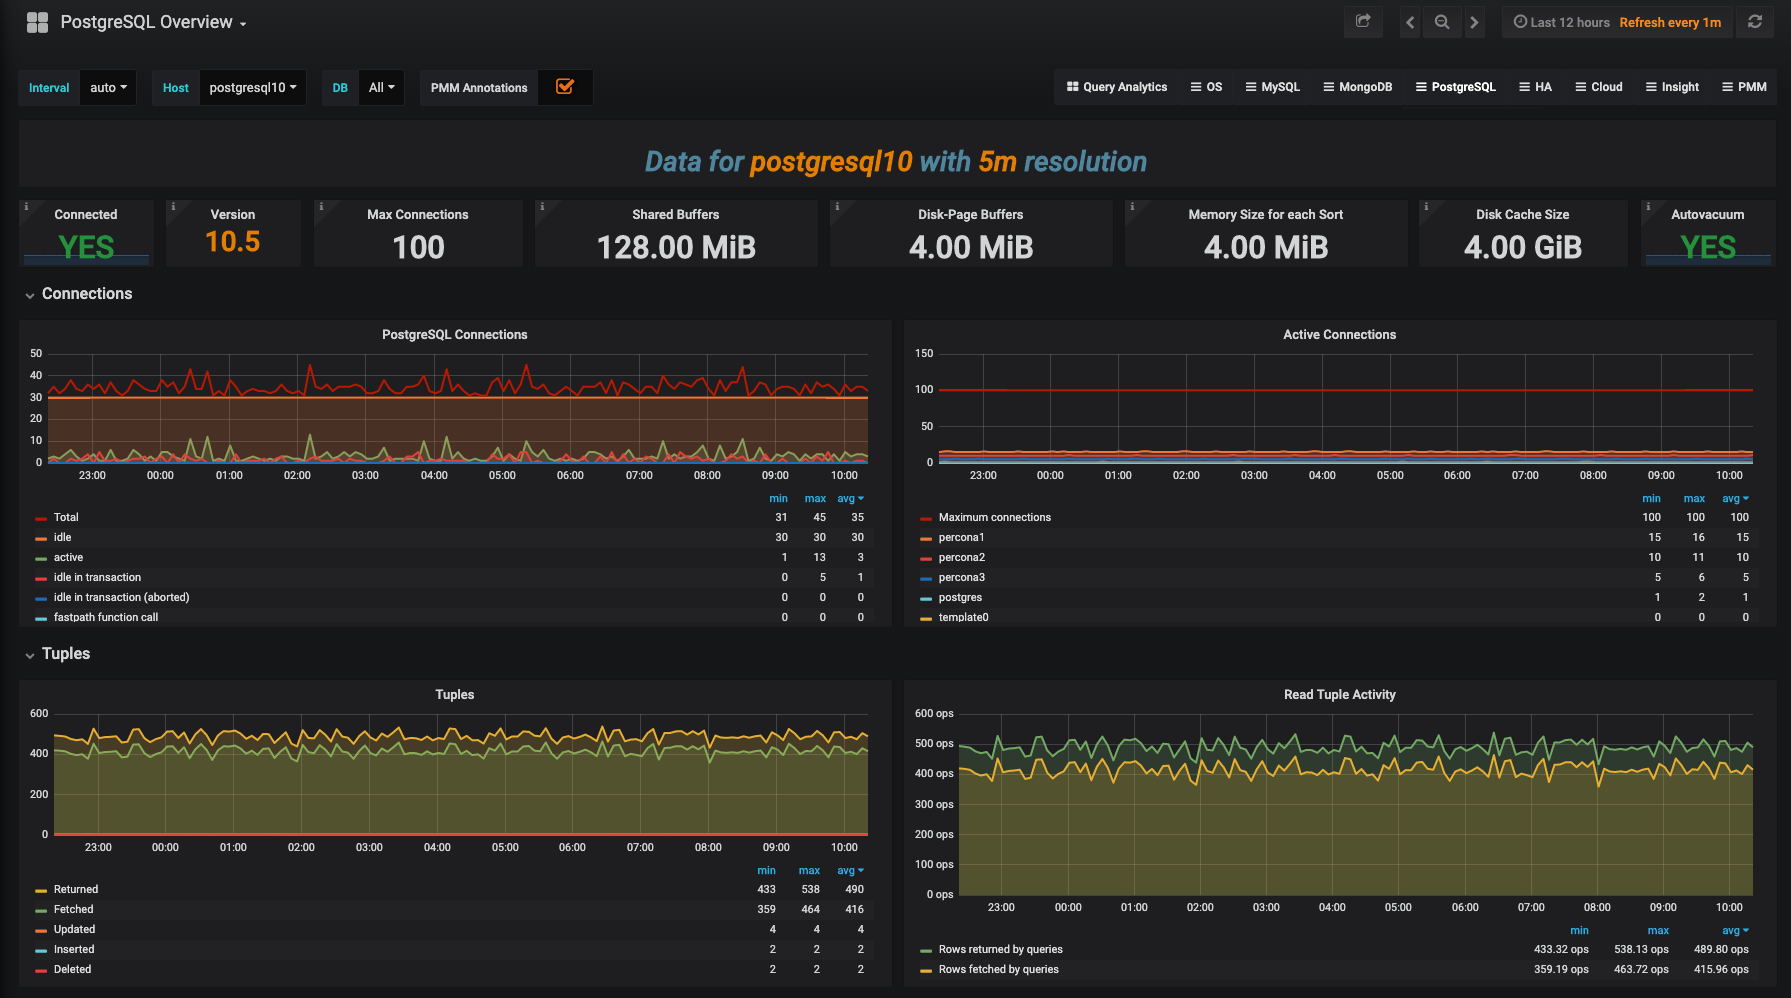
Great! We have successfully installed PMM for PostgreSQL and are ready to take a look at the dashboard.
Of Note: We’re launching PMM 2 Beta with just the PostgreSQL Overview dashboard, but we have others under development, so watch for new Dashboards to appear in subsequent releases!
Navigate to the IP address of your monitoring host. http://<pmm_server_ip>.
The PostgreSQL Overview Dashboard contains the following graphs:
For more information about PMM 2 please read: Percona Monitoring and Management (PMM) 2 Beta Is Now Available
Resources
RELATED POSTS