

We are pleased to announce the release of PMM 2 Beta! PMM (Percona Monitoring and Management) is a free and open-source platform for managing and monitoring MySQL, MongoDB, and PostgreSQL performance.
pmm-agent – Provides secure remote management of the exporter processes and data collectors on the clientPMM 2 Beta is still a work in progress – you may encounter some bugs and missing features. We are aware of a number of issues, but please report any and all that you find to Percona’s JIRA.
This release is not recommended for Production environments.
PMM 2 is designed to be used as a new installation – please don’t try to upgrade your existing PMM 1 environment.
Query Analytics Dashboard now defaults to display all queries on each of the systems that are configured for MySQL PERFORMANCE_SCHEMA, Slow Log, and MongoDB Profiler, and includes comprehensive filtering capabilities.
You’ll recognize some of the common elements in PMM 2 Query Analytics such as the Load, Count, and Latency columns. However, there are new elements such as the filter box and more arrows on the columns:
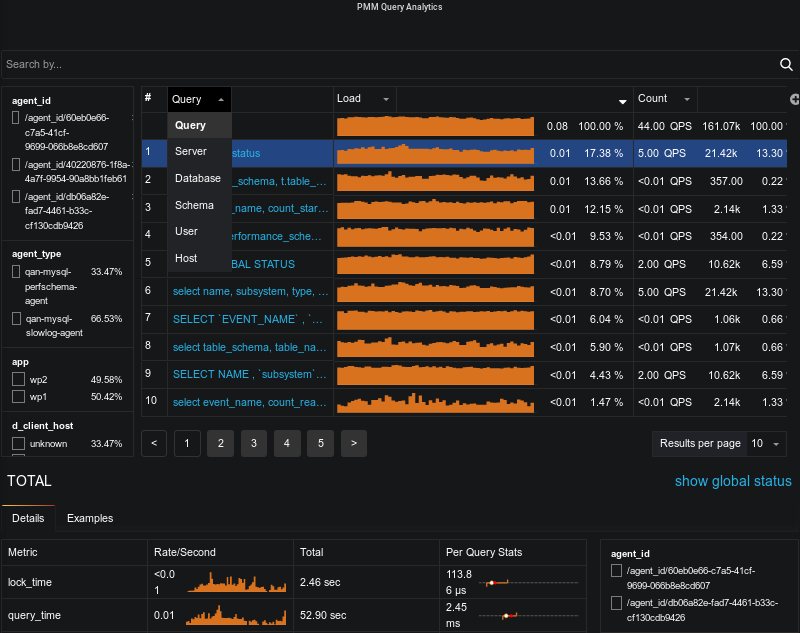
Query Analytics continues to deliver detailed information regarding individual query performance
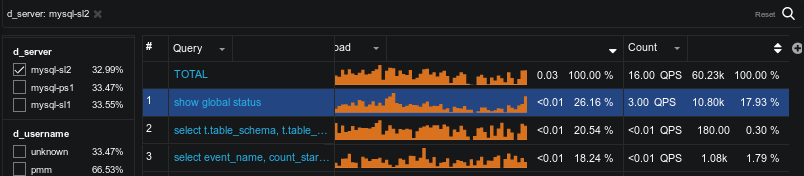
There is a filtering panel on the left, or use the search by bar to set filters using key:value syntax. For example, I’m interested in just the queries related to mysql-sl2 server, I could then type d_server:mysql-sl2:
This is a much-requested feature from PMM Query Analytics and we’re glad to announce that you can now sort by any column! Just click the small arrow to the right of the column name and:
As you may have already noticed, we have changed the sparkline representation. New sparklines are not points-based lines, but are interval-based, and look like a staircase line with flat values for each of the displayed period:
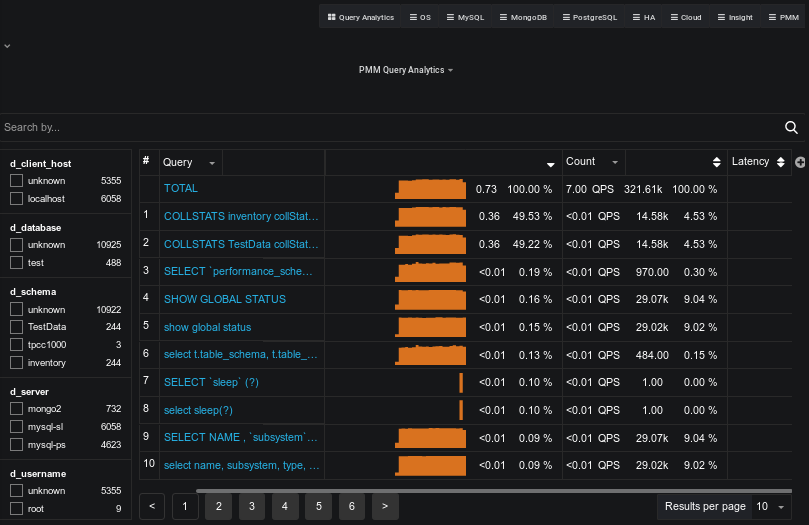
We also position a single sparkline for only the left-most column and render numeric values for all remaining columns.
Now you can add a column for each additional field which is exposed by the data source. For example, you can add Rows Examined by clicking the + sign and typing or selecting from the available list of fields:
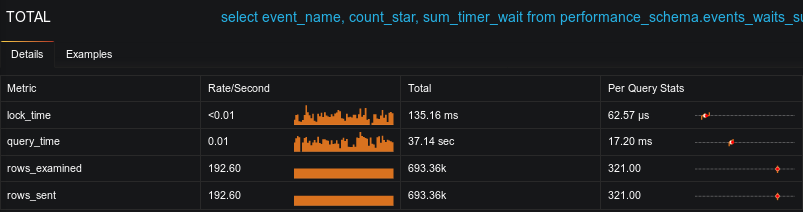
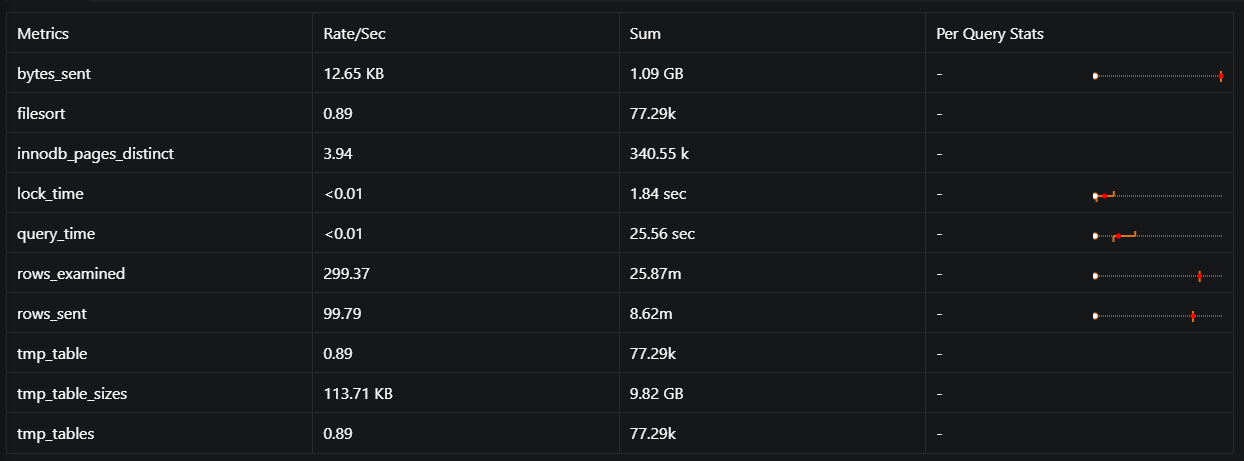
We’ve increased our MySQL support to include both PERFORMANCE_SCHEMA and Slow log – and if you’re using Percona Server with the Extended Slow Log format, you’ll be able to gain deep insight into the performance of individual queries, for example, InnoDB behavior. Note the difference between the detail available from PERFORMANCE_SCHEMA vs Slow Log:
PERFORMANCE_SCHEMA:
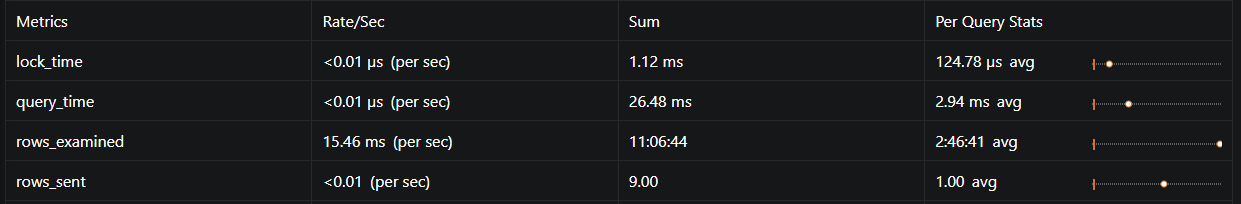
Slow Log:
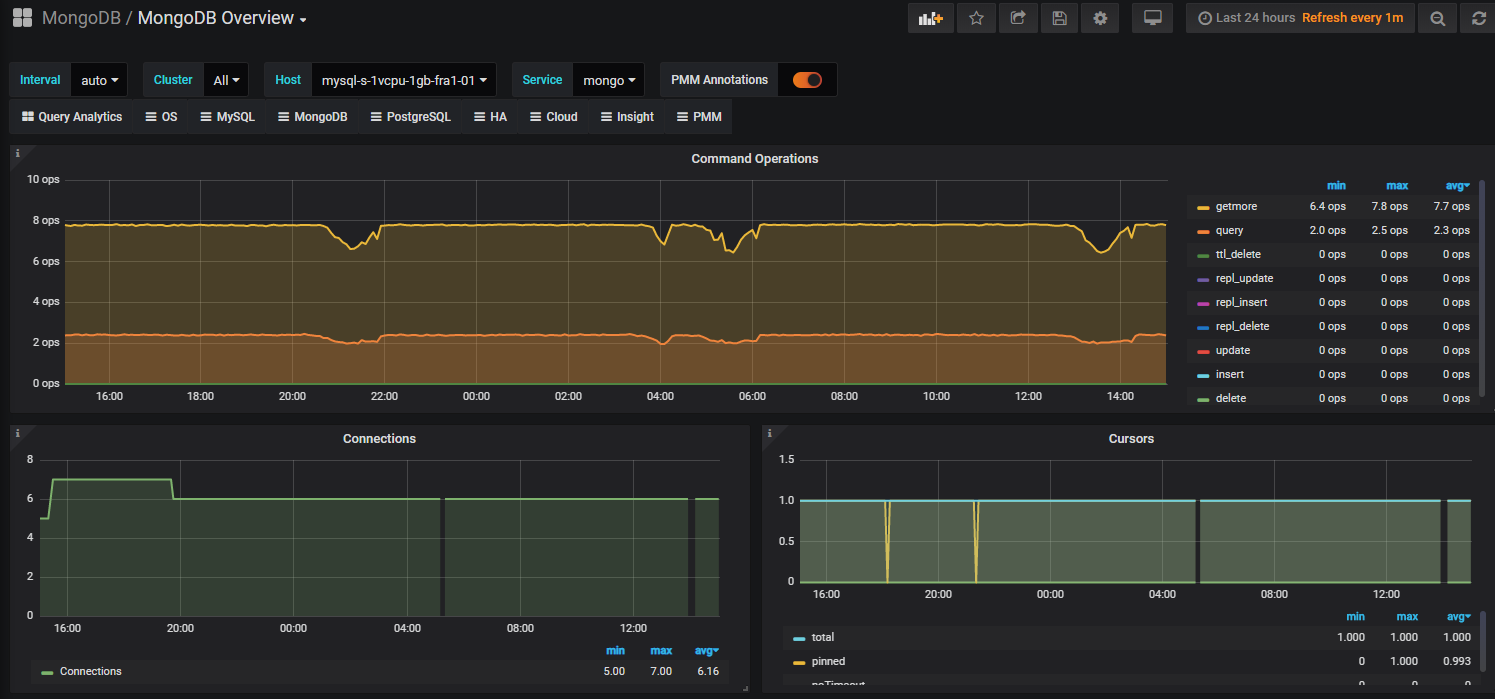
Support for MongoDB Metrics included in this release means you can add a local or remote MongoDB instance to PMM 2 and take advantage of the following view of MongoDB performance:
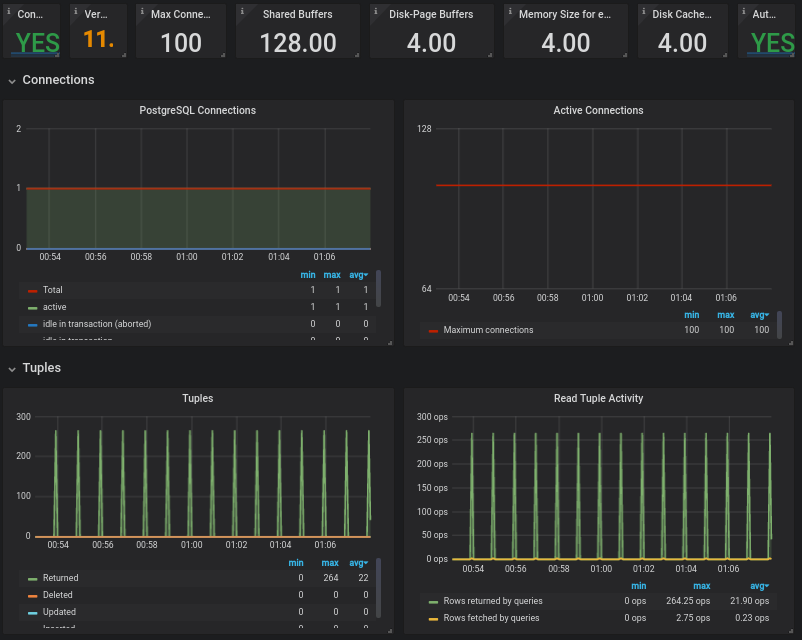
In this release, we’re also including support for PostgreSQL Metrics. We’re launching PMM 2 Beta with just the PostgreSQL Overview dashboard, but we have others under development, so watch for new Dashboards to appear in subsequent releases!
This new dashboard provides a bird’s-eye view, showing a large number of hosts at once. It allows you to easily figure out the hosts which have issues, and move onto other dashboards for a deeper investigation.
The charts presented show the top five hosts by different parameters:
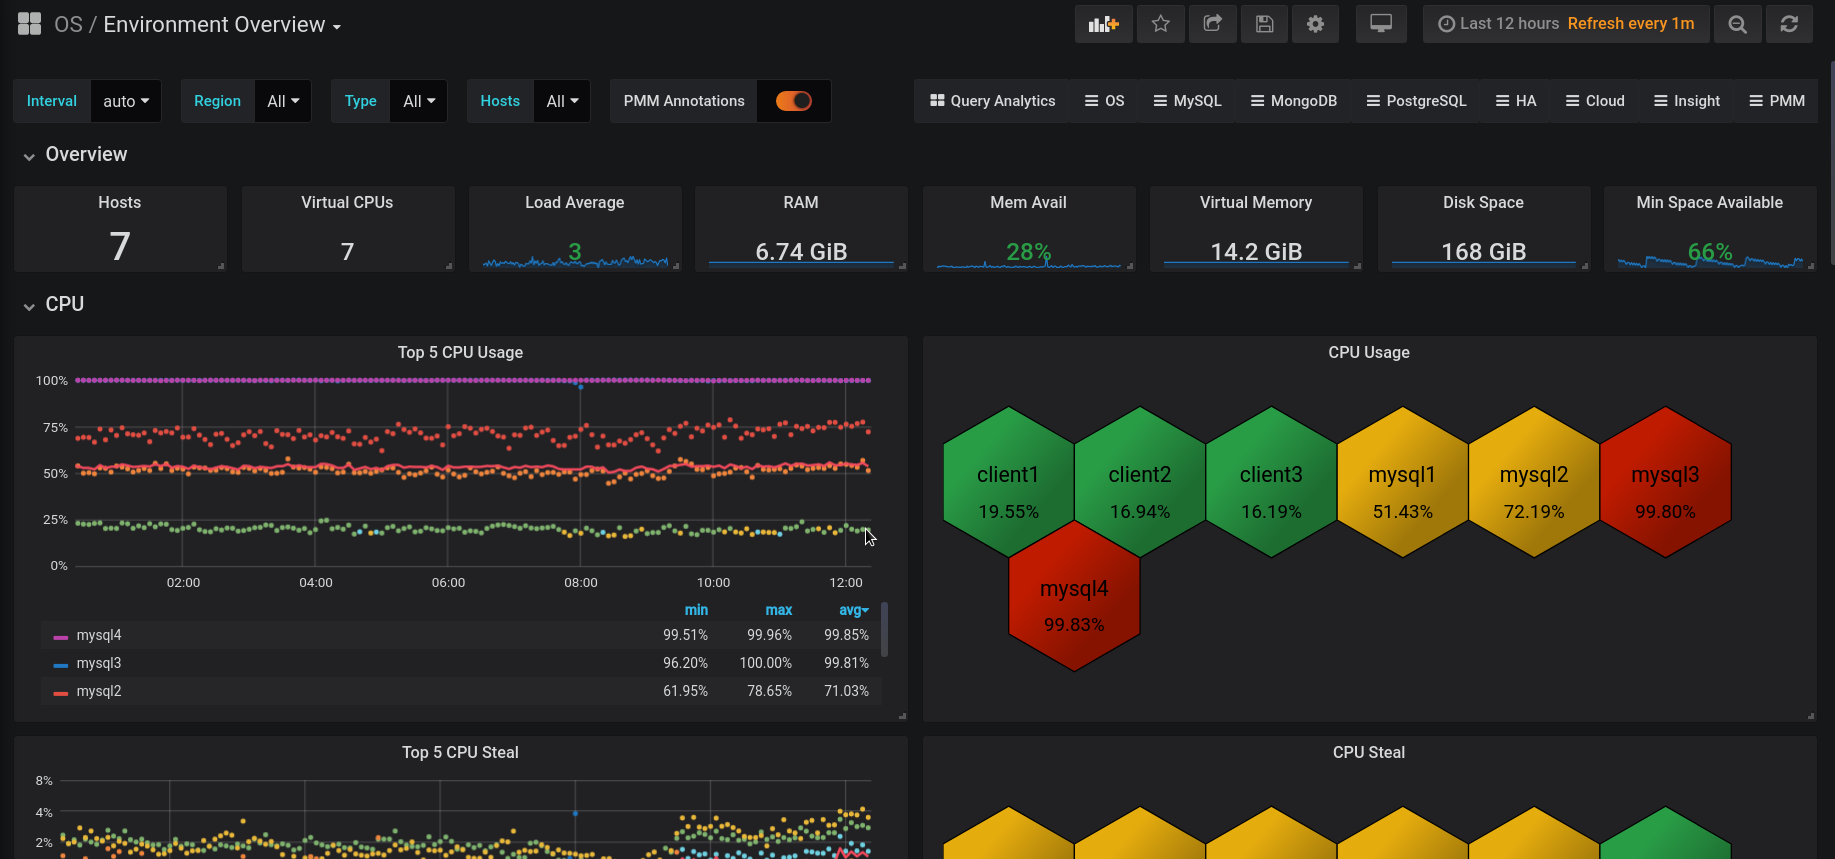
The eye-catching colored hexagons with statistical data show the current values of parameters and allow you to drill-down to a dashboard which has further details on a specific host.
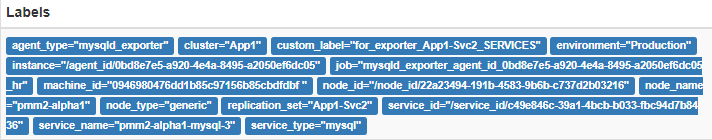
An important concept we’re introducing in PMM 2 is that when a label is assigned it is persisted in both the Metrics (Prometheus) and Query Analytics (Clickhouse) databases. So, when you browse a target in Prometheus you’ll notice many more labels appear – particularly the auto-discovered (replication_set, environment, node_name, etc.) and (soon to be released) custom labels via custom_label.
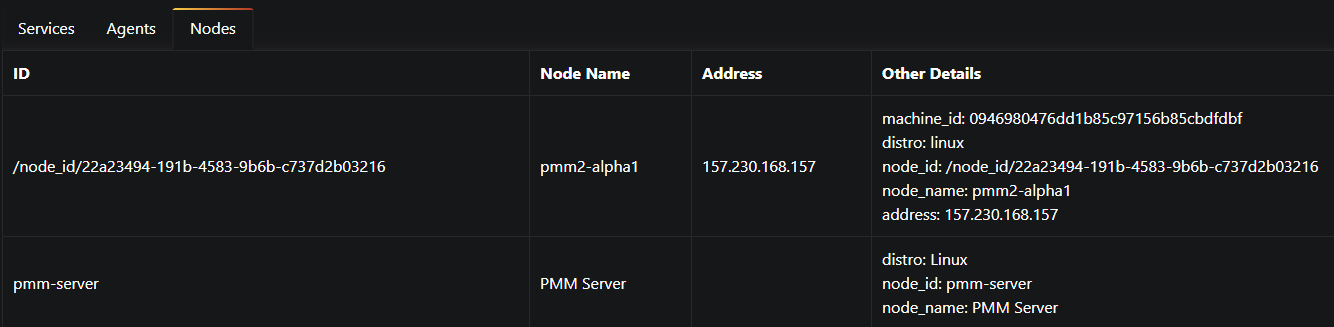
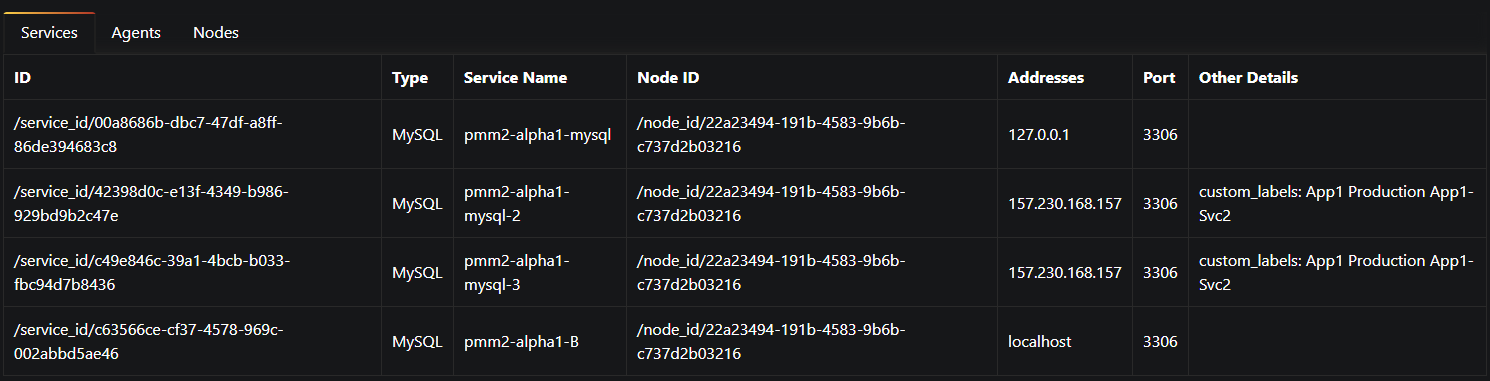
We’ve introduced a new dashboard with several tabs so that users are better able to understand which nodes, agents, and services are registered against PMM Server. We have an established hierarchy with Node at the top, then Service and Agents assigned to a Node.
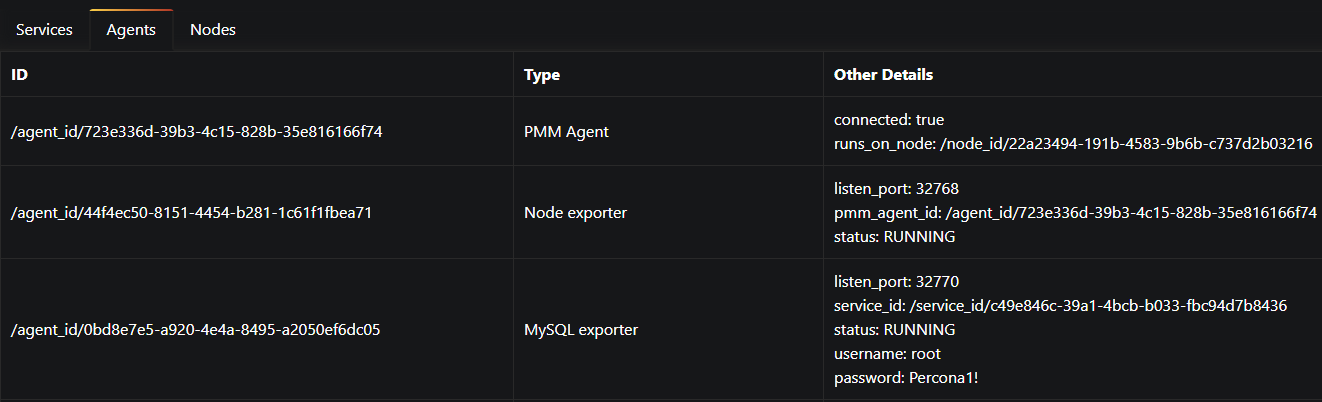
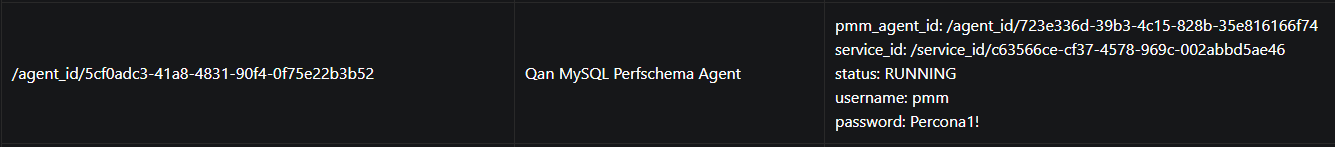
You can now see which services, agents, and nodes are registered with PMM Server.
In this example I have PMM Server (docker) running on the same virtualized compute instance as my Percona Server 5.7 instance, so PMM treats this as two different nodes.
For a monitored Percona Server instance, you’ll see an agent for each of these:
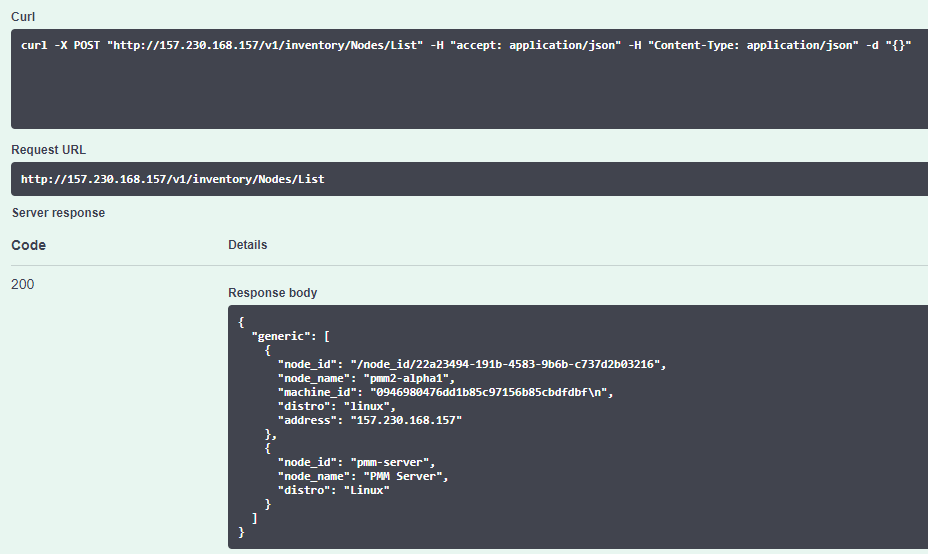
We are exposing an API for PMM Server! You can view versions, list hosts, and more…
The API is not guaranteed to work until GA release – so be prepared for some errors during Beta release.
Browse the API using Swagger at /swagger
 |
 |
|---|
The default PMM Server credentials are:
username: admin
password: admin
The easiest way to install PMM Server is to deploy it with Docker. Running the PMM 2 Docker container with PMM Server can be done by the following commands (note the version tag of 2.0.0-beta1):
|
1 2 |
docker create -v /srv --name pmm-data-2-0-0-beta1 perconalab/pmm-server:2.0.0-beta1 /bin/true docker run -d -p 80:80 -p 443:443 --volumes-from pmm-data-2-0-0-beta1 --name pmm-server-2.0.0-beta1 --restart always perconalab/pmm-server:2.0.0-beta1 |
Since PMM 2 is still not GA, you’ll need to leverage our experimental release of the Percona repository. You’ll need to download and install the official percona-release package from Percona, and use it to enable the Percona experimental component of the original repository. See percona-release official documentation for further details on this new tool.
Specific instructions for a Debian system are as follows:
|
1 2 |
wget https://repo.percona.com/apt/percona-release_latest.generic_all.deb sudo dpkg -i percona-release_latest.generic_all.deb |
Now enable the experimental repo:
|
1 2 |
sudo percona-release disable all sudo percona-release enable original experimental |
Install pmm2-client package:
|
1 2 |
apt-get update apt-get install pmm2-client |
Users who have previously installed pmm2-client alpha version should remove the package and install a new one in order to update to beta1.
Please note that leaving experimental repository enabled may affect further package installation operations with bleeding edge software that may not be suitable for Production. You can revert by disabling experimental via the following commands:
|
1 2 |
sudo percona-release disable original experimental sudo apt-get update |
Once PMM Client is installed, run the pmm-admin config command with your PMM Server IP address to register your Node:
|
1 |
# pmm-admin config --server-insecure-tls --server-url=https://<IP Address>:443 |
You should see the following:
|
1 2 3 4 5 6 7 |
Checking local pmm-agent status... pmm-agent is running. Registering pmm-agent on PMM Server... Registered. Configuration file /usr/local/percona/pmm-agent.yaml updated. Reloading pmm-agent configuration... Configuration reloaded. |
MySQL server can be added for the monitoring in its normal way. Here is a command which adds it using the PERFORMANCE_SCHEMA source:
|
1 |
sudo pmm-admin add mysql --use-perfschema --username=pmm --password=pmm |
where username and password are credentials for accessing MySQL.
The syntax to add MySQL services (Metrics and Query Analytics) using the Slow Log source is the following:
|
1 |
sudo pmm-admin add mysql --use-slowlog --username=pmm --password=pmm |
When the server is added, you can check your MySQL dashboards and Query Analytics in order to view its performance information!
You can add MongoDB services (Metrics and Query Analytics) with a similar command:
|
1 |
pmm-admin add mongodb --use-profiler --use-exporter --username=pmm --password=pmm |
You can add PostgreSQL service as follows:
|
1 |
pmm-admin add postgresql --username=pmm --password=pmm |
You can then check your PostgreSQL Overview dashboard.
Percona Monitoring and Management (PMM) is a free and open-source platform for managing and monitoring MySQL®, MongoDB®, and PostgreSQL® performance. You can run PMM in your own environment for maximum security and reliability. It provides thorough time-based analysis for MySQL®, MongoDB®, and PostgreSQL® servers to ensure that your data works as efficiently as possible.
Help us improve our software quality by reporting any Percona Monitoring and Management bugs you encounter using our bug tracking system.
Resources
RELATED POSTS


Pmm has been constantly modifying the log_output variable to ‘FILE’, but we use log_output=’FILE,TABLE’ . You guys should add a pmm-limitations page to the documentation and note that pmm does not support user modification of the log_output variable because pmm will change it back.
2019-07-25T06:32:13.001818Z 17853345 Query SET GLOBAL slow_query_log=OFF
2019-07-25T06:32:13.002268Z 17853345 Query SET GLOBAL log_output=’file’
2019-07-25T06:32:13.002426Z 17853345 Query SET GLOBAL slow_query_log=ON
Thank you for this Article. I am trying to add QAN using pmm2, but these options are not working:
pmm-admin add mongodb –use-profiler –use-exporter
pmm-admin: error: unknown long flag ‘–use-profiler’, try –help
And I tried –help, it is not giving any relative parameter for exporter and profiler
Error:pmm-admin: error: unknown long flag ‘–use-exporter’, try –help
pmm-admin: error: unknown long flag ‘–use-profiler’, try –help
Could you please help or route to qan mognodb pmm2 document.
Hi @aayushi Mangal
You no longer need to pass –use-profiler or –use-exporter, it now uses options flag –query-source=profiler as the default.
see the help available at:
pmm-admin add mongodb –help