
As a Solutions Engineer at Percona, one of my responsibilities is to support our customer-facing roles such as the sales and customer success teams, which affords me the opportunity to speak to many current and new customers who partner with Percona. I often find that many people are interested in Percona Monitoring and Management (PMM) as a free and open-source monitoring solution due to its robust monitoring capabilities when compared to many SaaS-based monitoring solutions. They are interested in installing PMM for MongoDB for the first time and want a “quick start guide” with a brief overview to get their feet wet. I have included the commands to get started for both PMM 1 and PMM 2 (PMM2 is still in beta).
PMM is an open-source platform for out-of-the-box management and monitoring of MySQL, MongoDB, and PostgreSQL performance, on-premise and in the cloud. It is developed by Percona in collaboration with experts in the field of managed database services, support, and consulting. PMM is built off of Prometheus, a powerful open-source monitoring and alerting platform, and supports any other service that has an exporter. An exporter is an endpoint that collects data on the instance being monitored and is polled by Prometheus to collect metrics. For more information on how to use your own exporters, read the documentation here.
When deployed on-premises, the PMM platform is based on a client-server model that enables scalability. It includes the following modules:
PMM can also be deployed to support DBaaS instances for remoting monitoring. Instructions can be found here, under the Advanced section. The drawback of this approach is that you will not have visibility of host-level metrics (CPU, memory, and disk activity will not be captured nor displayed in PMM). There are currently 3 different deployment options:
For a more detailed overview of the PMM Architecture please read the Overview of PMM Architecture.
When deploying PMM in this example, I am making the following assumptions about the environment:
This process will consist of two steps:
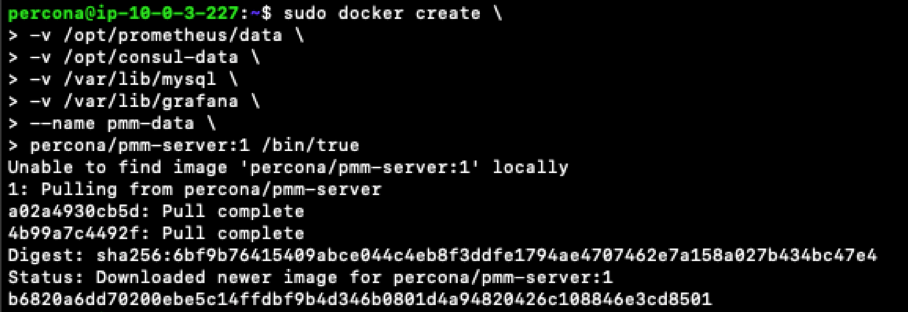
The code below illustrates the command for creating the docker container for PMM 1:
|
1 2 3 4 5 6 7 |
docker create -v /opt/prometheus/data -v /opt/consul-data -v /var/lib/mysql -v /var/lib/grafana --name pmm-data percona/pmm-server:1 /bin/true |
The code below illustrates the command for creating the docker container for PMM 2:
|
1 |
docker create -v /srv --name pmm-data-2-0-0-beta1 perconalab/pmm-server:2.0.0-beta1 /bin/true |
This is the expected output from the code:
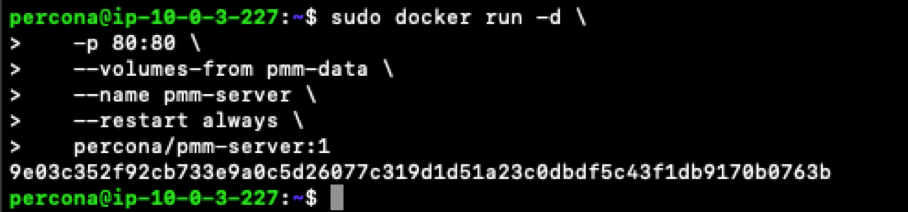
Use the following command to start the PMM 1 docker container:
|
1 2 3 4 5 6 |
docker run -d -p 80:80 --volumes-from pmm-data --name pmm-server --restart always percona/pmm-server:1 |
Use the following command to start the PMM 2 docker container:
|
1 |
docker run -d -p 80:80 -p 443:443 --volumes-from pmm-data-2-0-0-beta1 --name pmm-server-2.0.0-beta1 --restart always perconalab/pmm-server:2.0.0-beta1 |
This is the expected output from the code:
The PMM Server should now be installed! Yes, it IS that easy. In order to check that you can access PMM, navigate in a browser to the IP address of the monitoring host. If you are using PMM 2, the default username and password for viewing PMM is admin:admin. You should arrive at a page that looks like https://pmmdemo.percona.com.
PMM Query Analytics for MongoDB requires the user of the mongodb_exporter to have the clusterMonitor role assigned for the admin database and the read role for the local database. If you do not have these set up already, please read Configuring MongoDB for Monitoring in PMM Query Analytics.
We must first enable the Percona package repository on our MongoDB instance and install the PMM Client. We can run the following commands in order to accomplish this:
|
1 2 3 |
$ wget https://repo.percona.com/apt/percona-release_latest.generic_all.deb $ sudo dpkg -i percona-release_latest.generic_all.deb $ sudo apt-get update |
Since PMM 2 is still not GA, you’ll need to leverage our experimental release of the Percona repository. You’ll need to download and install the official percona-release package from Percona and use it to enable the Percona experimental component of the original repository. See percona-release official documentation for further details on this new tool. The following commands can be used for PMM 2:
|
1 2 3 4 5 |
$ wget https://repo.percona.com/apt/percona-release_latest.generic_all.deb $ sudo dpkg -i percona-release_latest.generic_all.deb $ sudo percona-release disable all $ sudo percona-release enable original experimental $ sudo apt-get update |
Now that we have the MongoDB database server configured with the Percona software repository, we can download the agent software with the local package manager. Enter the following command to automatically download and install the PMM Client package on the MongoDB server:
|
1 |
$ sudo apt-get install pmm-client |
To download and install the PMM 2 Client:
|
1 |
$ apt-get install pmm2-client |
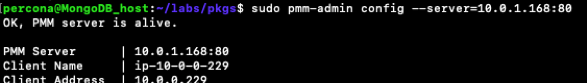
Next, we will configure the PMM client by telling it where to find the PMM server. Execute the following command to configure the PMM client:
|
1 |
$ sudo pmm-admin config --server=<pmm_server_ip>:80 |
To configure the PMM 2 Client:
|
1 |
$ pmm-admin config --server-insecure-tls --server-url=https://<pmm_server_ip>:443 |
You should get a similar output as below if it was successful:
Now we provide the PMM Client credentials necessary for monitoring the MongoDB database. Execute the following command to start monitoring and communicating with the PMM server:
|
1 |
$ sudo pmm-admin add mongodb --uri mongodb://percona:percona@127.0.0.1:27017 |
To start monitoring and communicating with the PMM 2 Server:
|
1 |
$ sudo pmm-admin add mongodb --use-profiler --server-insecure-tls --username=percona --password=percona --server-url=https://<pmm_ip>:443 |
You should get a similar output as below if it was successful:

Great! We have successfully installed PMM for MongoDB and are ready to take a look at the dashboards.
Navigate to the IP address of your monitoring host. http://<pmm_server_ip>.
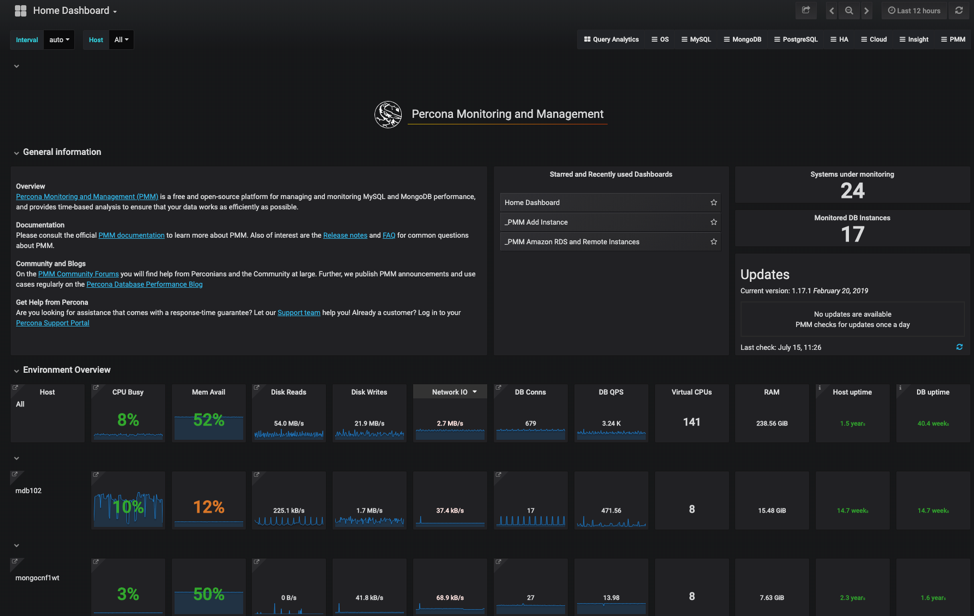
PMM Home Dashboard – The Home Dashboard for PMM gives an overview of your entire environment to include all the systems you have connected and configured for monitoring under PMM. It provides useful metrics such as CPU utilization, RAM availability, database connections, and uptime.
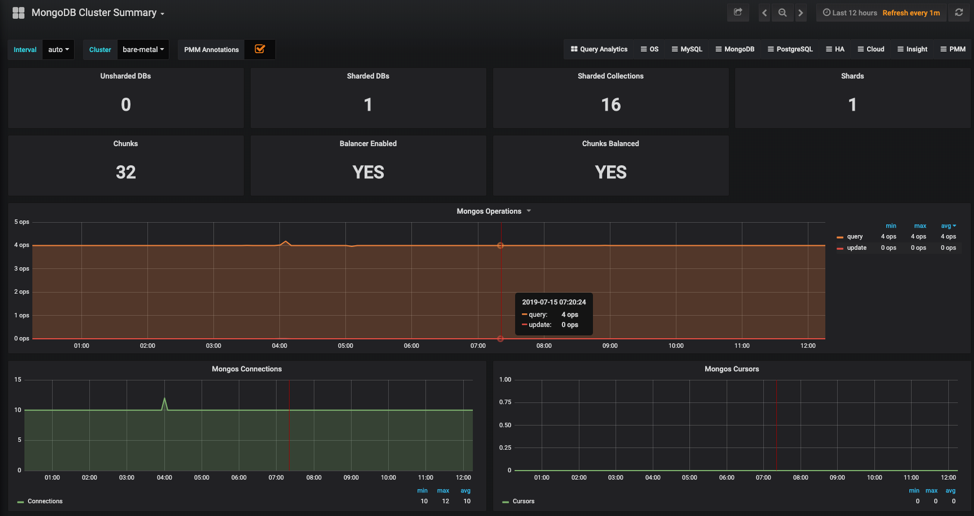
Cluster Summary – it shows the statistics for the selected MongoDB cluster such as counts of sharded and un-sharded databases, shard and chunk statistics, and various mongos statistics.
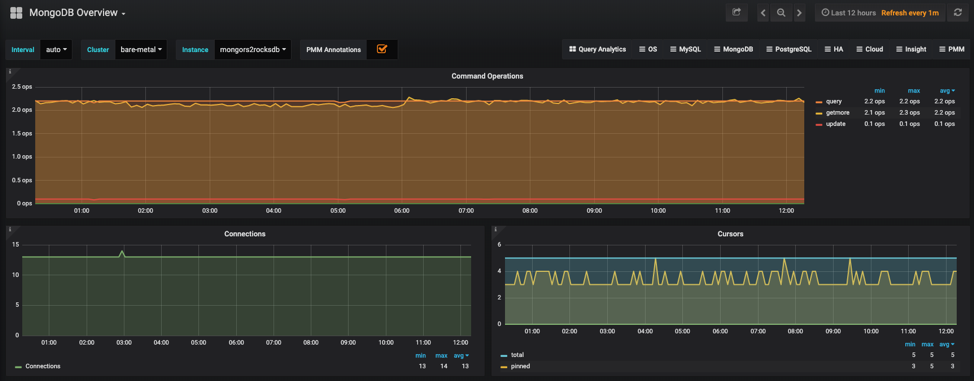
MongoDB Overview – this provides basic information about MongoDB instances such as connections, command operations, and document operations.
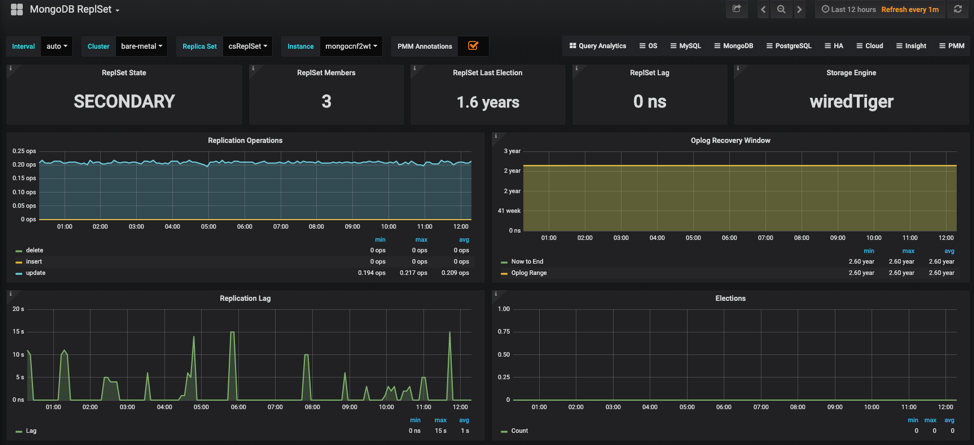
ReplSet – provides information about replica sets and their members such as replication operations, replication lag, and member state uptime.
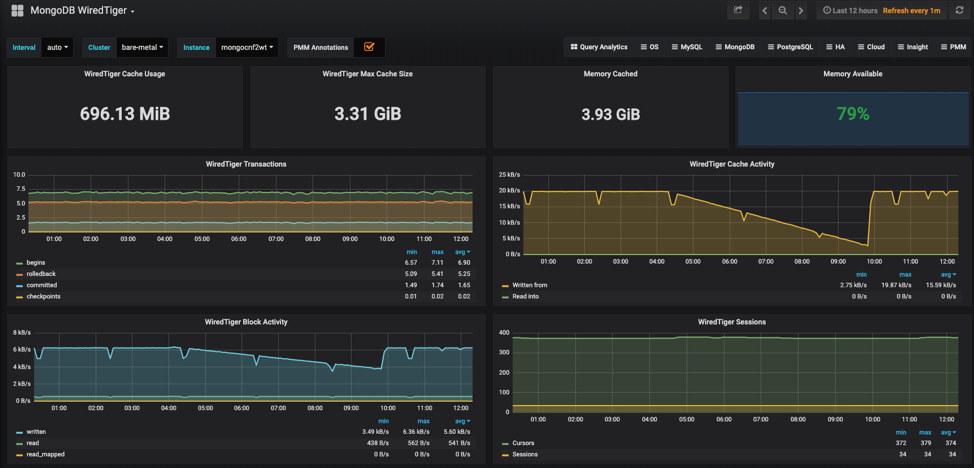
WiredTiger/MMAPv1/In-Memory/RocksDB – it contains metrics that describe the performance of the selected host storage engine.
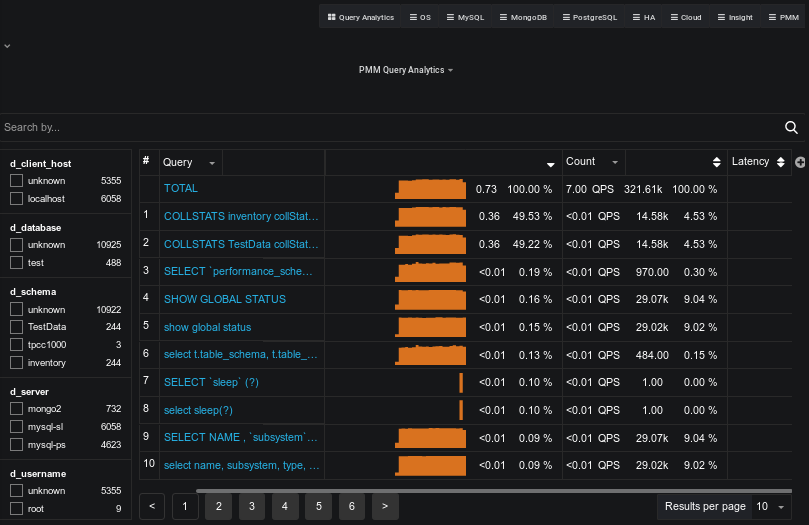
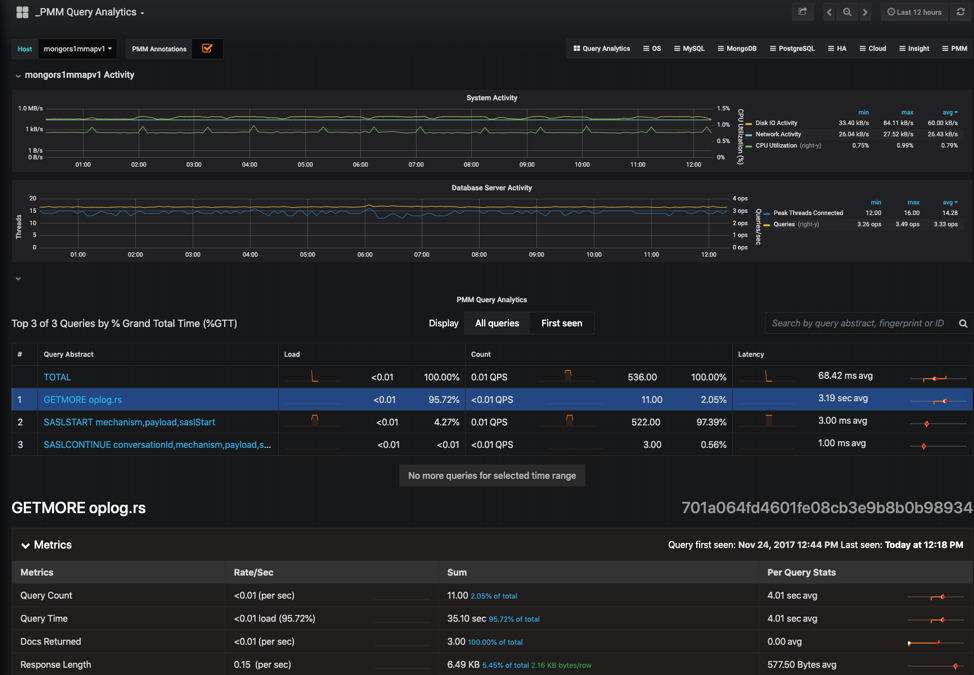
Query Analytics – this allows you to analyze database queries over periods of time. This can help you optimize database performance by ensuring queries are executed as expected and within the shortest amount of time. If you are having performance issues, this is a great place to see which queries may be the cause of your performance issues and get detailed metrics for them.
Now that you have PMM for MongoDB up and running, I encourage you to explore in-depth more of the graphs and features. A few other MongoDB PMM blog posts which may be of interest:
If you run into issues during the install process, a good place to start is Peter Zaitsev’s blog post on PMM Troubleshooting.
Resources
RELATED POSTS


would it be possible if we could also get the slow query metric along with database size and index size
Hi Stephen Thorn, did you get time to check my concern.