
This post explains how you can quickly start using such trending tools as Prometheus and Grafana for monitoring and graphing of MySQL and system performance.
Update, February 20, 2017: Since this blog post was published, we have released Percona Monitoring and Management (PMM), which is the easiest way to monitor MySQL and MongoDB using Grafana and Prometheus. You can check the PMM documentation for more detail. If you need help, PMM is fully supported under Percona Support. Alternatively, community support is available through the Percona Montoring and Management Forums.
I will try to keep this blog as short as possible, so you can quickly set things up before getting bored. I plan to cover the details in the next few posts. I am going to go through the installation process here in order to get some really useful and good-looking graphs in the end.
 Prometheus is an open-source service monitoring system and time series database. In short, the quite efficient daemon scrapes metrics from remote machines using HTTP protocol and stores data in the local time-series database. Prometheus provides a simple web interface, a very powerful query language, HTTP API, etc. However, the storage is not designed to be durable for the time being.
The remote machines need to run exporters to expose metrics to Prometheus. We will be using the following two:
 Grafana is an open source, feature-rich metrics dashboard and graph editor for Graphite, Elasticsearch, OpenTSDB, Prometheus, and InfluxDB. It is a powerful tool for visualizing large-scale measurement data and designed to work with time-series. Grafana supports different types of graphs, allows for a custom representation of individual metrics on the graph and various methods of authentication including LDAP.
Here is a diagram of the setup we are going to use:
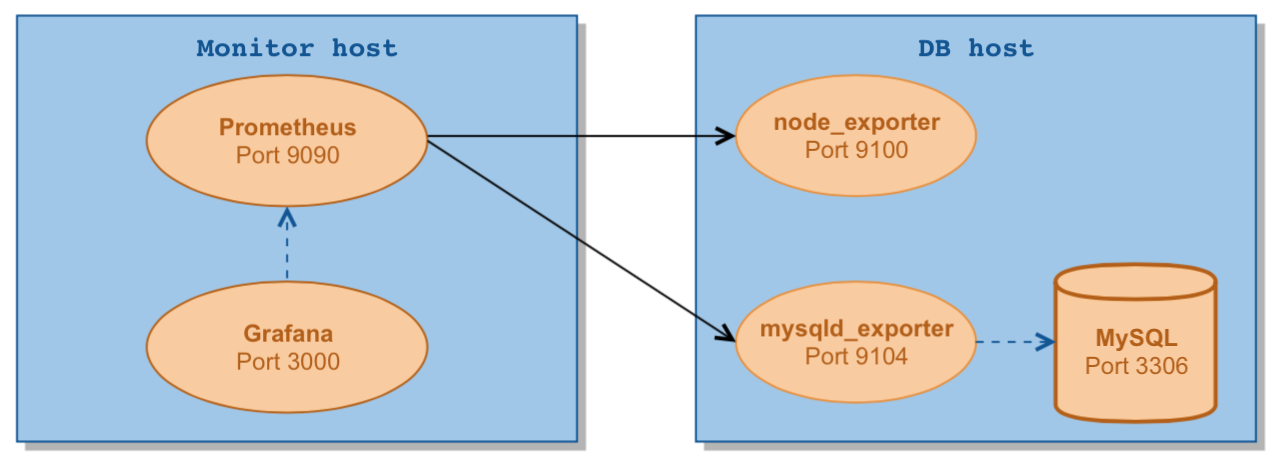
To install on the monitor host.
Get the latest tarball from Github.
|
1 2 3 |
wget https://github.com/prometheus/prometheus/releases/download/0.17.0rc2/prometheus-0.17.0rc2.linux-amd64.tar.gz mkdir /opt/prometheus tar zxf prometheus-0.17.0rc2.linux-amd64.tar.gz -C /opt/prometheus --strip-components=1 |
Create a simple config:
|
1 2 3 4 5 6 7 8 9 10 11 12 13 14 15 16 17 |
cat << EOF > /opt/prometheus/prometheus.yml global: scrape_interval: 5s evaluation_interval: 5s scrape_configs: - job_name: linux target_groups: - targets: ['192.168.56.107:9100'] labels: alias: db1 - job_name: mysql target_groups: - targets: ['192.168.56.107:9104'] labels: alias: db1 EOF |
where 192.168.56.107 is the IP address of the db host we are going to monitor and db1 is its short name. Note, the “alias” label is important here because we rely on it in the predefined dashboards below to get per host graphs.
Start Prometheus in the foreground:
|
1 2 3 4 5 6 7 8 9 10 11 12 13 |
[root@centos7 ~]# cd /opt/prometheus [root@centos7 prometheus]# ./prometheus prometheus, version 0.17.0rc2 (branch: release-0.17, revision: 667c221) build user: fabianreinartz@macpro build date: 20160205-13:35:53 go version: 1.5.3 INFO[0000] Loading configuration file prometheus.yml source=main.go:201 INFO[0000] Loading series map and head chunks... source=storage.go:297 INFO[0000] 0 series loaded. source=storage.go:302 WARN[0000] No AlertManager configured, not dispatching any alerts source=notification.go:165 INFO[0000] Starting target manager... source=targetmanager.go:114 INFO[0000] Target manager started. source=targetmanager.go:168 INFO[0000] Listening on :9090 source=web.go:239 |
Now we can access Prometheus’ built-in web interface by http://monitor_host:9090
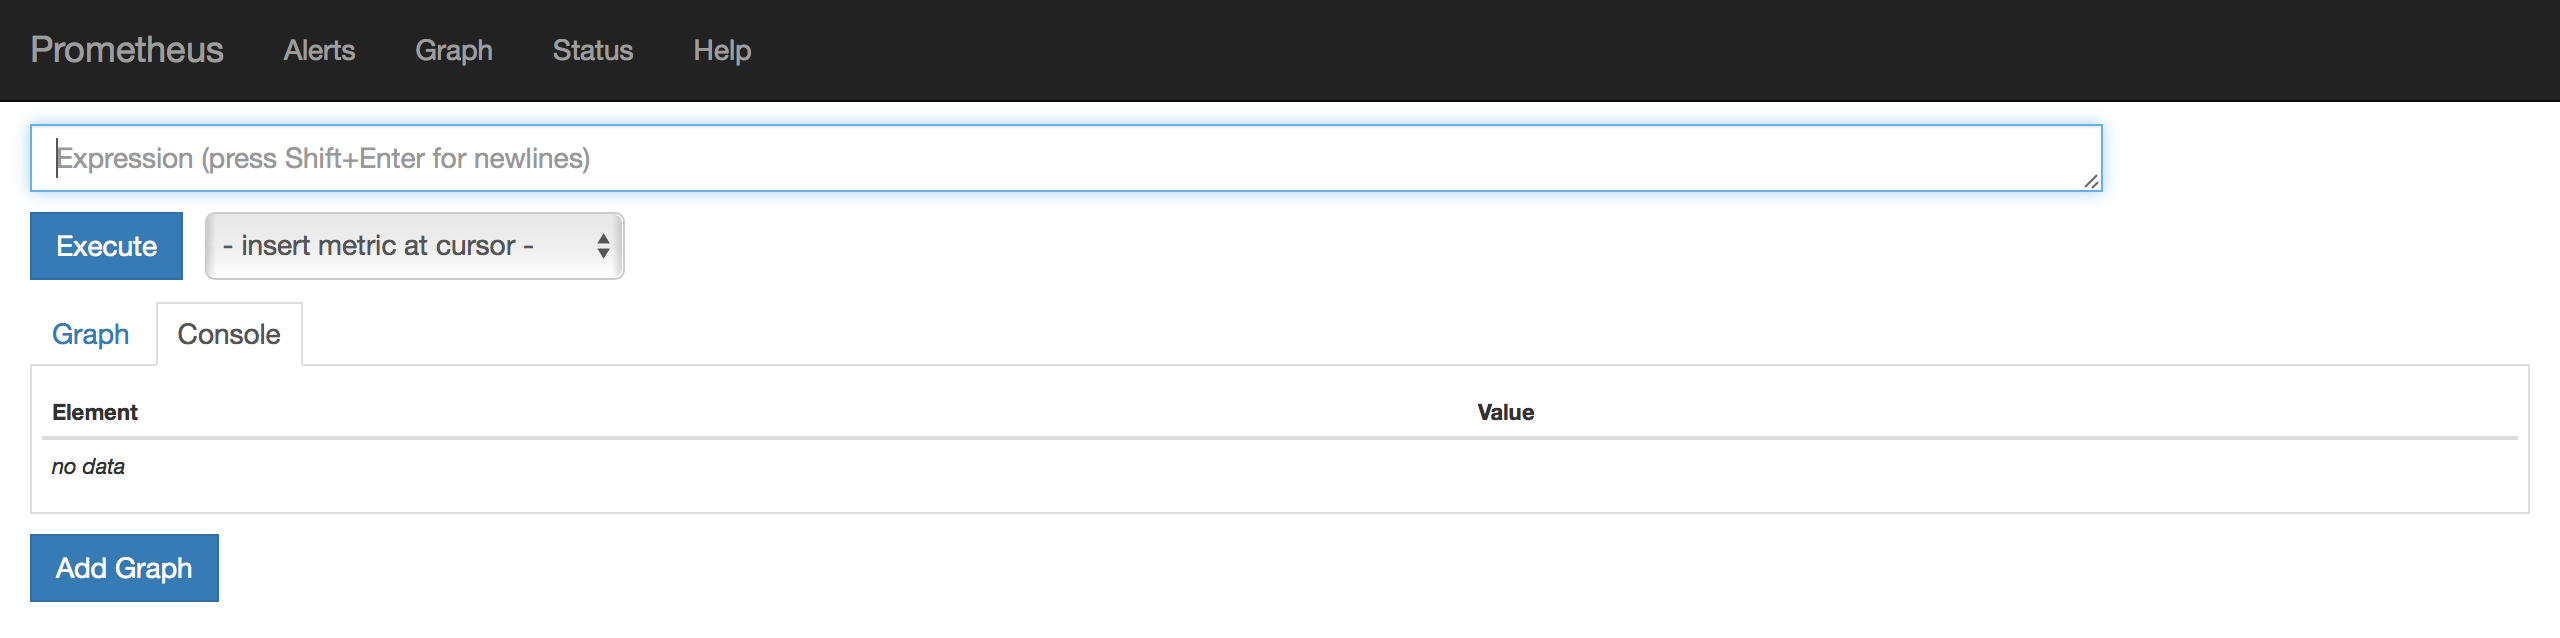
If you look at the Status page from the top menu, you will see that our monitoring targets are down so far. Now let’s setup them – prometheus exporters.
Install on the db host. Of course, you can use the same monitor host for the experiment. Obviously, this node must run MySQL.
Download exporters from here and there.
|
1 2 3 4 5 |
wget https://github.com/prometheus/node_exporter/releases/download/0.12.0rc3/node_exporter-0.12.0rc3.linux-amd64.tar.gz wget https://github.com/prometheus/mysqld_exporter/releases/download/0.7.1/mysqld_exporter-0.7.1.linux-amd64.tar.gz mkdir /opt/prometheus_exporters tar zxf node_exporter-0.12.0rc3.linux-amd64.tar.gz -C /opt/prometheus_exporters tar zxf mysqld_exporter-0.7.1.linux-amd64.tar.gz -C /opt/prometheus_exporters |
Start node_exporter in foreground:
|
1 2 3 4 5 6 7 8 9 10 11 12 13 14 15 16 17 18 19 20 21 22 |
[root@centos7 ~]# cd /opt/prometheus_exporters [root@centos7 prometheus_exporters]# ./node_exporter INFO[0000] No directory specified, see --collector.textfile.directory source=textfile.go:57 INFO[0000] Enabled collectors: source=node_exporter.go:146 INFO[0000] - filesystem source=node_exporter.go:148 INFO[0000] - loadavg source=node_exporter.go:148 INFO[0000] - time source=node_exporter.go:148 INFO[0000] - vmstat source=node_exporter.go:148 INFO[0000] - diskstats source=node_exporter.go:148 INFO[0000] - filefd source=node_exporter.go:148 INFO[0000] - mdadm source=node_exporter.go:148 INFO[0000] - meminfo source=node_exporter.go:148 INFO[0000] - netdev source=node_exporter.go:148 INFO[0000] - textfile source=node_exporter.go:148 INFO[0000] - entropy source=node_exporter.go:148 INFO[0000] - stat source=node_exporter.go:148 INFO[0000] - uname source=node_exporter.go:148 INFO[0000] - conntrack source=node_exporter.go:148 INFO[0000] - netstat source=node_exporter.go:148 INFO[0000] - sockstat source=node_exporter.go:148 INFO[0000] - version source=node_exporter.go:148 INFO[0000] Starting node_exporter v0.12.0rc3 at :9100 source=node_exporter.go:167 |
Unlike node_exporter, mysqld_exporter wants MySQL credentials. Those privileges should be sufficient:
|
1 2 |
mysql> GRANT REPLICATION CLIENT, PROCESS ON *.* TO 'prom'@'localhost' identified by 'abc123'; mysql> GRANT SELECT ON performance_schema.* TO 'prom'@'localhost'; |
Create .my.cnf and start mysqld_exporter in foreground:
|
1 2 3 4 5 6 7 8 9 |
[root@centos7 ~]# cd /opt/prometheus_exporters [root@centos7 prometheus_exporters]# cat << EOF > .my.cnf [client] user=prom password=abc123 EOF [root@centos7 prometheus_exporters]# [root@centos7 prometheus_exporters]# ./mysqld_exporter -config.my-cnf=".my.cnf" INFO[0000] Starting Server: :9104 file=mysqld_exporter.go line=1997 |
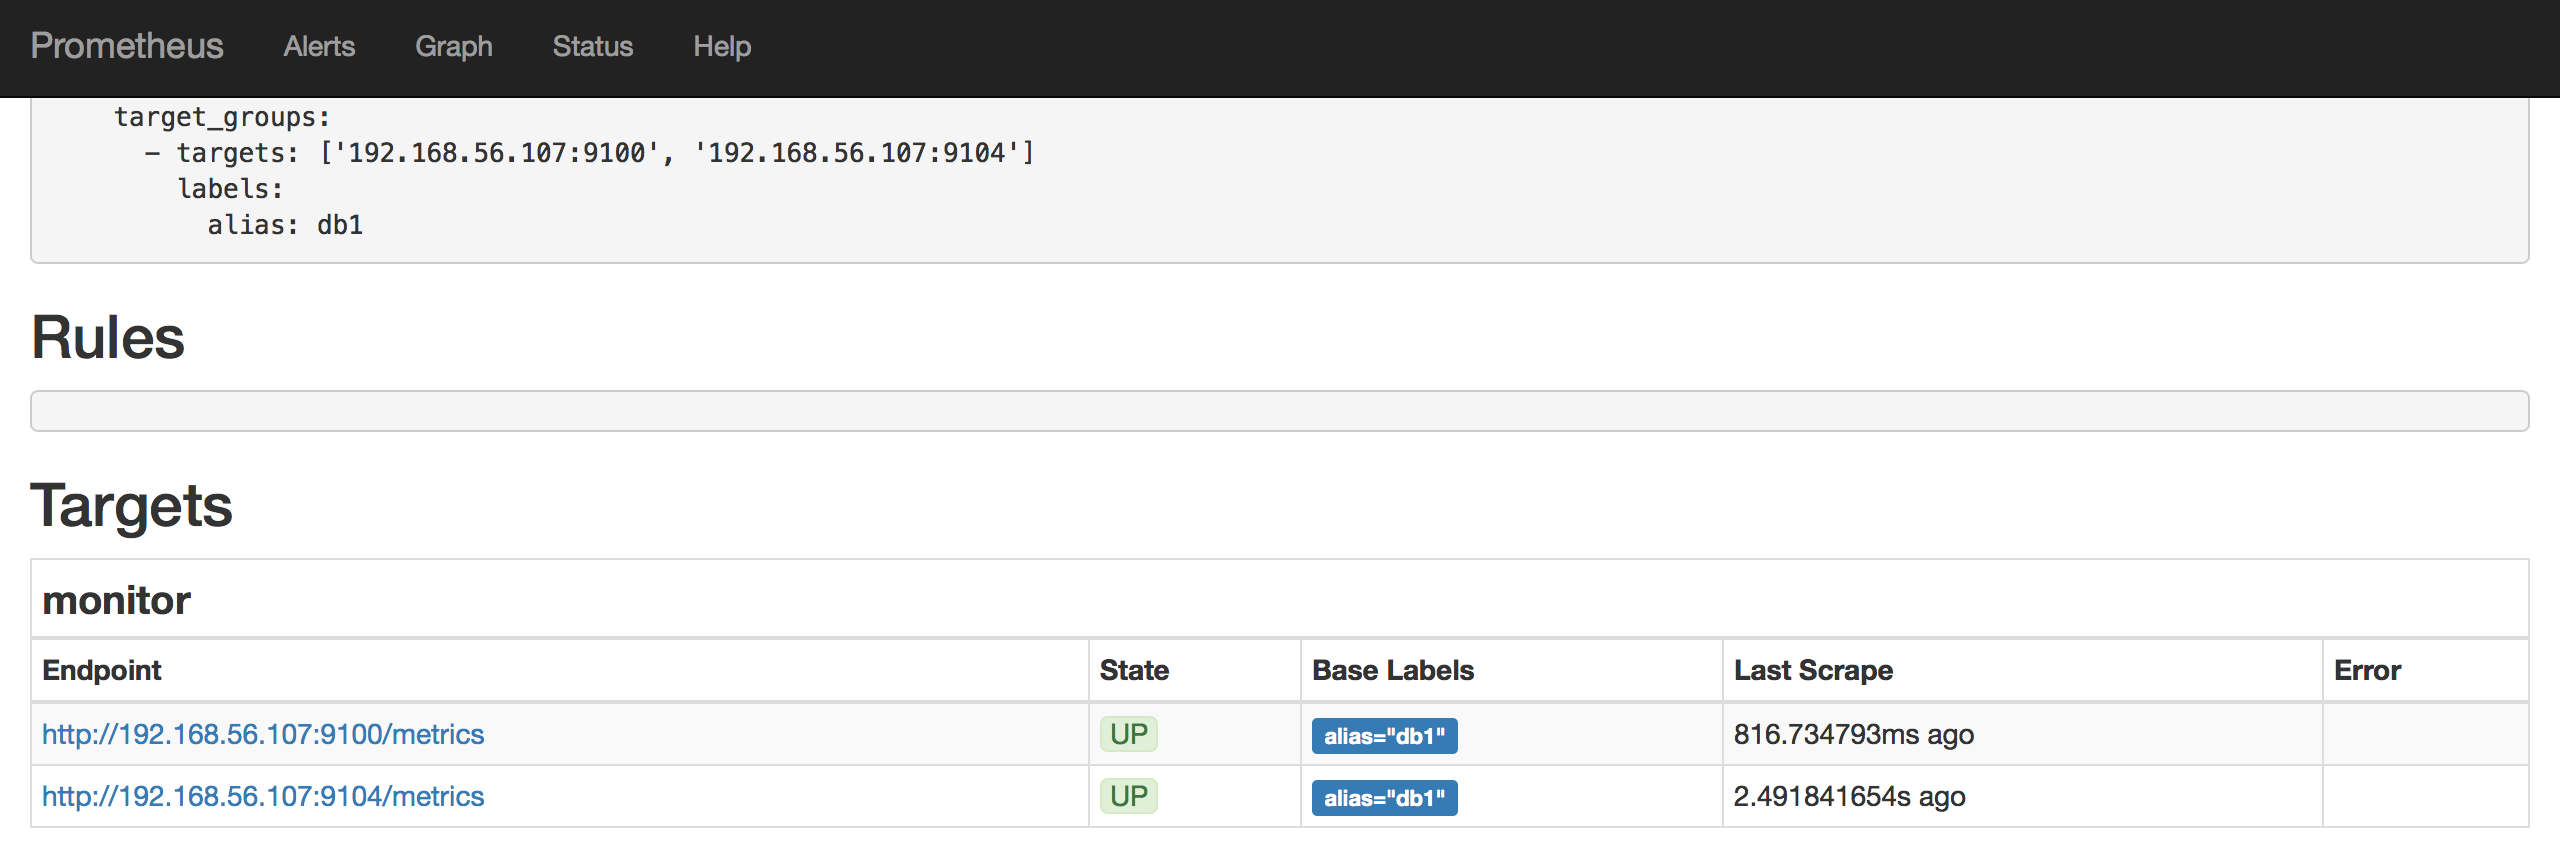
At this point we should see our endpoints are up and running on the Prometheus Status page:
Install on the monitor host.
Grafana has RPM and DEB packages. The installation is as simple as installing one package.
RPM-based system:
|
1 |
yum install https://grafanarel.s3.amazonaws.com/builds/grafana-2.6.0-1.x86_64.rpm |
or APT-based one:
|
1 2 3 |
wget https://grafanarel.s3.amazonaws.com/builds/grafana_2.6.0_amd64.deb apt-get install -y adduser libfontconfig dpkg -i grafana_2.6.0_amd64.deb |
Open and edit the last section of /etc/grafana/grafana.ini resulting in the following ending:
|
1 2 3 |
[dashboards.json] enabled = true path = /var/lib/grafana/dashboards |
Percona has built the predefined dashboards for Grafana with Prometheus for you.
Let’s get them deployed:
|
1 2 |
git clone https://github.com/percona/grafana-dashboards.git cp -r grafana-dashboards/dashboards /var/lib/grafana |
It is important to apply the following minor patch on Grafana 2.6 in order to use the interval template variable to get the good zoomable graphs. The fix is simply to allow variable in Step field on Grafana graph editor page. For more information, take a look at PR#3757 and PR#4257. We hope the last one will be released with the next Grafana version.
|
1 2 |
sed -i 's/step_input:""/step_input:c.target.step/; s/ HH:MM/ HH:mm/; s/,function(c)/,"templateSrv",function(c,g)/; s/expr:c.target.expr/expr:g.replace(c.target.expr,c.panel.scopedVars)/' /usr/share/grafana/public/app/plugins/datasource/prometheus/query_ctrl.js sed -i 's/h=a.interval/h=g.replace(a.interval, c.scopedVars)/' /usr/share/grafana/public/app/plugins/datasource/prometheus/datasource.js |
Those changes are idempotent.
Finally, start Grafana:
|
1 |
service grafana-server start |
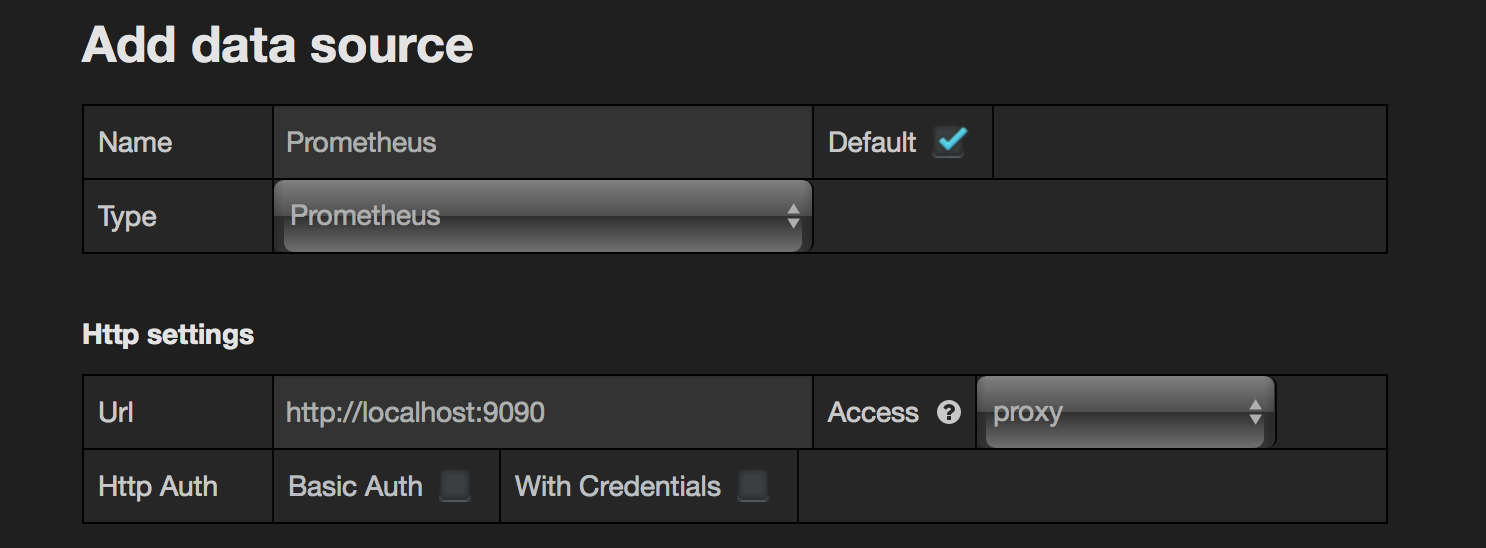
At this point, we are one step before being done. Login into Grafana web interface http://monitor_host:3000 (admin/admin).
Go to Data Sources and add one for Prometheus:
Now check out the dashboards and graphs. Say choose “System Overview” and period “Last 5 minutes” on top-right. You should see something similar:
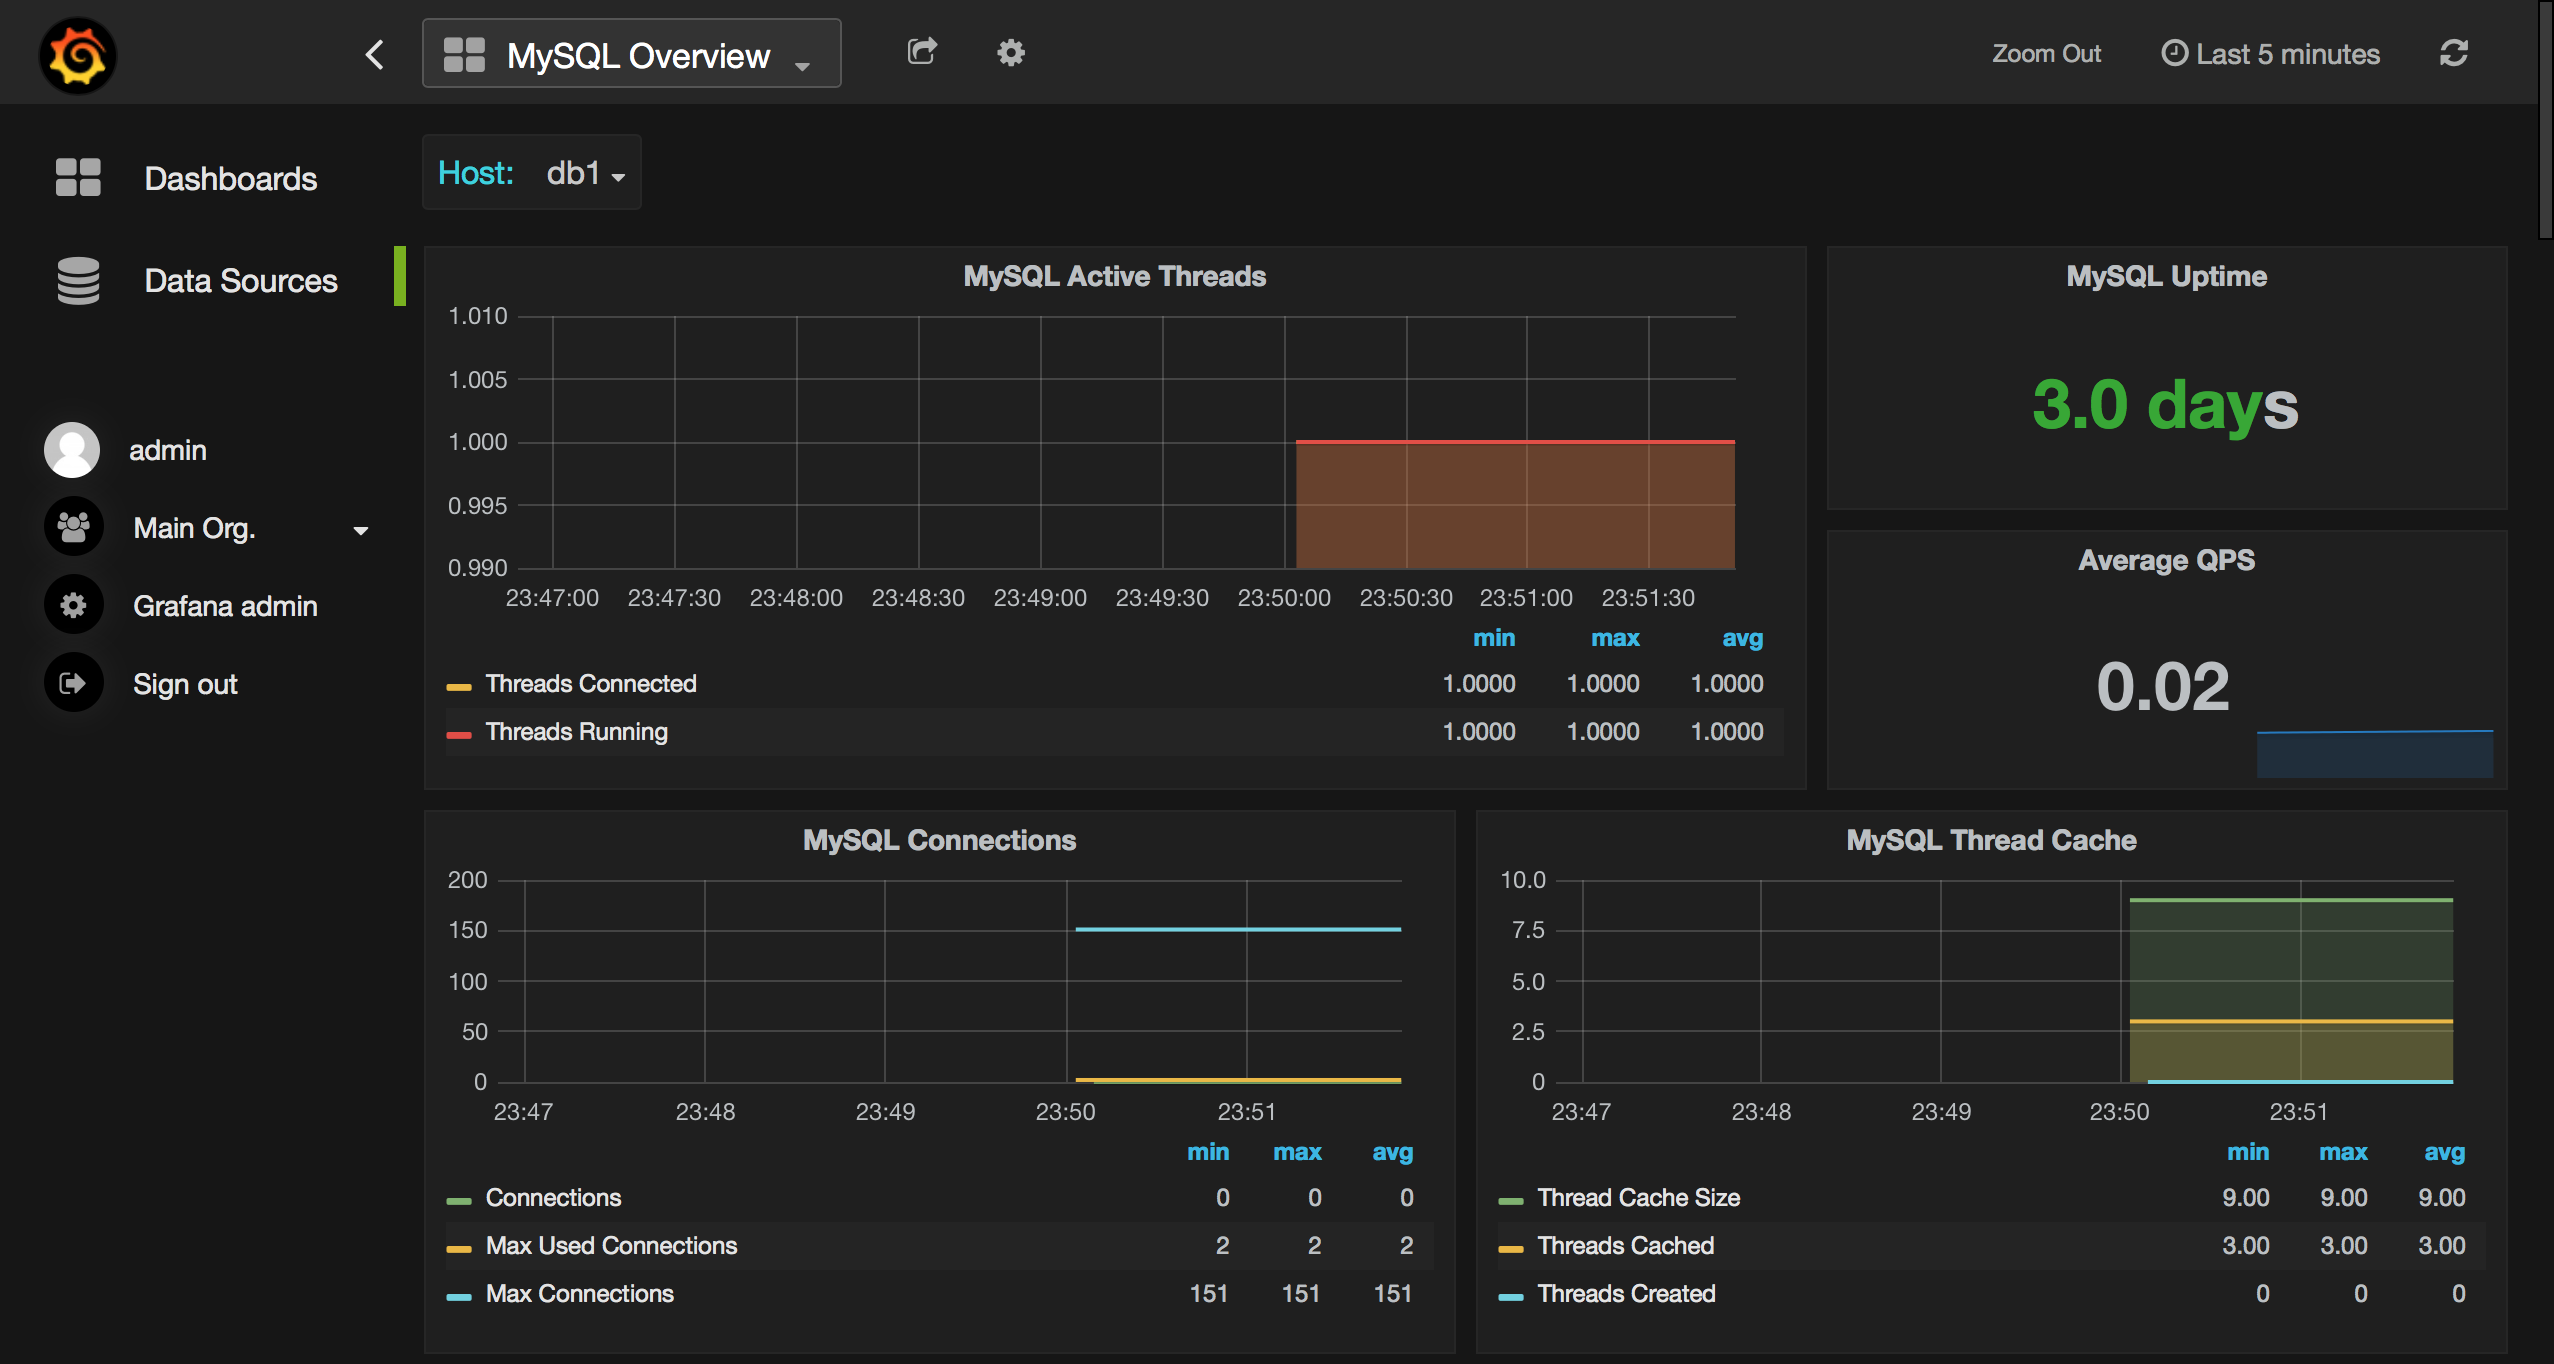
If your graphs are not populating ensure the system time is correct on the monitor host.
Here are some real-world samples (images are clickable and scrollable):


Enjoy!
Prometheus and Grafana is a great tandem for enabling monitoring and graphing capabilities for MySQL. The tools are pretty easy to deploy, they are designed for time series with high efficiency in mind. In the next blog post, I will talk more about technical aspects, problems, and related stuff.


In general it’s not correct to configure the node_exporter and the mysqld_exporter in the same job. This comes from the design idea that there may be more nodes or more services on different nodes. You may want to configure different scrape intervals for the node or mysqld.
I can’t disagree. For simplicity, I have used the minimal config file here.
In reality, for example, we employ job_name “linux” for node_ and “mysql” for mysqld_exporter in production.
Cool, thanks for putting this together, we need more howto guides for full Prometheus configurations. I’m currently working through a backlog of example alert configurations that can be published as “reasonable”
The big worry we have as a Prometheus community is having too much “copy-n-paste” configuration that doesn’t follow best practices. Or worse does follow best practices, but isn’t appropriate for many uses.
Fixed 😉
I would also note if you’re looking to try things out we have simple to install Docker package as well https://hub.docker.com/r/percona/pmm/
Hi Roman.
How it works if I want a custom metric? Let’s say I want to monitor in real time the number of sales (that would be a SELECT COUNT(*) from sales_table). Do I need to write a new exporter ?
Marcelo, yes, you need a new exporter for this. May be “SQL query result set metrics exporter” from https://prometheus.io/docs/instrumenting/exporters/ will work for you.
A new exporter is unnecessary, the performance_schema system provides metrics for this. The mysqld_exporter collector option “-collect.perf_schema.eventsstatements” is disabled by default, but it will easily provide metrics for all queries run against your server.
There are some limitations
* You need to be running MySQL >= 5.6
* Performance Schema must be enabled (defaults work just fine)
* The queries must not be prepared statements (Horrible design flaw in MySQL’s metrics at fault)
* You may need to adjust additional flags.
Oh, durr, I didn’t read the question properly. No, you would have to instrument this differently.
I would suggest adding prometheus metrics directly into your sales application, and not doing database counts.
Awsome !!! It’s so nice.
how to configure ALERTING?
I would point out this doc http://prometheus.io/docs/alerting/rules/
Hi Roman,
Thanks for putting all information on same page.
I am also exploring Prometheus and Grafana but I am stuck at last point after installing predefined dashboards for Grafana with Prometheus and restarting grafana.
Issue i am facing is I am am not able to see any of the graph when i login to grafana UI which is running on port 3000.
Can you please give me a pointer to figure out what exactly i am missing?
Ensure whether the system time is ok and grafana is patched with those 2 sed commands. It is safe to repeat them.
awesome post. thanks a lot for this.
What should my prometheus config look like if I want multiple MySQL hosts? I’m about to try the second one except with unique job names for each host, could you confirm what it should look like? thanks
– job_name: mysql
target_groups:
– targets: [‘192.168.56.107:9104′,’192.168.56.108:9104’]
labels:
alias: db1
or
– job_name: mysql
target_groups:
– targets: [‘192.168.56.107:9104’]
labels:
alias: db1
target_groups:
– targets: [‘192.168.56.108:9104’]
labels:
alias: db2
global:
scrape_interval: 5s
evaluation_interval: 5s
scrape_configs:
– job_name: linux
target_groups:
– targets: [‘localhost:9100’]
labels:
alias: localhost
– job_name: mysql
target_groups:
– targets: [‘192.168.56.106:9104’]
labels:
alias: db1
– targets: [‘192.168.56.107:9105’]
labels:
alias: db2
– targets: [‘192.168.56.108:9106’]
labels:
alias: db4
– targets: [‘localhost:9106’]
labels:
alias: db3
Is it safe to run those node and mysql exporters on the db host? Safe meaning, I’m thinking of deploying them in Production and I want to make sure about that. What is the overhead of those exporters running on the db host? Could it impact my db in anyway?
Hi,
I think it is reasonably safe. Overhead will depend a lot on how much data you capture and with what resolution. We put a lot of effort tuning exactly that, for example avoiding capturing table data if it there are too many tables in our packaged solution of Percona Monitoring and Management.
You can see the demo here http://pmmdemo.percona.com/ and download/install it to check it out.
Thanks Peter, what is your suggestion? Should I go with Nagios or Grafana & Prometheus combo? Also, is it possible to use Grafana with Nagios?
Sure. You can use Nagios for alerting and Grafana for trending. You can also use Prometheus Alerts though I think those are not as mature as Nagios yet
There are also people who had got Nagios to alert based on data in the Grafana database https://linuxboss.wordpress.com/2015/06/14/nagios-alerts-in-grafana-how/
Hey Peter, can’t I download the PMM as an RPM for Linux instead of docker? I do not have network access in my server to download the docker container.
PMM server is distributed as a docker image because it is prebuilt with all the necessary components. There can’t be a regular RPM for it. In the future we may have other images, e.g. VM, AWS etc.
PMM client is distributed as RPM, DEB or tarball whatever you prefer.
Is it possible to download the docker container in one server and then copy it to other servers where network access is not available?
Hi Roman Vynar,
Not sure about wrong configurations on my host, I got this messages on Prometheus/status:
Get http://localhost:9100/metrics: dial tcp [::1]:9100: getsockopt: connection refused
Get http://localhost:9104/metrics: dial tcp [::1]:9104: getsockopt: connection refused
This my prometheus.yml:
global:
scrape_interval: 5s
evaluation_interval: 5s
scrape_configs:
– job_name: linux
target_groups:
– targets: [‘localhost:9100’]
labels:
alias: db_linux
– job_name: mysql
target_groups:
– targets: [‘localhost:9104’]
labels:
alias: db_mysql
And Grafana shows red-box “Dashboard init failed Template variables could not be initialized: parse error at char 33: unexpected end of input inside braces” and there is no any graph on dashboards.
System info:
– CentOS 7, MariaDB 10.0.27
The latest dashboards do not require “alias” label. Also ensure you have run the Grafana patch. Take a look here https://github.com/percona/grafana-dashboards
After successfully starting Prometheus, Im getthing the stats of the target is down giving the error as MALFORMED HTTP CODE.
Yes right, even im getting this error:
Get http://localhost:9104/metrics: dial tcp [::1]:9104: getsockopt: connection refused
Hi , I have got everything working but for some reason dashboard shows the error highlighted in this link
https://github.com/grafana/grafana/issues/6293. It’s show cannot read property 1 of null.
I would suggesting installing PMM which has everything integrated and tested together
https://www.percona.com/software/database-tools/percona-monitoring-and-management
We apply some small patches to Grafana which may introduce incompatibility for unpatched version
Well no issues i just left the step column blank and it started populating graphs. Great Article. Thank You!!!
hello,
when i execute ./prometheus,there is no any output in ternimal
[root@SZTW-YSJ-CMS prometheus]# ./prometheus
[root@SZTW-YSJ-CMS prometheus]# lsof -i:9090
[root@SZTW-YSJ-CMS prometheus]#
my system version is centos6.4 x86-64
hi, thanks for your post first, but i come with a problem ,if i want to install many mysqld instances with different ports ,how can i to collect the different mysql performance data with the mysql_exporter ? may be need i to modify the mysql_exporter or run more than one mysql_exporters to send data ? thanks
You need to run 1 mysqld_exporter per mysqld instance.
Hi.
I have this set up working perfectly fine in aws environment but in verizon i face an issue read tcp 10.173.35.203:49640->10.173.35.180:9104: i/o timeout which shows up in prometheus status.
FYI i am able to curl the metrics from the host machine where prometheus is installed. Anybody any clue on this?
Hi,
First we have to download mysql and we have to create one database and then i am downloading mysqld-exporter and we have to configure docker compose file only these steps we have to do rite..
If i have to do more steps what steps i have to do?
After successfull installation, when open graffana i am not able to see any Dashboard.
Hi,
We recommend you using Percona Monitoring and Management for Monitoring MySQL with Prometheus and Grafana – it is much easy to set up than putting all the pieces together https://www.percona.com/software/database-tools/percona-monitoring-and-management
For difficulties with installation you can file Support case if you’re Percona’s customer or use Community Forum:
https://www.percona.com/forums/questions-discussions/percona-monitoring-and-management
Thank you for the tutorial!
I’ve done everything, and most of it works BUT it won’t show anything on the Prometheus status page. When i run node_exporter and mysqld_exporter they both say “Listen on: XXXX” instead of “starting node_exporter”/”starting server”. What should I do?
Thank you!
// Jenny