
 Parallel query execution is my favorite, non-existent, feature in MySQL. In all versions of MySQL – at least at the time of writing – when you run a single query it will run in one thread, effectively utilizing one CPU core only. Multiple queries run at the same time will be using different threads and will utilize more than one CPU core.
On multi-core machines – which is the majority of the hardware nowadays – and in the cloud, we have multiple cores available for use. With faster disks (i.e. SSD) we can’t utilize the full potential of IOPS with just one thread.
AWS Aurora (based on MySQL 5.6) now has a version which will support parallelism for SELECT queries (utilizing the read capacity of storage nodes underneath the Aurora cluster). In this article, we will look at how this can improve the reporting/analytical query performance in MySQL. I will compare AWS Aurora with MySQL (Percona Server) 5.6 running on an EC2 instance of the same class.
Aurora Parallel Query response time (for queries which can not use indexes) can be 5x-10x better compared to the non-parallel fully cached operations. This is a significant improvement for the slow queries.
For my test, I need to choose:
According to Jeff Barr’s excellent article (https://aws.amazon.com/blogs/aws/new-parallel-query-for-amazon-aurora/) the following instance classes will support parallel query (PQ):
“The instance class determines the number of parallel queries that can be active at a given time:
As I want to maximize the concurrency of parallel query sessions, I have chosen db.r4.8xlarge. For the EC2 instance I will use the same class: r4.8xlarge.
|
1 2 3 4 5 6 7 8 9 10 11 12 |
mysql> show global variables like '%version%'; +-------------------------+------------------------------+ | Variable_name | Value | +-------------------------+------------------------------+ | aurora_version | 1.18.0 | | innodb_version | 1.2.10 | | protocol_version | 10 | | version | 5.6.10 | | version_comment | MySQL Community Server (GPL) | | version_compile_machine | x86_64 | | version_compile_os | Linux | +-------------------------+------------------------------+ |
|
1 2 3 4 5 6 7 8 9 10 11 12 13 14 |
mysql> show global variables like '%version%'; +-------------------------+------------------------------------------------------+ | Variable_name | Value | +-------------------------+------------------------------------------------------+ | innodb_version | 5.6.41-84.1 | | protocol_version | 10 | | slave_type_conversions | | | tls_version | TLSv1.1,TLSv1.2 | | version | 5.6.41-84.1 | | version_comment | Percona Server (GPL), Release 84.1, Revision b308619 | | version_compile_machine | x86_64 | | version_compile_os | debian-linux-gnu | | version_suffix | | +-------------------------+------------------------------------------------------+ |
I’m using the “Airlines On-Time Performance” database from http://www.transtats.bts.gov/DL_SelectFields.asp?Table_ID=236&DB_Short_Name=On-Time (You can find the scripts I used here: https://github.com/Percona-Lab/ontime-airline-performance).
|
1 2 3 4 5 6 7 8 9 10 11 12 13 14 15 16 17 18 19 20 21 |
mysql> show table status like 'ontime'G *************************** 1. row *************************** Name: ontime Engine: InnoDB Version: 10 Row_format: Compact Rows: 173221661 Avg_row_length: 409 Data_length: 70850183168 Max_data_length: 0 Index_length: 0 Data_free: 7340032 Auto_increment: NULL Create_time: 2018-09-26 02:03:28 Update_time: NULL Check_time: NULL Collation: latin1_swedish_ci Checksum: NULL Create_options: Comment: 1 row in set (0.00 sec) |
The table is very wide, 84 columns.
Documentation: https://docs.aws.amazon.com/AmazonRDS/latest/AuroraUserGuide/aurora-mysql-parallel-query.html
Aurora PQ works by doing a full table scan (parallel reads are done on the storage level). The InnoDB buffer pool is not used when Parallel Query is utilized.
For the purposes of the test I turned PQ on and off (normally AWS Aurora uses its own heuristics to determine if the PQ will be helpful or not):
Turn on and force:
|
1 2 3 4 |
mysql> set session aurora_pq = 1; Query OK, 0 rows affected (0.00 sec) mysql> set aurora_pq_force = 1; Query OK, 0 rows affected (0.00 sec) |
Turn off:
|
1 2 |
mysql> set session aurora_pq = 0; Query OK, 0 rows affected (0.00 sec) |
The EXPLAIN plan in MySQL will also show the details about parallel query execution statistics.
Here, I use the “reporting” queries, running only one query at a time. The queries are similar to those I’ve used in older blog posts comparing MySQL and Apache Spark performance (https://www.percona.com/blog/2016/08/17/apache-spark-makes-slow-mysql-queries-10x-faster/ )
Here is a summary of the queries:
|
1 2 3 4 5 6 7 8 9 10 11 12 13 |
select SQL_CALC_FOUND_ROWS FlightDate, UniqueCarrier as carrier, FlightNum, Origin, Dest FROM ontime WHERE DestState not in ('AK', 'HI', 'PR', 'VI') and OriginState not in ('AK', 'HI', 'PR', 'VI') and flightdate > '2015-01-01' and ArrDelay < 15 and cancelled = 0 and Diverted = 0 and DivAirportLandings = 0 ORDER by DepDelay DESC LIMIT 10; |
3. Complex filter, join “reference” table
|
1 2 3 4 5 6 7 8 9 |
select SQL_CALC_FOUND_ROWS FlightDate, UniqueCarrier, TailNum, FlightNum, Origin, OriginCityName, Dest, DestCityName, DepDelay, ArrDelay FROM ontime_ind o JOIN carriers c on o.carrier = c.carrier_code WHERE (carrier_name like 'United%' or carrier_name like 'Delta%') and ArrDelay > 30 ORDER by DepDelay DESC LIMIT 10G |
4. select one row only, no index
Let’s take a look at the most simple query: count(*). This variant of the “ontime” table has no secondary indexes.
|
1 |
select count(*) from ontime where flightdate > '2017-01-01'; |
I disabled the PQ first to compare:
|
1 2 3 4 5 6 7 8 9 10 11 12 13 14 15 16 17 18 19 20 21 22 23 24 25 26 27 28 29 30 31 32 33 34 35 36 37 38 39 40 41 42 43 44 45 46 |
mysql> select count(*) from ontime where flightdate > '2017-01-01'; +----------+ | count(*) | +----------+ | 5660651 | +----------+ 1 row in set (8 min 25.49 sec) mysql> select count(*) from ontime where flightdate > '2017-01-01'; +----------+ | count(*) | +----------+ | 5660651 | +----------+ 1 row in set (2 min 48.81 sec) mysql> mysql> select count(*) from ontime where flightdate > '2017-01-01'; +----------+ | count(*) | +----------+ | 5660651 | +----------+ 1 row in set (2 min 48.25 sec) Please note: the first run was "cold run"; data was read from disk. The second and third run used the cached data. Now let's enable and force Aurora PQ: mysql> set session aurora_pq = 1; Query OK, 0 rows affected (0.00 sec) mysql> set aurora_pq_force = 1; Query OK, 0 rows affected (0.00 sec) mysql> explain select count(*) from ontime where flightdate > '2017-01-01'G *************************** 1. row *************************** id: 1 select_type: SIMPLE table: ontime type: ALL possible_keys: NULL key: NULL key_len: NULL ref: NULL rows: 173706586 Extra: Using where; Using parallel query (1 columns, 1 filters, 0 exprs; 0 extra) 1 row in set (0.00 sec) |
(from the EXPLAIN plan, we can see that parallel query is used).
Results:
|
1 2 3 4 5 6 7 8 9 10 11 12 13 14 15 16 17 18 19 20 21 22 23 24 25 26 27 28 29 30 31 32 33 34 35 36 37 38 39 |
mysql> select count(*) from ontime where flightdate > '2017-01-01'; +----------+ | count(*) | +----------+ | 5660651 | +----------+ 1 row in set (16.53 sec) mysql> select count(*) from ontime where flightdate > '2017-01-01'; +----------+ | count(*) | +----------+ | 5660651 | +----------+ 1 row in set (16.56 sec) mysql> select count(*) from ontime where flightdate > '2017-01-01'; +----------+ | count(*) | +----------+ | 5660651 | +----------+ 1 row in set (16.36 sec) mysql> select count(*) from ontime where flightdate > '2017-01-01'; +----------+ | count(*) | +----------+ | 5660651 | +----------+ 1 row in set (16.56 sec) mysql> select count(*) from ontime where flightdate > '2017-01-01'; +----------+ | count(*) | +----------+ | 5660651 | +----------+ 1 row in set (16.36 sec) |
As we can see the results are very stable. It does not use any cache (ie: innodb buffer pool) either. The result is also interesting: utilizing multiple threads (up to 16 threads) and reading data from disk (using disk cache, probably) can be ~10x faster compared to reading from memory in a single thread.
Result: ~10x performance gain, no index used
|
1 2 3 4 5 6 7 8 9 10 11 12 13 14 15 16 17 18 19 20 21 22 23 |
set aurora_pq = 1; set aurora_pq_force=1; select avg(DepDelay) from ontime; +---------------+ | avg(DepDelay) | +---------------+ | 8.2666 | +---------------+ 1 row in set (1 min 48.17 sec) set aurora_pq = 0; set aurora_pq_force=0; select avg(DepDelay) from ontime; +---------------+ | avg(DepDelay) | +---------------+ | 8.2666 | +---------------+ 1 row in set (2 min 49.95 sec) Here we can see that PQ gives use ~2x performance increase. |
Here is what we learned comparing Aurora PQ performance to native MySQL query execution:
The following query will always be slow in MySQL. This combination of the filters in the WHERE condition makes it extremely hard to prepare a good set of indexes to make this query faster.
|
1 2 3 4 5 6 7 8 9 10 11 12 13 |
select SQL_CALC_FOUND_ROWS FlightDate, UniqueCarrier as carrier, FlightNum, Origin, Dest FROM ontime WHERE DestState not in ('AK', 'HI', 'PR', 'VI') and OriginState not in ('AK', 'HI', 'PR', 'VI') and flightdate > '2015-01-01' and ArrDelay < 15 and cancelled = 0 and Diverted = 0 and DivAirportLandings = '0' ORDER by DepDelay DESC LIMIT 10; |
Let’s compare the query performance with and without PQ.
PQ disabled:
|
1 2 3 4 5 6 7 8 9 10 11 12 13 14 15 16 17 18 19 20 21 22 23 24 25 26 27 28 29 30 31 32 33 34 |
mysql> set aurora_pq_force = 0; Query OK, 0 rows affected (0.00 sec) mysql> set aurora_pq = 0; Query OK, 0 rows affected (0.00 sec) mysql> explain select SQL_CALC_FOUND_ROWS FlightDate, UniqueCarrier as carrier, FlightNum, Origin, Dest FROM ontime WHERE DestState not in ('AK', 'HI', 'PR', 'VI') and OriginState not in ('AK', 'HI', 'PR', 'VI') and flightdate > '2015-01-01' and ArrDelay < 15 and cancelled = 0 and Diverted = 0 and DivAirportLandings = 0 ORDER by DepDelay DESC LIMIT 10G *************************** 1. row *************************** id: 1 select_type: SIMPLE table: ontime type: ALL possible_keys: NULL key: NULL key_len: NULL ref: NULL rows: 173706586 Extra: Using where; Using filesort 1 row in set (0.00 sec) mysql> select SQL_CALC_FOUND_ROWS FlightDate, UniqueCarrier as carrier, FlightNum, Origin, Dest FROM ontime WHERE DestState not in ('AK', 'HI', 'PR', 'VI') and OriginState not in ('AK', 'HI', 'PR', 'VI') and flightdate > '2015-01-01' and ArrDelay < 15 and cancelled = 0 and Diverted = 0 and DivAirportLandings = 0 ORDER by DepDelay DESC LIMIT 10; +------------+---------+-----------+--------+------+ | FlightDate | carrier | FlightNum | Origin | Dest | +------------+---------+-----------+--------+------+ | 2017-10-09 | OO | 5028 | SBP | SFO | | 2015-11-03 | VX | 969 | SAN | SFO | | 2015-05-29 | VX | 720 | TUL | AUS | | 2016-03-11 | UA | 380 | SFO | BOS | | 2016-06-13 | DL | 2066 | JFK | SAN | | 2016-11-14 | UA | 1600 | EWR | LAX | | 2016-11-09 | WN | 2318 | BDL | LAS | | 2016-11-09 | UA | 1652 | IAD | LAX | | 2016-11-13 | AA | 23 | JFK | LAX | | 2016-11-12 | UA | 800 | EWR | SFO | +------------+---------+-----------+--------+------+ |
10 rows in set (3 min 42.47 sec)
/* another run */
10 rows in set (3 min 46.90 sec)
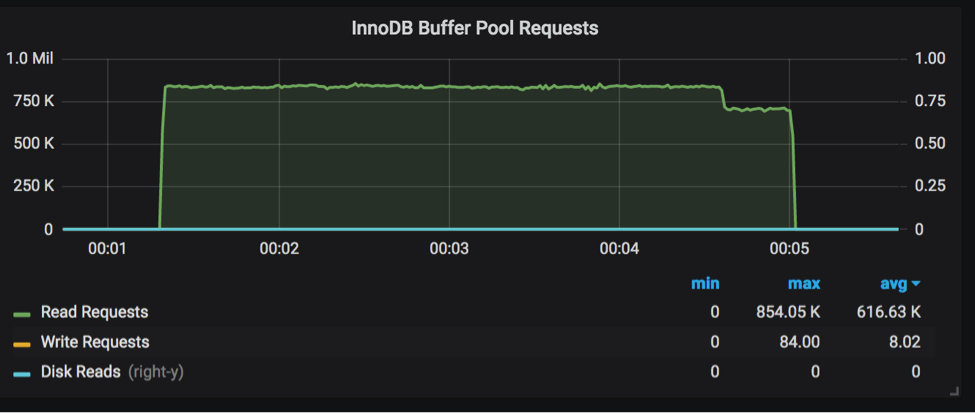
This query is 100% cached. Here is the graph from PMM showing the number of read requests:
Buffer pool requests:
Now let’s enable and force PQ:
|
1 2 3 4 5 6 7 8 9 10 11 12 13 14 15 16 17 18 19 20 21 22 23 24 25 26 27 28 29 30 31 32 33 34 35 36 37 38 39 40 41 42 43 44 45 46 47 48 49 50 |
mysql> set session aurora_pq = 1; Query OK, 0 rows affected (0.00 sec) mysql> set aurora_pq_force = 1; Query OK, 0 rows affected (0.00 sec) mysql> explain select SQL_CALC_FOUND_ROWS FlightDate, UniqueCarrier as carrier, FlightNum, Origin, Dest FROM ontime WHERE DestState not in ('AK', 'HI', 'PR', 'VI') and OriginState not in ('AK', 'HI', 'PR', 'VI') and flightdate > '2015-01-01' and ArrDelay < 15 and cancelled = 0 and Diverted = 0 and DivAirportLandings = 0 ORDER by DepDelay DESC LIMIT 10G *************************** 1. row *************************** id: 1 select_type: SIMPLE table: ontime type: ALL possible_keys: NULL key: NULL key_len: NULL ref: NULL rows: 173706586 Extra: Using where; Using filesort; Using parallel query (12 columns, 4 filters, 3 exprs; 0 extra) 1 row in set (0.00 sec) mysql> select SQL_CALC_FOUND_ROWS -> FlightDate, UniqueCarrier as carrier, FlightNum, Origin, Dest -> FROM ontime -> WHERE -> DestState not in ('AK', 'HI', 'PR', 'VI') -> and OriginState not in ('AK', 'HI', 'PR', 'VI') -> and flightdate > '2015-01-01' -> and ArrDelay < 15 -> and cancelled = 0 -> and Diverted = 0 -> and DivAirportLandings = 0 -> ORDER by DepDelay DESC -> LIMIT 10; +------------+---------+-----------+--------+------+ | FlightDate | carrier | FlightNum | Origin | Dest | +------------+---------+-----------+--------+------+ | 2017-10-09 | OO | 5028 | SBP | SFO | | 2015-11-03 | VX | 969 | SAN | SFO | | 2015-05-29 | VX | 720 | TUL | AUS | | 2016-03-11 | UA | 380 | SFO | BOS | | 2016-06-13 | DL | 2066 | JFK | SAN | | 2016-11-14 | UA | 1600 | EWR | LAX | | 2016-11-09 | WN | 2318 | BDL | LAS | | 2016-11-09 | UA | 1652 | IAD | LAX | | 2016-11-13 | AA | 23 | JFK | LAX | | 2016-11-12 | UA | 800 | EWR | SFO | +------------+---------+-----------+--------+------+ 10 rows in set (41.88 sec) /* run 2 */ 10 rows in set (28.49 sec) /* run 3 */ 10 rows in set (29.60 sec) |
Now let’s compare the requests:
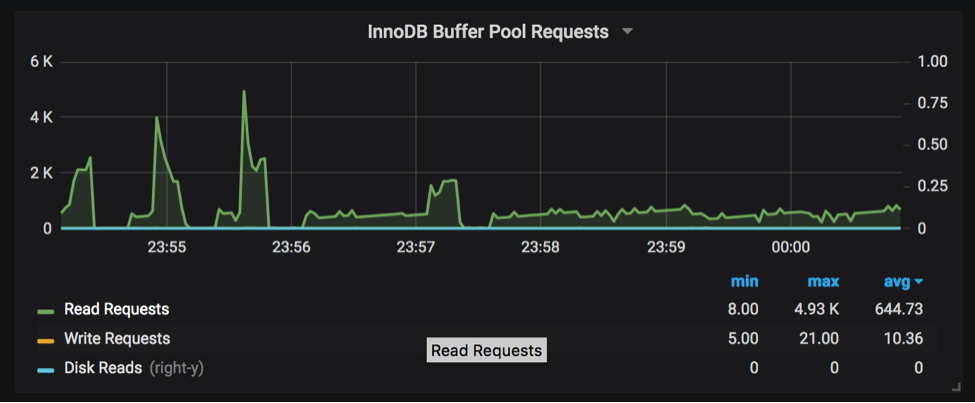
As we can see, Aurora PQ is almost NOT utilizing the buffer pool (there are a minor number of read requests. Compare the max of 4K requests per second with PQ to the constant 600K requests per second in the previous graph).
Result: ~8x performance gain
In this example I join two tables: the main “ontime” table and a reference table. If we have both tables without indexes it will simply be too slow in MySQL. To make it better, I have created an index for both tables and so it will use indexes for the join:
|
1 2 3 4 5 6 7 8 9 10 11 12 13 |
CREATE TABLE `carriers` ( `carrier_code` varchar(8) NOT NULL DEFAULT '', `carrier_name` varchar(200) DEFAULT NULL, PRIMARY KEY (`carrier_code`), KEY `carrier_name` (`carrier_name`) ) ENGINE=InnoDB DEFAULT CHARSET=latin1 mysql> show create table ontime_indG ... PRIMARY KEY (`id`), KEY `comb1` (`Carrier`,`Year`,`ArrDelayMinutes`), KEY `FlightDate` (`FlightDate`) ) ENGINE=InnoDB AUTO_INCREMENT=178116912 DEFAULT CHARSET=latin1 |
Query:
|
1 2 3 4 5 6 7 8 9 |
select SQL_CALC_FOUND_ROWS FlightDate, UniqueCarrier, TailNum, FlightNum, Origin, OriginCityName, Dest, DestCityName, DepDelay, ArrDelay FROM ontime_ind o JOIN carriers c on o.carrier = c.carrier_code WHERE (carrier_name like 'United%' or carrier_name like 'Delta%') and ArrDelay > 30 ORDER by DepDelay DESC LIMIT 10G |
PQ disabled, explain plan:
|
1 2 3 4 5 6 7 8 9 10 11 12 13 14 15 16 17 18 19 20 21 22 23 24 25 26 27 28 29 30 31 32 33 34 35 36 37 38 39 |
mysql> set aurora_pq_force = 0; Query OK, 0 rows affected (0.00 sec) mysql> set aurora_pq = 0; Query OK, 0 rows affected (0.00 sec) mysql> explain -> select SQL_CALC_FOUND_ROWS -> FlightDate, UniqueCarrier, TailNum, FlightNum, Origin, OriginCityName, Dest, DestCityName, DepDelay, ArrDelay -> FROM ontime_ind o -> JOIN carriers c on o.carrier = c.carrier_code -> WHERE -> (carrier_name like 'United%' or carrier_name like 'Delta%') -> and ArrDelay > 30 -> ORDER by DepDelay DESC -> LIMIT 10G *************************** 1. row *************************** id: 1 select_type: SIMPLE table: c type: range possible_keys: PRIMARY,carrier_name key: carrier_name key_len: 203 ref: NULL rows: 3 Extra: Using where; Using index; Using temporary; Using filesort *************************** 2. row *************************** id: 1 select_type: SIMPLE table: o type: ref possible_keys: comb1 key: comb1 key_len: 3 ref: ontime.c.carrier_code rows: 2711597 Extra: Using index condition; Using where 2 rows in set (0.01 sec) |
As we can see MySQL uses indexes for the join. Response times:
/* run 1 – cold run */
10 rows in set (29 min 17.39 sec)
/* run 2 – warm run */
10 rows in set (2 min 45.16 sec)
PQ enabled, explain plan:
|
1 2 3 4 5 6 7 8 9 10 11 12 13 14 15 16 17 18 19 20 21 22 23 24 25 26 27 28 29 30 31 32 33 |
mysql> explain -> select SQL_CALC_FOUND_ROWS -> FlightDate, UniqueCarrier, TailNum, FlightNum, Origin, OriginCityName, Dest, DestCityName, DepDelay, ArrDelay -> FROM ontime_ind o -> JOIN carriers c on o.carrier = c.carrier_code -> WHERE -> (carrier_name like 'United%' or carrier_name like 'Delta%') -> and ArrDelay > 30 -> ORDER by DepDelay DESC -> LIMIT 10G *************************** 1. row *************************** id: 1 select_type: SIMPLE table: c type: ALL possible_keys: PRIMARY,carrier_name key: NULL key_len: NULL ref: NULL rows: 1650 Extra: Using where; Using temporary; Using filesort; Using parallel query (2 columns, 0 filters, 1 exprs; 0 extra) *************************** 2. row *************************** id: 1 select_type: SIMPLE table: o type: ALL possible_keys: comb1 key: NULL key_len: NULL ref: NULL rows: 173542245 Extra: Using where; Using join buffer (Hash Join Outer table o); Using parallel query (11 columns, 1 filters, 1 exprs; 0 extra) 2 rows in set (0.00 sec) |
As we can see, Aurora does not use any indexes and uses a parallel scan instead.
Response time:
|
1 2 3 4 5 6 7 8 9 10 11 12 13 14 15 16 17 18 19 20 21 22 23 24 25 26 27 28 29 30 31 32 33 34 35 36 37 38 39 40 41 42 43 44 45 46 |
mysql> select SQL_CALC_FOUND_ROWS -> FlightDate, UniqueCarrier, TailNum, FlightNum, Origin, OriginCityName, Dest, DestCityName, DepDelay, ArrDelay -> FROM ontime_ind o -> JOIN carriers c on o.carrier = c.carrier_code -> WHERE -> (carrier_name like 'United%' or carrier_name like 'Delta%') -> and ArrDelay > 30 -> ORDER by DepDelay DESC -> LIMIT 10G ... *************************** 4. row *************************** FlightDate: 2017-05-04 UniqueCarrier: UA TailNum: N68821 FlightNum: 1205 Origin: KOA OriginCityName: Kona, HI Dest: LAX DestCityName: Los Angeles, CA DepDelay: 1457 ArrDelay: 1459 *************************** 5. row *************************** FlightDate: 1991-03-12 UniqueCarrier: DL TailNum: FlightNum: 1118 Origin: ATL OriginCityName: Atlanta, GA Dest: STL DestCityName: St. Louis, MO ... 10 rows in set (28.78 sec) mysql> select found_rows(); +--------------+ | found_rows() | +--------------+ | 4180974 | +--------------+ 1 row in set (0.00 sec) |
Result: ~5x performance gain
(this is actually comparing the index cached read to a non-index PQ execution)
Aurora PQ can significantly improve the performance of reporting queries as such queries may be extremely hard to optimize in MySQL, even when using indexes. With indexes, Aurora PQ response time can be 5x-10x better compared to the non-parallel, fully cached operations. Aurora PQ can help improve performance of complex queries by performing parallel reads.
The following table summarizes the query response times:
| Query | Time, No PQ, index | Time, PQ |
| select count(*) from ontime where flightdate > ‘2017-01-01’ | 2 min 48.81 sec | 16.53 sec |
| select avg(DepDelay) from ontime; | 2 min 49.95 sec | 1 min 48.17 sec |
| select SQL_CALC_FOUND_ROWS
FlightDate, UniqueCarrier as carrier, FlightNum, Origin, Dest FROM ontime WHERE DestState not in (‘AK’, ‘HI’, ‘PR’, ‘VI’) and OriginState not in (‘AK’, ‘HI’, ‘PR’, ‘VI’) and flightdate > ‘2015-01-01’ and ArrDelay < 15 and cancelled = 0 and Diverted = 0 and DivAirportLandings = 0 ORDER by DepDelay DESC LIMIT 10; |
3 min 42.47 sec | 28.49 sec |
| select SQL_CALC_FOUND_ROWS
FlightDate, UniqueCarrier, TailNum, FlightNum, Origin, OriginCityName, Dest, DestCityName, DepDelay, ArrDelay FROM ontime_ind o JOIN carriers c on o.carrier = c.carrier_code WHERE (carrier_name like ‘United%’ or carrier_name like ‘Delta%’) and ArrDelay > 30 ORDER by DepDelay DESC LIMIT 10G |
2 min 45.16 sec | 28.78 sec |
—
Photo by Thomas Lipke on Unsplash
Resources
RELATED POSTS


Thanks
How does Aurora parallel query compare to MySQL for queries that index well? The above comparison sounds like it is skewed since it is focusing on non indexable queries. Perhaps I am missing something. Perhaps APQ is not appropriate for well indexed queries.
Hi,
I’m looking for some parallel ddl way in order to create indexes or do several operations (DDL) on our tables located on AURORA MYSQL. Do you have any documentation about that?
thank you
hi Cesar,
am looking for same.. did you find any solution for ddl in parallel.. particularly creating foreign keys.