

We ran DuckDB MySQL storage engine at scale factor 500. It is around 500 GB of raw TPC-H, three billion lineitem rows on an 80-core server with 187 GB of RAM. Three engines on the same box: InnoDB, our MySQL+DuckDB engine, and plain DuckDB as the reference.
Here is what came out. InnoDB finished 18 of the 22 queries and spent more than 28 hours of query time on them. Four never finished. Our engine ran all 22 in about three minutes. It loaded the data 25 times faster than InnoDB, and it used 5 times less disk. On the queries it stays close to plain DuckDB, and on a few it is ahead.
It’s still an experiment, not production software. Code and the benchmark harness are on GitHub under GPLv2: https://github.com/Percona-Lab/ducksdb-mysql-engine.
Two details about how we ran it change how the numbers read.
The load streams. We generate a chunk of CSV, load it, delete it, then generate the next one. So the disk never holds more than one 20 GB chunk, which is the only reason 500 GB fits on the box at all.
And “native DuckDB” is not a second copy of the data. It opens the engine’s own DuckDB file read-only and queries that. Same bytes on both sides. That keeps the comparison honest, and it means there is no separate native load time to report.
| Engine | Load time |
|---|---|
| ENGINE=DuckDB (COPY fast path) | 36m 05s |
| InnoDB (bulk LOAD DATA) | 15h 21m |
InnoDB took 25.5 times longer. The engine hands LOAD DATA straight to a DuckDB COPY instead of going row by row through the handler, so the three billion lineitem rows go in in about nineteen minutes, and the whole set in thirty-six. InnoDB inserts row by row and builds the primary key as it goes. That is where the rest of the fifteen hours goes.
| Component | Size | vs raw CSV |
|---|---|---|
| raw TPC-H CSV | 500.0 GB | 100% |
| ENGINE=DuckDB (tpch.duckdb) | 132.4 GB | 26% (3.78x smaller) |
| InnoDB (tpch/*.ibd) | 673.2 GB | 135% |
DuckDB stores columns and compresses them, so 500 GB of CSV comes down to 132 GB. InnoDB stores rows and carries the index with them, and it ends up bigger than the CSV it came from: 673 GB, five times the DuckDB file. The InnoDB lineitem.ibd on its own is 446 GB. That is more than three times our entire database.
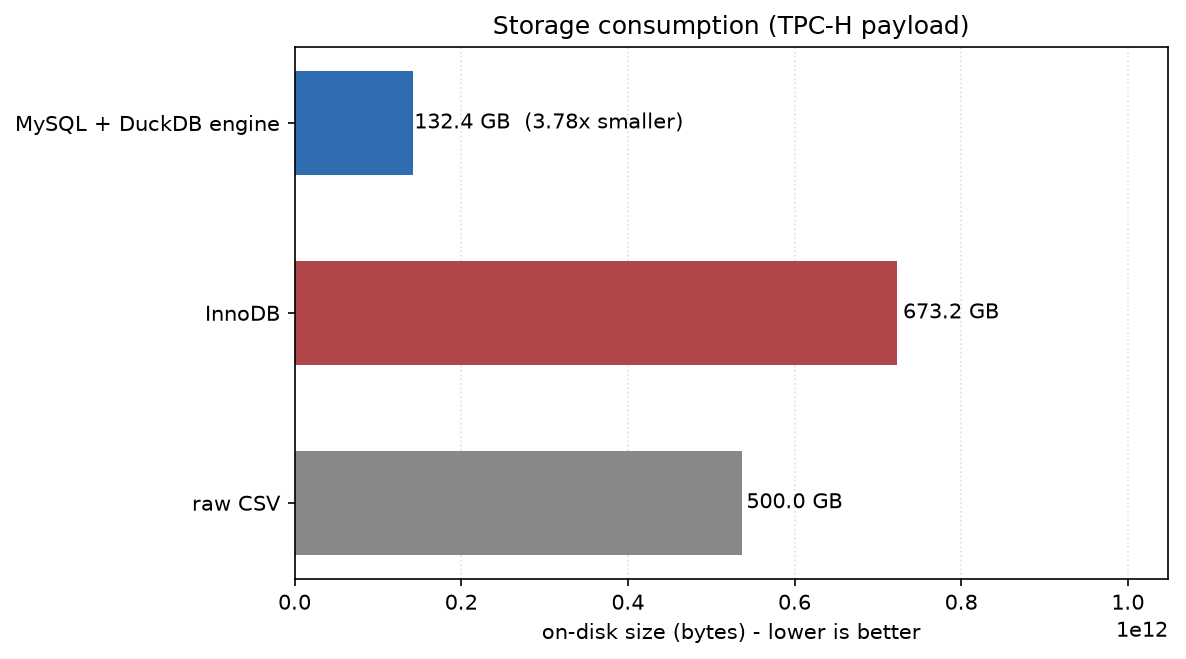
Storage, lower is better. The DuckDB engine holds all of SF500 in 132 GB.
All 22 queries. Warm runs, minimum of a few, in seconds. InnoDB had a two-hour cap per query; the ones that hit it are marked DNF.
| Query | InnoDB | MySQL+DuckDB (ours) | native DuckDB |
|---|---|---|---|
| Q1 | 11864.5 | 11.1 | 5.2 |
| Q6 | 3539.4 | 1.3 | 4.1 |
| Q9 | DNF | 17.1 | 18.1 |
| Q13 | DNF | 17.1 | 10.4 |
| Q18 | 3846.1 | 27.0 | 11.9 |
| Q19 | 6672.3 | 2.4 | 8.6 |
| Q21 | 14211.7 | 26.0 | 15.1 |
| All 22 | 18/22 finished, ~28 h | 185.6 s | 152.7 s |
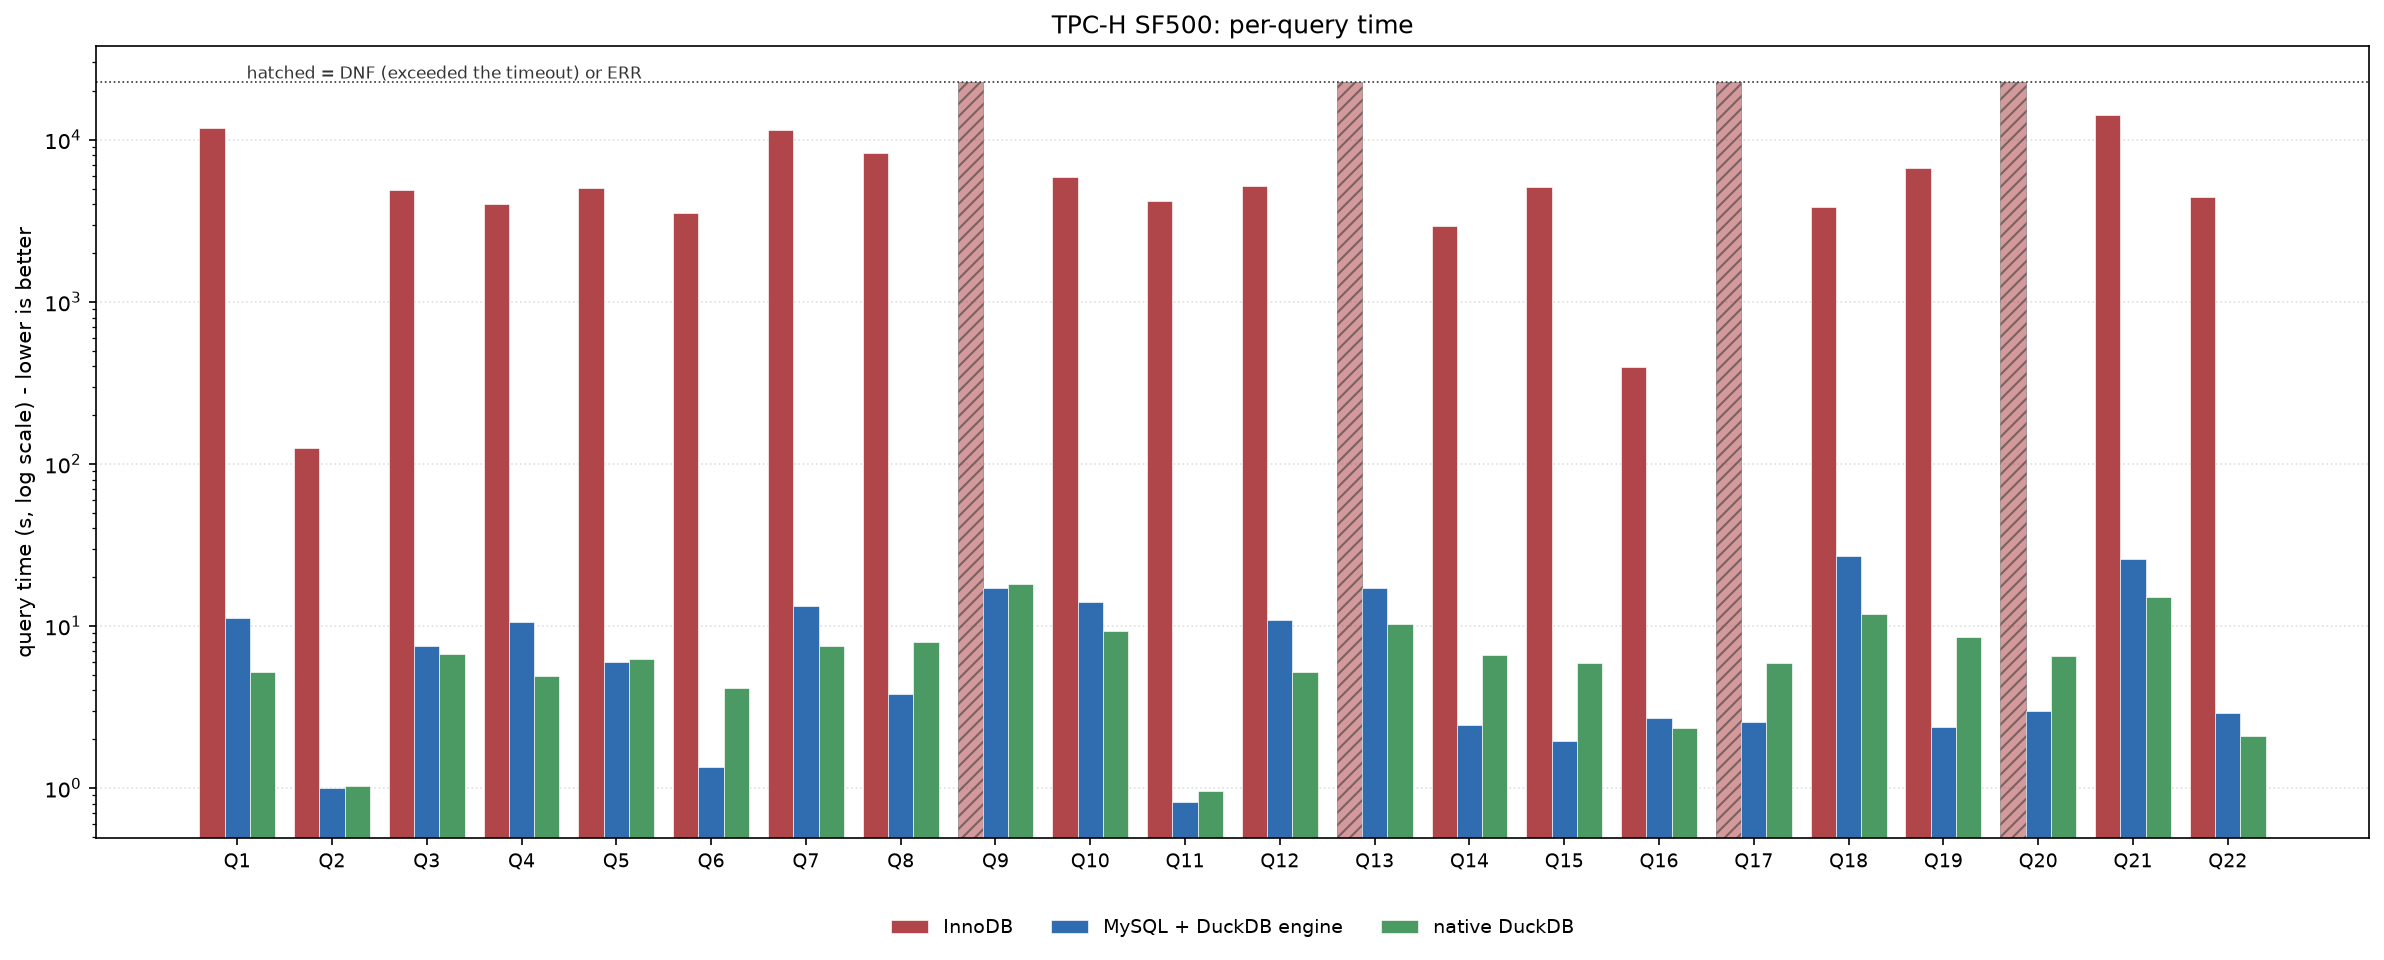
SF500, all 22 queries, log scale, lower is better. Hatched InnoDB bars did not finish inside the cap.
Two things to take from this.
InnoDB is far behind, which is no surprise. Scanning three billion rows for a wide GROUP BY or a six-way join is the wrong job for a row store. Four queries (Q9, Q13, Q17, Q20) did not finish at all, and the eighteen that did add up to more than 28 hours. This is the exact problem the engine is for. It is not a mark against InnoDB, which is doing the transactional job it was built for.
The comparison worth reading is our engine against plain DuckDB, since both are the same DuckDB reading the same file. Over all 22 they are close: 186 seconds for ours, 153 for native. Query by query it goes both ways. On the selective ones ours is often faster — Q6 (1.3 vs 4.1), Q19 (2.4 vs 8.6), Q17, Q20. On the biggest joins native wins — Q18 (27 vs 12), Q21, Q1. That gap comes from settings, not data: the memory limit, the thread count, and running inside mysqld versus a bare CLI. Either way, both are around a thousand times faster than the row store.
We checked the answers, not only the clock. For every query we compared our engine’s output to native DuckDB’s, numbers rounded to four decimals and the order ignored. 21 of 22 matched exactly. None mismatched. One was skipped because a result file came back empty on one side. So the engine gives the same answers as plain DuckDB.
At 500 GB the small-scale picture holds and gets sharper. Analytical queries that took hours on InnoDB, or never finished, come back in seconds on the DuckDB engine. The load is far quicker, and the footprint is far smaller. All of it inside one MySQL server, with the tables queried the normal way.
The limits are the same as before:
Pull the image and run your own queries:
docker run -d -p 3306:3306 -e MYSQL_ROOT_PASSWORD=secret \
perconalab/ducksdb-mysql-engine:latest
The engine, the patches, and the harness that produced these numbers are on GitHub: https://github.com/Percona-Lab/ducksdb-mysql-engine. The per-query numbers and the method are in the repo. If it breaks, or your hardware gives different numbers, open an issue.
Resources
RELATED POSTS





I’m going to give running this a shot — mostly out of data loading time curiosity. I recently did a demo of loading 100m rows with 16 columns in just under 3s — which would be 30s for 3 billion rows scaled linearly.
I’m not sure where the linear scaling stops, but in the past year of using duckDB, anything under 4GB from a tsv loads too fast to care!