
This investigation began as a performance comparison for different memory allocators. However, during benchmarking, I discovered unexpected effects deserving a more detailed explanation. I hope you find these findings both interesting and useful.
Imagine you need to set up a MySQL database server. Every detail is planned: the operating system, the CPU architecture, the number of cores, the amount of RAM, the storage capacity and speed. On paper the hardware looks like it can handle the workload. But in reality, things rarely go exactly as planned. So, conducting a thorough stress test is the next thing to do.
You configure your MySQL server setting the innodb_buffer_pool_size to 70-80% of your available RAM. This creates a large fast buffer for your data and indexes, reducing the need for slower disk input/output.
After a warmup period and a few hours of testing, everything looks great. The server is working at a steady pace, performance is stable. You tick the box – the server has passed the basic stress test. Thinking everything is fine, you consider leaving the test running over the weekend, expecting only minor fluctuations in performance.
However, when you check the status the next morning, you find that the CPU is idle and the mysqld process has vanished. Did it crash? You check the server error logs, but there is no record of a crash or a shutdown—not even a core dump. Then, you look at the system logs and find something unexpected:
|
1 2 3 4 5 |
journalctl -k -g mysqld Jun 09 07:29:14 beast-node7.tp.int.percona.com kernel: Out of memory: Killed process 3936620 (mysqld) total-vm:194627592kB, anon-rss:183047480kB, file-rss:640kB, shmem-rss:0kB, UID:955676158 pgtables:355860kB oom_score_adj:0 |
It appears that mysqld ran out of memory and was terminated by the OOM (Out of Memory) killer after running for about 16 hours.
We will focus on Resident Set Size (RSS), which is the subset of Virtual Memory Size (VSZ). RSS is the most significant part of VSZ and other parts like swap (only 8Gb) do not make notable contributions.
The RSS reached 183GiB, significantly higher than the initial 145GiB (with the innodb_buffer_pool_size set to 135G). The mysqld process had grabbed nearly 40GiB of extra memory, which at first looked like a memory leak. I ran my stress tests on different versions of MySQL and Percona Server and found a recurring pattern: memory usage climbed steadily until the system killed the process.
I won’t dive into the leak diagnosis here, but the result was clear: mysqld wasn’t leaking memory in the traditional sense. However, we still had to explain that 40GiB growth.
The configuration was as follows:
| Benchmark | TPC-C via HammerDB 6.0 |
| CPU | Intel Xeon Gold 6230 (2×20 cores, HT = 80 logical CPUs) |
| RAM | 187 GiB DDR4 |
| Storage | NVMe SSD (2.9 TB) INTEL SSDPE2KE032T8 |
| OS | Ubuntu 24.04, kernel 6.8.0-60-generic |
| DB Engines | Percona Server 8.4.8-8 (release build) Percona Server 8.4.9-9 (internal build, unreleased)Percona Server 9.7.0 (internal build, unreleased) |
The testing was done as follows:
| Workload | 3000 warehouses (~300 GB data) |
| Timing | 15 min ramp-up, 20 hours measurement window |
| Connections | 80 Virtual Users (to match the number of logical CPU cores). Connection lifetime is set for the entire duration of the test. |
| InnoDB buffer sweep | Starting from 150G down to 80G with 5G decrease |
What we wanted to achieve:
Servers configuration file:
|
1 2 3 4 5 6 7 8 9 10 11 12 13 14 15 16 17 18 19 20 21 22 23 24 25 26 27 28 29 30 31 32 33 34 35 36 37 38 39 40 41 42 43 44 45 46 47 48 49 50 51 |
# Make sure data dir is on NVMe datadir=/nvme/data # Thread Pool is enabled only for Percona Server plugin-load-add=thread_pool.so thread_pool_size=16 thread_pool_max_threads=5000 thread_pool_stall_limit=500 # Disable binary logging skip-log-bin # Connection settings max_connections = 200 # Logging log-error = /home/bogdan.degtyariov/servers/data/mysql-error.log pid-file = /home/bogdan.degtyariov/servers/data/mysql.pid # Socket socket = /tmp/mysql-alloc-test.sock # Disable SSL requirement require_secure_transport = OFF # Other settings sql_mode = "" wait_timeout = 288000 # 80 hours interactive_timeout = 288000 # 80 hours # Table settings default-storage-engine = InnoDB # InnoDB redo log configuration innodb_redo_log_capacity = 32G # Minimize flush overhead (not crash-safe, but optimal for testing) innodb_flush_log_at_trx_commit = 0 # Memory configuration innodb_buffer_pool_size = 150G # Configurable down to 80G innodb_buffer_pool_instances = 16 innodb_io_capacity = 20000 # Performance optimizations innodb_flush_method = O_DIRECT innodb_log_buffer_size = 256M innodb_doublewrite = OFF # Transparent Huge Pages can be turned ON or OFF for the testing large-pages = ON |
Memory management is complex, so let’s simplify. Applications rarely talk directly to the Linux kernel because the kernel typically works in 4KB pages, which is inefficient for developers. Instead, applications use allocators like glibc malloc, jemalloc, or tcmalloc. These tools handle memory operations by minimizing overhead, managing bookkeeping, and preventing fragmentation. Most importantly, they use caching.
When a program frees memory, the allocator rarely returns it to the OS immediately. Instead, it moves that memory into an internal “free-list” cache. Reusing memory from this cache is much faster than requesting new memory from the kernel.
Also, the Percona Server for MySQL and upstream MySQL Server use their own implementation of the memory arena allocator called MEM_ROOT. Historically MEM_ROT was architected decades ago when the standard Linux implementation of glibc memory allocator was slow and prone to lock contention in multithreaded programs.
Enabling memory profiling revealed that MEM_ROOT allocations for cursor metadata in stored routines was responsible for most of the additional memory acquired by the server process:
|
1 2 3 4 5 6 7 |
sp_head::execute_procedure (TPC-C stored procedure) └─ sp_instr_copen::execute (OPEN <cursor> statement) └─ sp_cursor::open └─ mysql_open_cursor ├─ Materialized_cursor::send_result_set_metadata 87831 MB (94.3%) └─ Query_result_materialize::start_execution 5311 MB (5.7%) └─ MEM_ROOT::Alloc / AllocBlock / ForceNewBlock |
NOTE: 87G is a significant growth of memory allocation considering that in that run the server initially allocated ~85G with Innodb_buffer_pool_size=80G.
The problem happens regardless of the data size because the actual issue is in stored routines cursor metadata. When the stored procedure is called the memory allocated for cursor metadata is not freed. Over the course of many repeated calls to the same stored procedure the cumulative amount of memory for the cursor can reach any value.
The following graph demonstrates the memory growth in Percona Server 8.4.8-8 from ~80G to over ~180G in RSS and over 200G VSZ over the period of 24 hours.
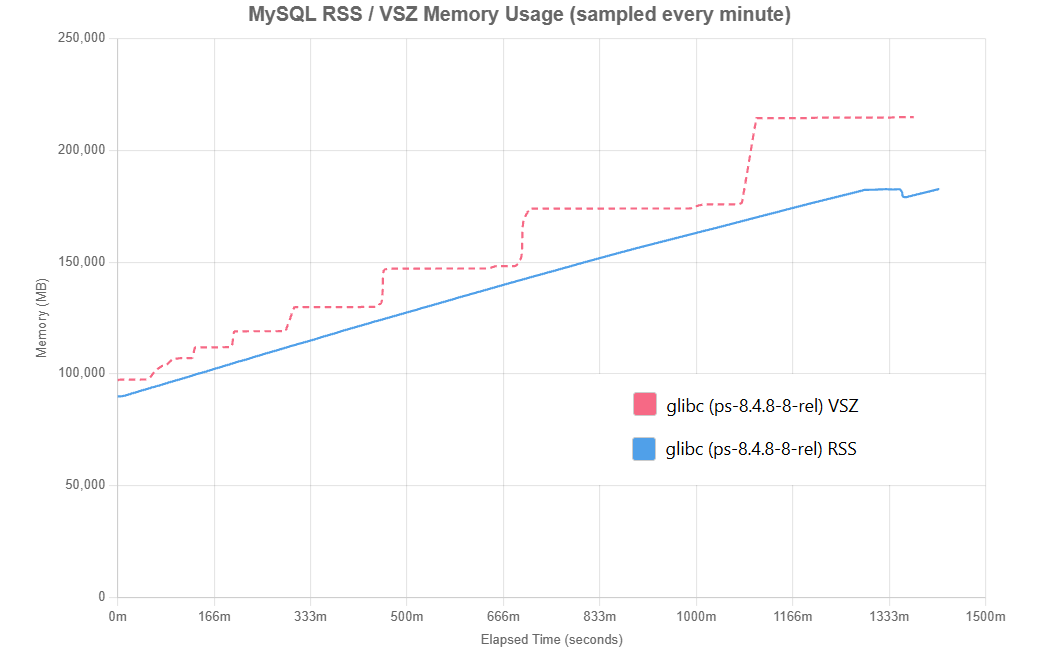
Thus, a bug was reported for Percona Server: https://perconadev.atlassian.net/browse/PS-11472
With Percona Server for MySQL 9.7.0-1 the RSS/VSZ growth was at a slower rate, but still noticeable and it was not flattening towards a stable horizontal line (the server was configured with a small amount of memory for innodb_buffer_pool_size=4G and run for 5 hours instead of 20).
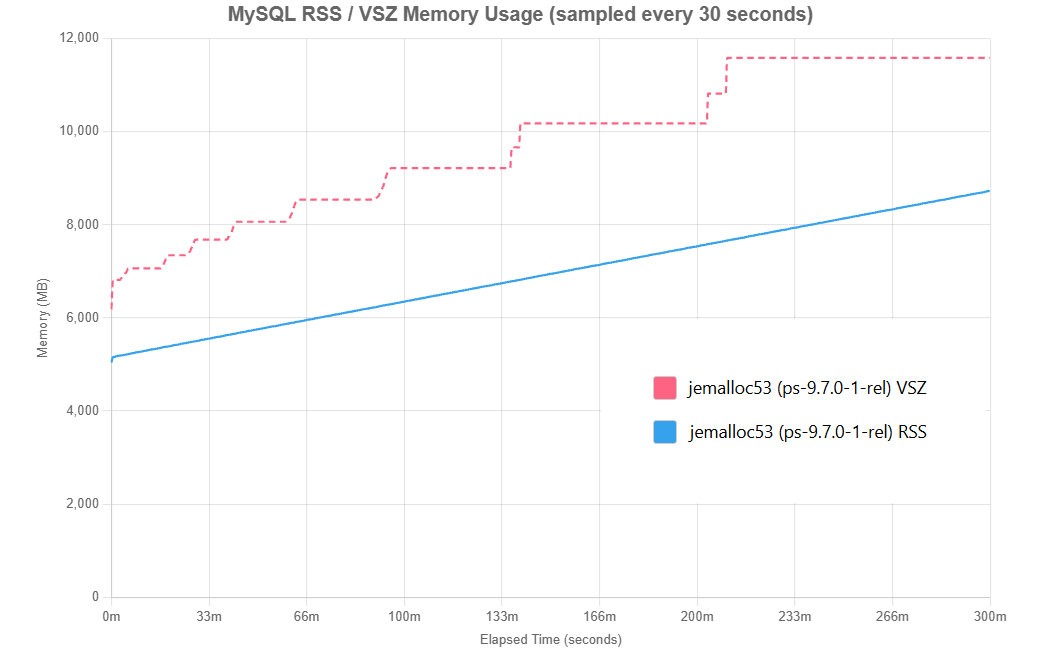
Memory profiling showed the new allocations in version 9.7.0-1 were in the same place where cursor metadata is handled:
|
1 2 3 4 5 6 7 |
sp_head::execute_procedure (TPC-C stored procedure) └─ sp_instr_copen::execute (OPEN <cursor> statement) └─ sp_cursor::open └─ mysql_open_cursor ├─ Materialized_cursor::send_result_set_metadata └─ Query_result_materialize::start_execution └─ MEM_ROOT::Alloc / AllocBlock / ForceNewBlock 4,025.8 MB (99.6%) |
My tests showed that OOM crashes happened consistently under two specific conditions:,
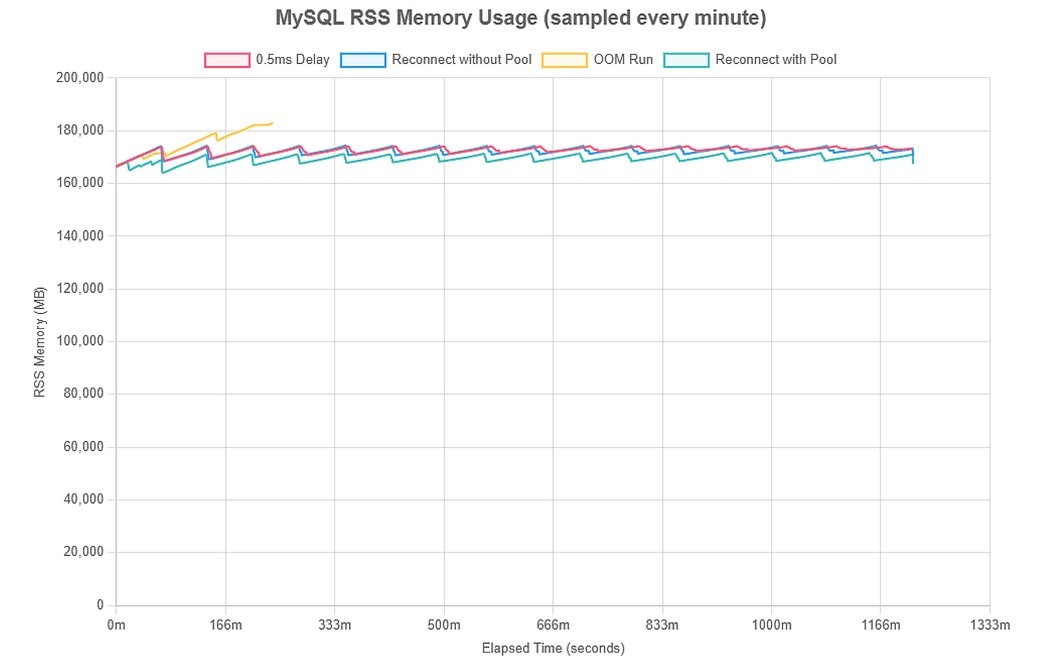
Also, when the connection lifetime was limited and users were made to close connection and reconnect after 1M transactions, the memory exhaustion stopped, and memory was freed correctly – all with only a minor impact on performance. To minimize the delays associated with creating a new connection thread on the server I used the connection pool functionality in HammerDB. When the connection lifetime is ended, the actual connection is not closed, but “reset” and reused. This frees the context accumulated during the connection activity and stimulates returning memory to the OS. This connection pool mechanism is more efficient than the open/close cycle for maintaining the connection lifetime.
I had two runs with reconnecting users: with and without connection pool. The graph demonstrates that using the pool improves the performance in this test.
Also, during another experiment with unlimited connection lifetime, adding a 0.5ms pause after a few transactions prevented the crashes, though performance dropped slightly more.
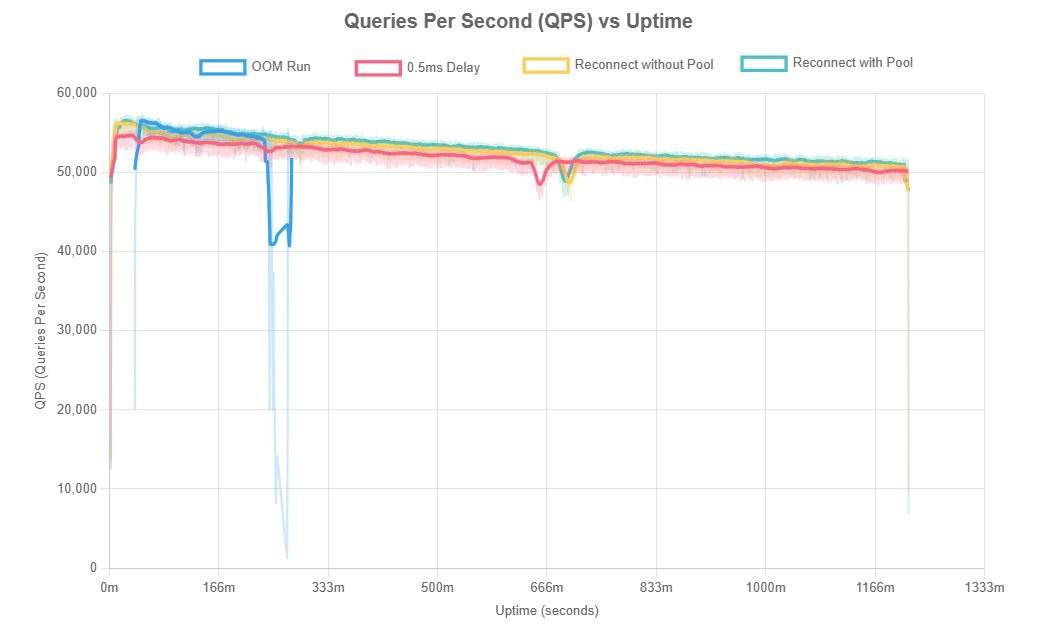
The memory graphs have consistent periodic oscillations that never reach into the dangerous zone.
To sum it up: the observed MySQL’s memory bloating is caused by a problem in the server cursor implementation not freeing metadata memory.
Under heavy, constant load, that memory accumulates to the amount which eventually causes an OOM crash. Capping how long connections stay active or adding a short pause between transactions, gives the server time to clean itself up. Normally the client side processing adds such pauses without need to do it on purpose.
Finally, it is important to remember that the best benchmark results do not always guarantee the best real-life performance.
Resources
RELATED POSTS