 Percona announces the release of Percona Monitoring and Management 1.7.0. (PMM ) is a free and open-source platform for managing and monitoring MySQL and MongoDB performance. You can run PMM in your own environment for maximum security and reliability. It provides thorough time-based analysis for MySQL and MongoDB servers to ensure that your data works as efficiently as possible.
This release features improved support for external services, which enables a PMM Server to store and display metrics for any available Prometheus exporter. For example, you could deploy the postgres_exporter and use PMM’s external services feature to store PostgreSQL metrics in PMM. Immediately, you’ll see these new metrics in the Advanced Data Exploration dashboard. Then you could leverage many of the pre-developed PostgreSQL dashboards available on Grafana.com, and with a minimal amount of edits have a working PostgreSQL dashboard in PMM! Watch for an upcoming blog post to demonstrate a walk-through of this unlocked functionality.
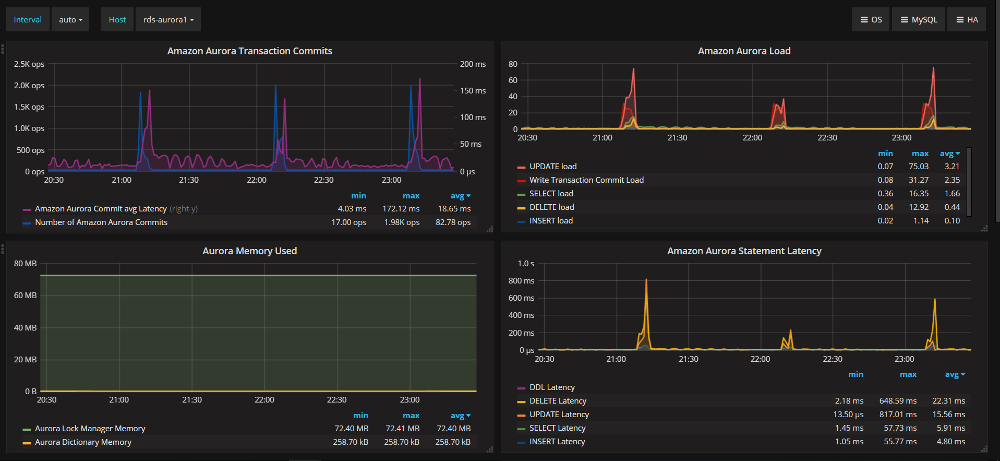
PMM-1949: New dashboard: MySQL Amazon Aurora Metrics.