
In Part 1 we ran analytical reports in DuckDB on a DBTrail copy instead of on MySQL. This time I want to look at a different question: what if the application does not need to know the copy exists?
Most MySQL servers have a few queries that make someone wait. The monthly report that aggregates a whole table. Page 5,000 of a sorted list. The screen that reads years of history. MySQL is built for many small reads and writes, and these queries are a different kind of work.
So what happens to them with DBTrail next to the server? The same 14 reports ran for a day on a Percona Server for MySQL replica and on the copy of the same database that DBTrail keeps.
Short answer: twelve were faster on the copy, and the slowest went from 225 seconds to 7.94 seconds.
Not everything got faster, though. The two lightest reports were faster on Percona Server: one takes 4.0 ms there and 103 ms on the copy. Both sides ran the same SQL.
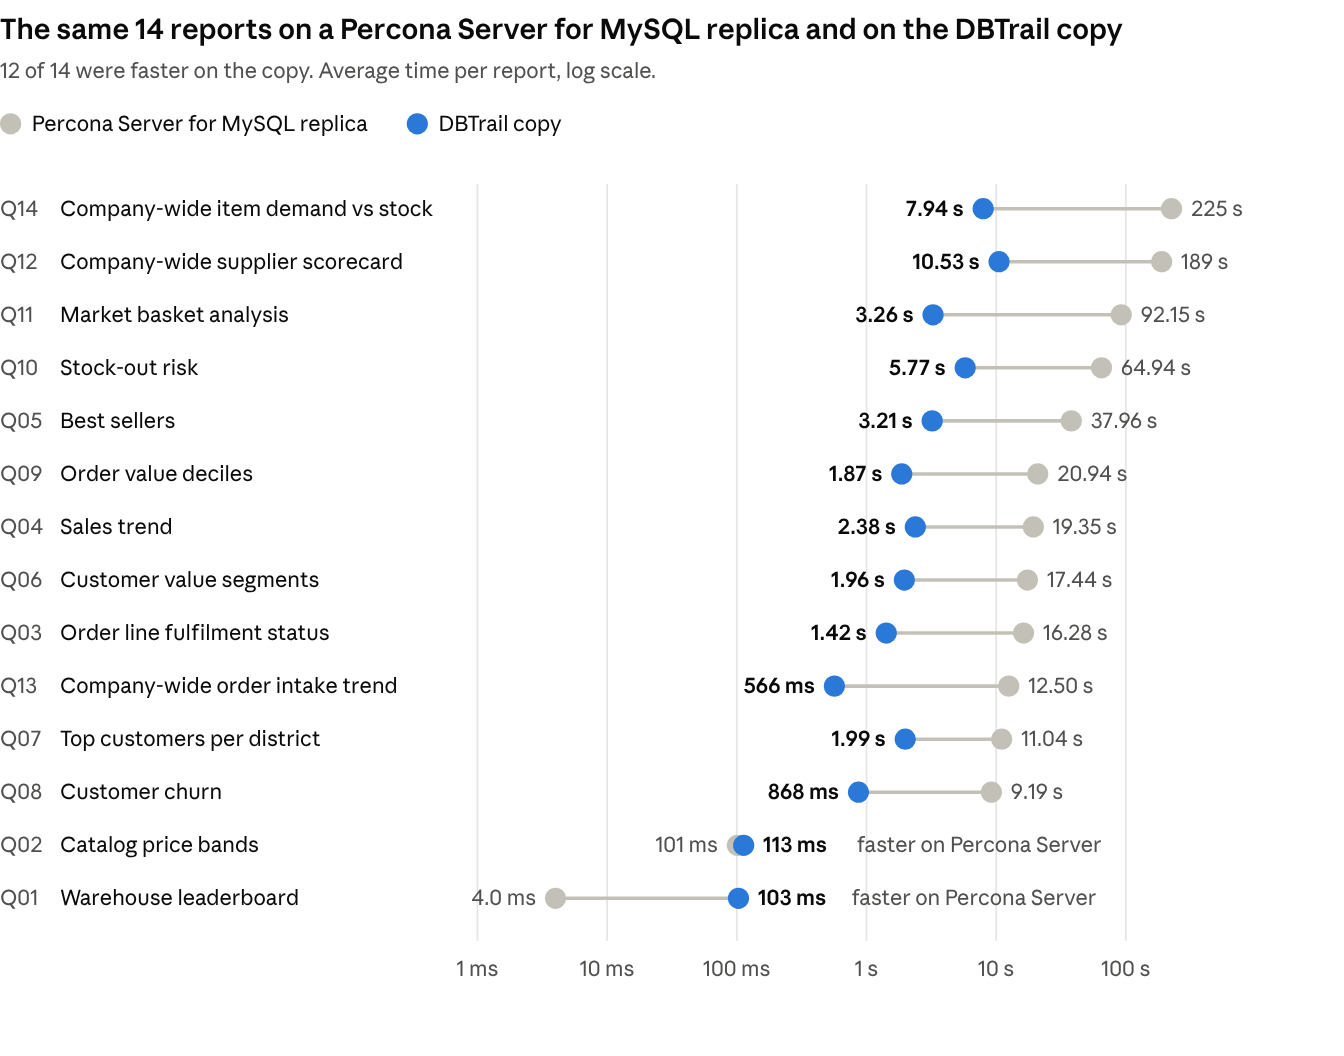
Full disclosure: I did not run this benchmark myself. It was run and published by the DBTrail project (routing guide at dbtrail.com/docs): 14 reports, an average of 317 runs each, on a 200-warehouse order-entry database kept under constant writes by HammerDB, with 4 CPUs on each side. Each engine was timed answering the reports by itself. The copy ran one to five minutes behind the source; the replica had no lag. Over 4,436 paired rounds the copy was 6.5x faster (geometric mean).
The slowest of the 14 is the kind of query every reporting screen ends up with sooner or later. It adds up every order line and every stock row and joins them by item:
|
1 2 3 4 5 6 7 8 9 10 11 12 13 14 15 16 17 18 19 20 21 |
WITH demand AS ( SELECT ol_i_id AS i_id, SUM(ol_quantity) AS units, COUNT(*) AS order_lines, SUM(CASE WHEN ol_delivery_d IS NULL THEN ol_quantity ELSE 0 END) AS pending_units FROM order_line WHERE ol_quantity >= 1 GROUP BY ol_i_id ), supply AS ( SELECT s_i_id AS i_id, SUM(s_quantity) AS on_hand, SUM(s_ytd) AS shipped_ytd, SUM(CASE WHEN s_data LIKE '%ORIGINAL%' THEN 1 ELSE 0 END) AS brand_warehouses FROM stock GROUP BY s_i_id ) SELECT i.i_id, i.i_name, i.i_price, d.units, d.order_lines, d.pending_units, s.on_hand, s.shipped_ytd, s.brand_warehouses, ROUND(1.0 * s.on_hand / d.units, 3) AS cover_ratio FROM demand d JOIN supply s ON s.i_id = d.i_id JOIN item i ON i.i_id = d.i_id ORDER BY cover_ratio, d.units DESC, i.i_id LIMIT 20 |
This is Q14 of tplytics, the report set used in the benchmark. The minimum quantity (1 or 5) and the limit (20 or 50) change from run to run.
No index will fix this one, because the query has to read both tables from end to end. On the replica that takes 225 seconds. On the copy, where the data is stored by column and scanned in parallel, it takes 7.94 seconds.
HTAP, hybrid transactional/analytical processing, means the application’s small transactions and the heavy analytical queries are served side by side. The reports that read this database do not need a warehouse loaded for them. In practice the heavy ones are reports, deep pagination, and queries over years of history.
The basic idea is simple. It takes two open source pieces. Percona Server keeps answering the transactions. DBTrail, an independent project under Apache 2.0, follows the server the way a replica does and answers the heavy queries from its own columnar copy.
I show it here on Percona Server, but it works the same way with MySQL from Oracle, including RDS and Aurora, and with MariaDB.
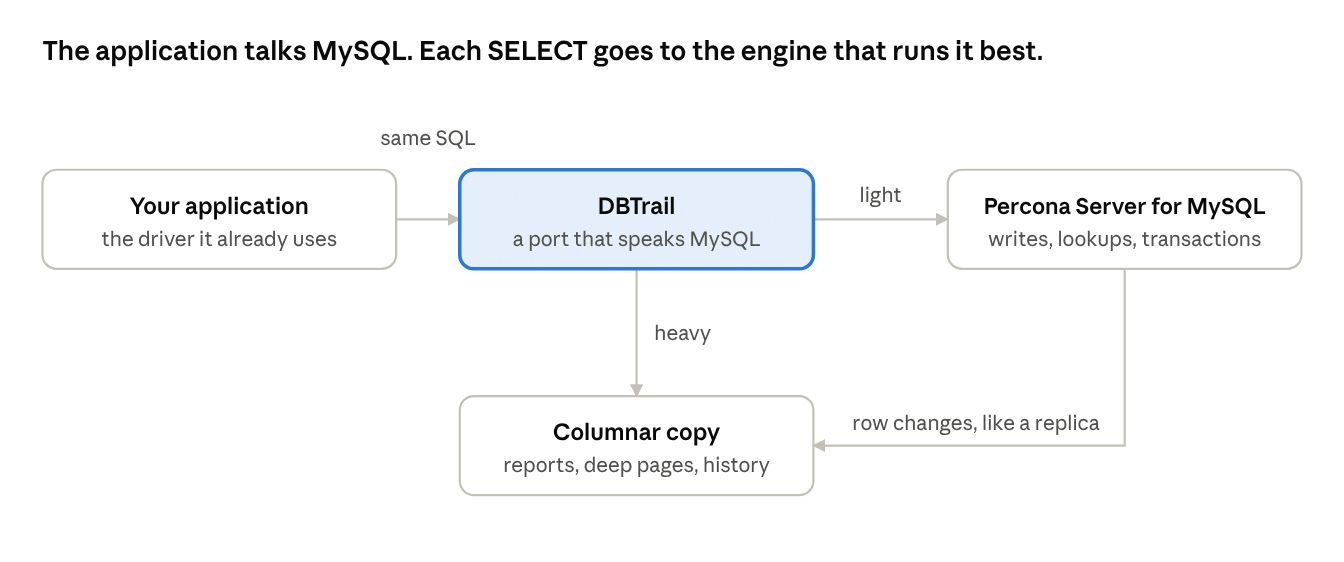
To the application, DBTrail is just a MySQL server. It connects to DBTrail’s port over the MySQL protocol, with the driver it already uses and the SQL it already sends. No query is rewritten and no query is tagged.
|
1 |
$ mysql -h -P 3309 -u shop -p shop |
For most SELECTs, DBTrail first asks the server for its plan, the same way EXPLAIN does, and the plan decides who answers:
| Statement | Answered by | Why |
|---|---|---|
SELECT * FROM orders WHERE id = 42 |
Percona Server | The plan finds a few rows through an index. The answer is live, to the last write. |
SELECT status, COUNT(*) FROM orders GROUP BY status |
DBTrail’s copy | The plan has a cost of 10,000 or more, or reads a whole table of 100,000 rows or more. |
| A heavy SELECT with GROUP_CONCAT, DATE_FORMAT or a JSON function | Percona Server | The copy would answer it differently, or cannot. A correct answer comes before a fast one. |
| Any SELECT inside a transaction | Percona Server | A read after your own write has to see that write. |
| A SELECT that returns more than 10,000 rows | Percona Server | The copy answers reports, not exports. |
The full rules are in the routing guide. What I like here is that nobody maintains a list of queries. A query that is light today and heavy next year goes to the copy when its plan changes.
Column names in the result are the server’s, whoever answers, so code that reads a result by column name keeps working. And before you move an application, the sql-compare command runs its queries on both sides and lists the ones that would answer differently.
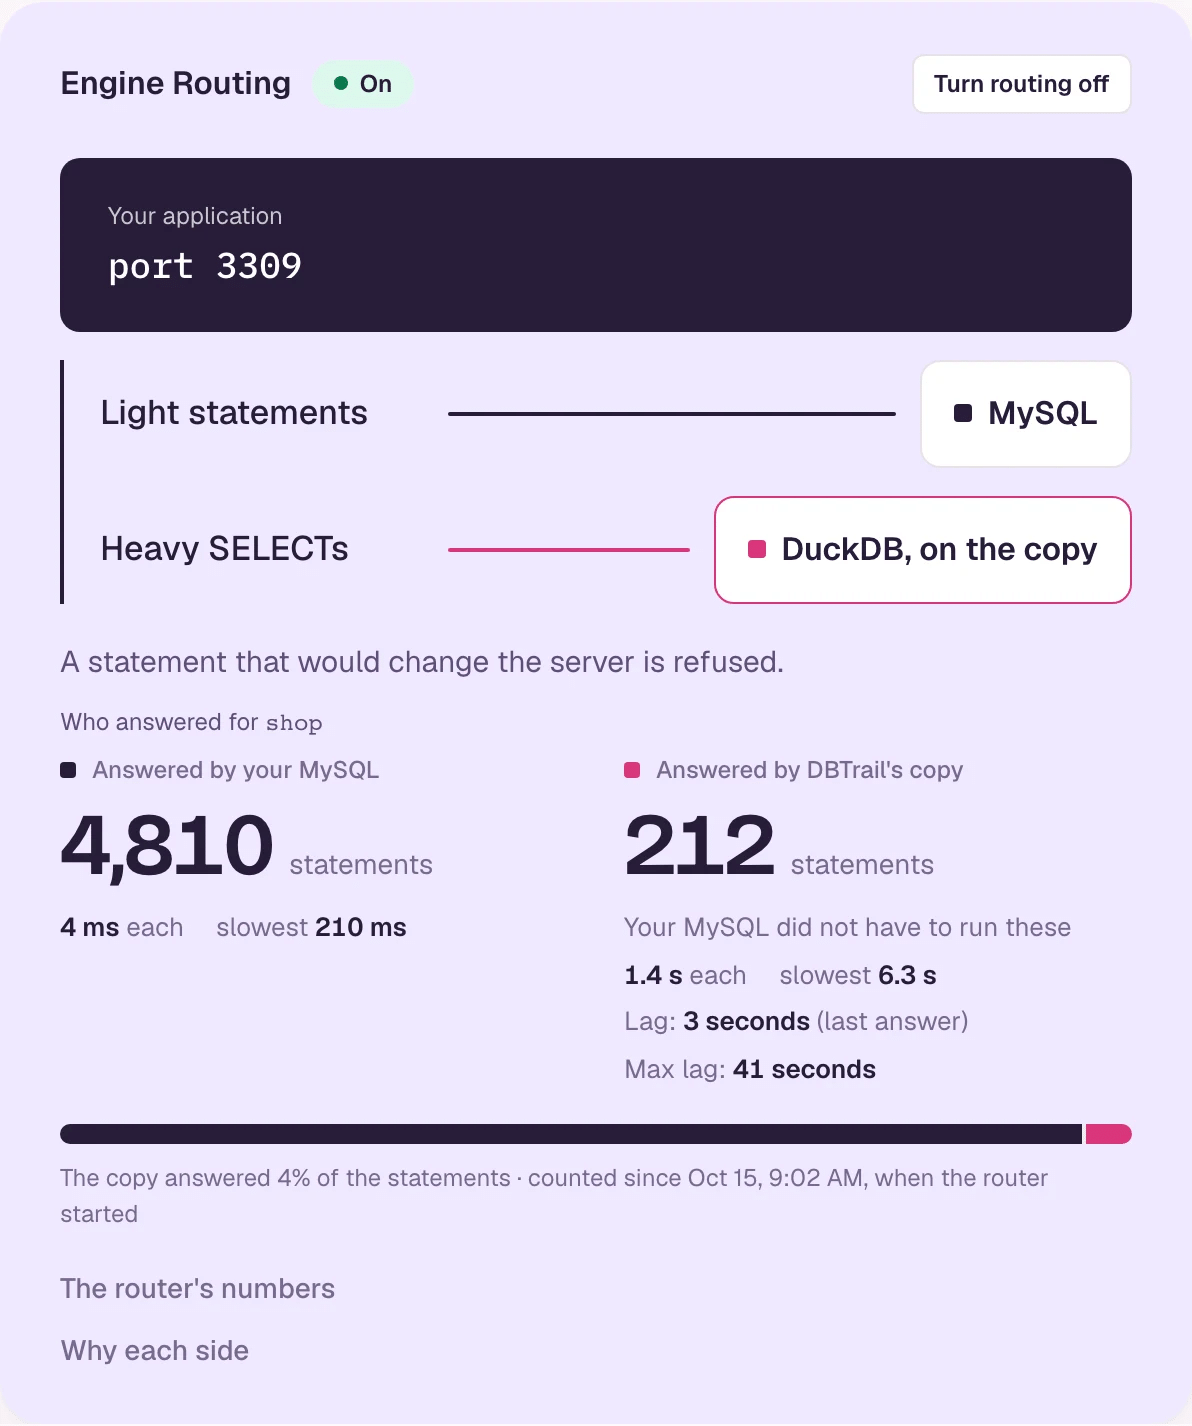
DBTrail’s web console counts who answered what, so you can see the split for your own workload:
DBTrail’s port only reads. If your application uses one connection for everything, put ProxySQL in front. Writes, transactions and locking reads go to Percona Server; every other SELECT goes to DBTrail, which then decides between the server and the copy as above.
In ProxySQL that is two servers and two rules, with the application’s user defaulting to hostgroup 10:
|
1 2 3 4 5 6 7 |
INSERT INTO mysql_servers (hostgroup_id, hostname, port) VALUES (10, 'percona-server-host', 3306), (20, 'dbtrail-host', 3309); INSERT INTO mysql_query_rules (rule_id, active, match_digest, destination_hostgroup, apply) VALUES (1, 1, '^SELECT .* FOR (UPDATE|SHARE)', 10, 1), (2, 1, '^SELECT ', 20, 1); |
The application keeps its host, its port and its login.
But does the application actually feel the difference? This setup was measured with a MariaDB source, an application at a fixed 400 transactions per second, and three reports running in a loop. It is the only run that measures the application and the reports together, so for me it is the most interesting one:
| Where the reports ran | Application latency, p95 | Reports finished in 5 minutes |
|---|---|---|
| No reports running | 13.7 ms | 0 |
| On the database | 6,960 ms | 12 |
| Through DBTrail | 13.2 ms | 266 |
MariaDB 10.11, ProxySQL 3.1, sysbench. The copy was 0.9 to 3.0 seconds behind. Benchmark by the DBTrail project.
With the reports on the database, p95 latency went from 13.7 ms to 6,960 ms. Through DBTrail it stayed at 13.2 ms, and 22 times more reports finished.
One of those three reports was a page five million rows deep, ORDER BY k LIMIT 20 OFFSET 5000000. It took 92 seconds on the database and 0.7 seconds through DBTrail.
| Part | What it needs |
|---|---|
| Application | Point its reads at another host and port. Same driver, same SQL, no code to rewrite. |
| Database | Nothing is installed in it. It needs the binary log in ROW format with full row images, a primary key on every InnoDB table, and two users. |
| Hardware | One machine next to the database. In the 14-report benchmark it had 4 CPUs, the same as the replica. The copy is columnar files on local disk or in S3. |
| Cost | Apache 2.0, with no license fee. For these queries there is no warehouse to load and no pipeline to maintain. |
The quick start is five steps on a machine with Docker Compose:
|
1 |
curl -fsSL https://raw.githubusercontent.com/dbtrail/dbtrail/main/install.sh | sh |
Routing between the server and the copy is one more user and one switch, described in the routing guide.
These are DBTrail’s numbers on DBTrail’s workload. The only benchmark that really matters is your own. Put DBTrail on a separate machine, point it at a replica, and run your slowest report on both.
The documentation lists MySQL and Percona Server for MySQL 8.0 and 8.4, and MariaDB 10.11 and later. Install steps and the routing guide are at dbtrail.com/docs, and the source is at github.com/dbtrail/dbtrail.
If you try it, I am looking for your feedback: which of your queries went to the copy, and how did they do?
Resources
RELATED POSTS