

MySQL is very good at serving application workloads, but things get more complicated when somebody decides to run a large report on the same server.
A scan can push hot pages out of the buffer pool. A long-running read can hold back purge. A GROUP BY over millions of rows can start writing temporary tables to disk.
The traditional answer is a reporting replica. But that means running another MySQL server, and at the end of the day it is still a row-oriented database.
Another option is moving the data into an analytical database. That can work very well, but now you have a data pipeline to build, operate, monitor, and eventually debug.
We have been looking at what MySQL users can do with DuckDB, and DBTrail is an interesting approach.
DBTrail is open source under Apache 2.0. It is being built by Daniel Guzman-Burgos, who previously worked at Percona as a MySQL Technical Lead.
The basic idea is simple.
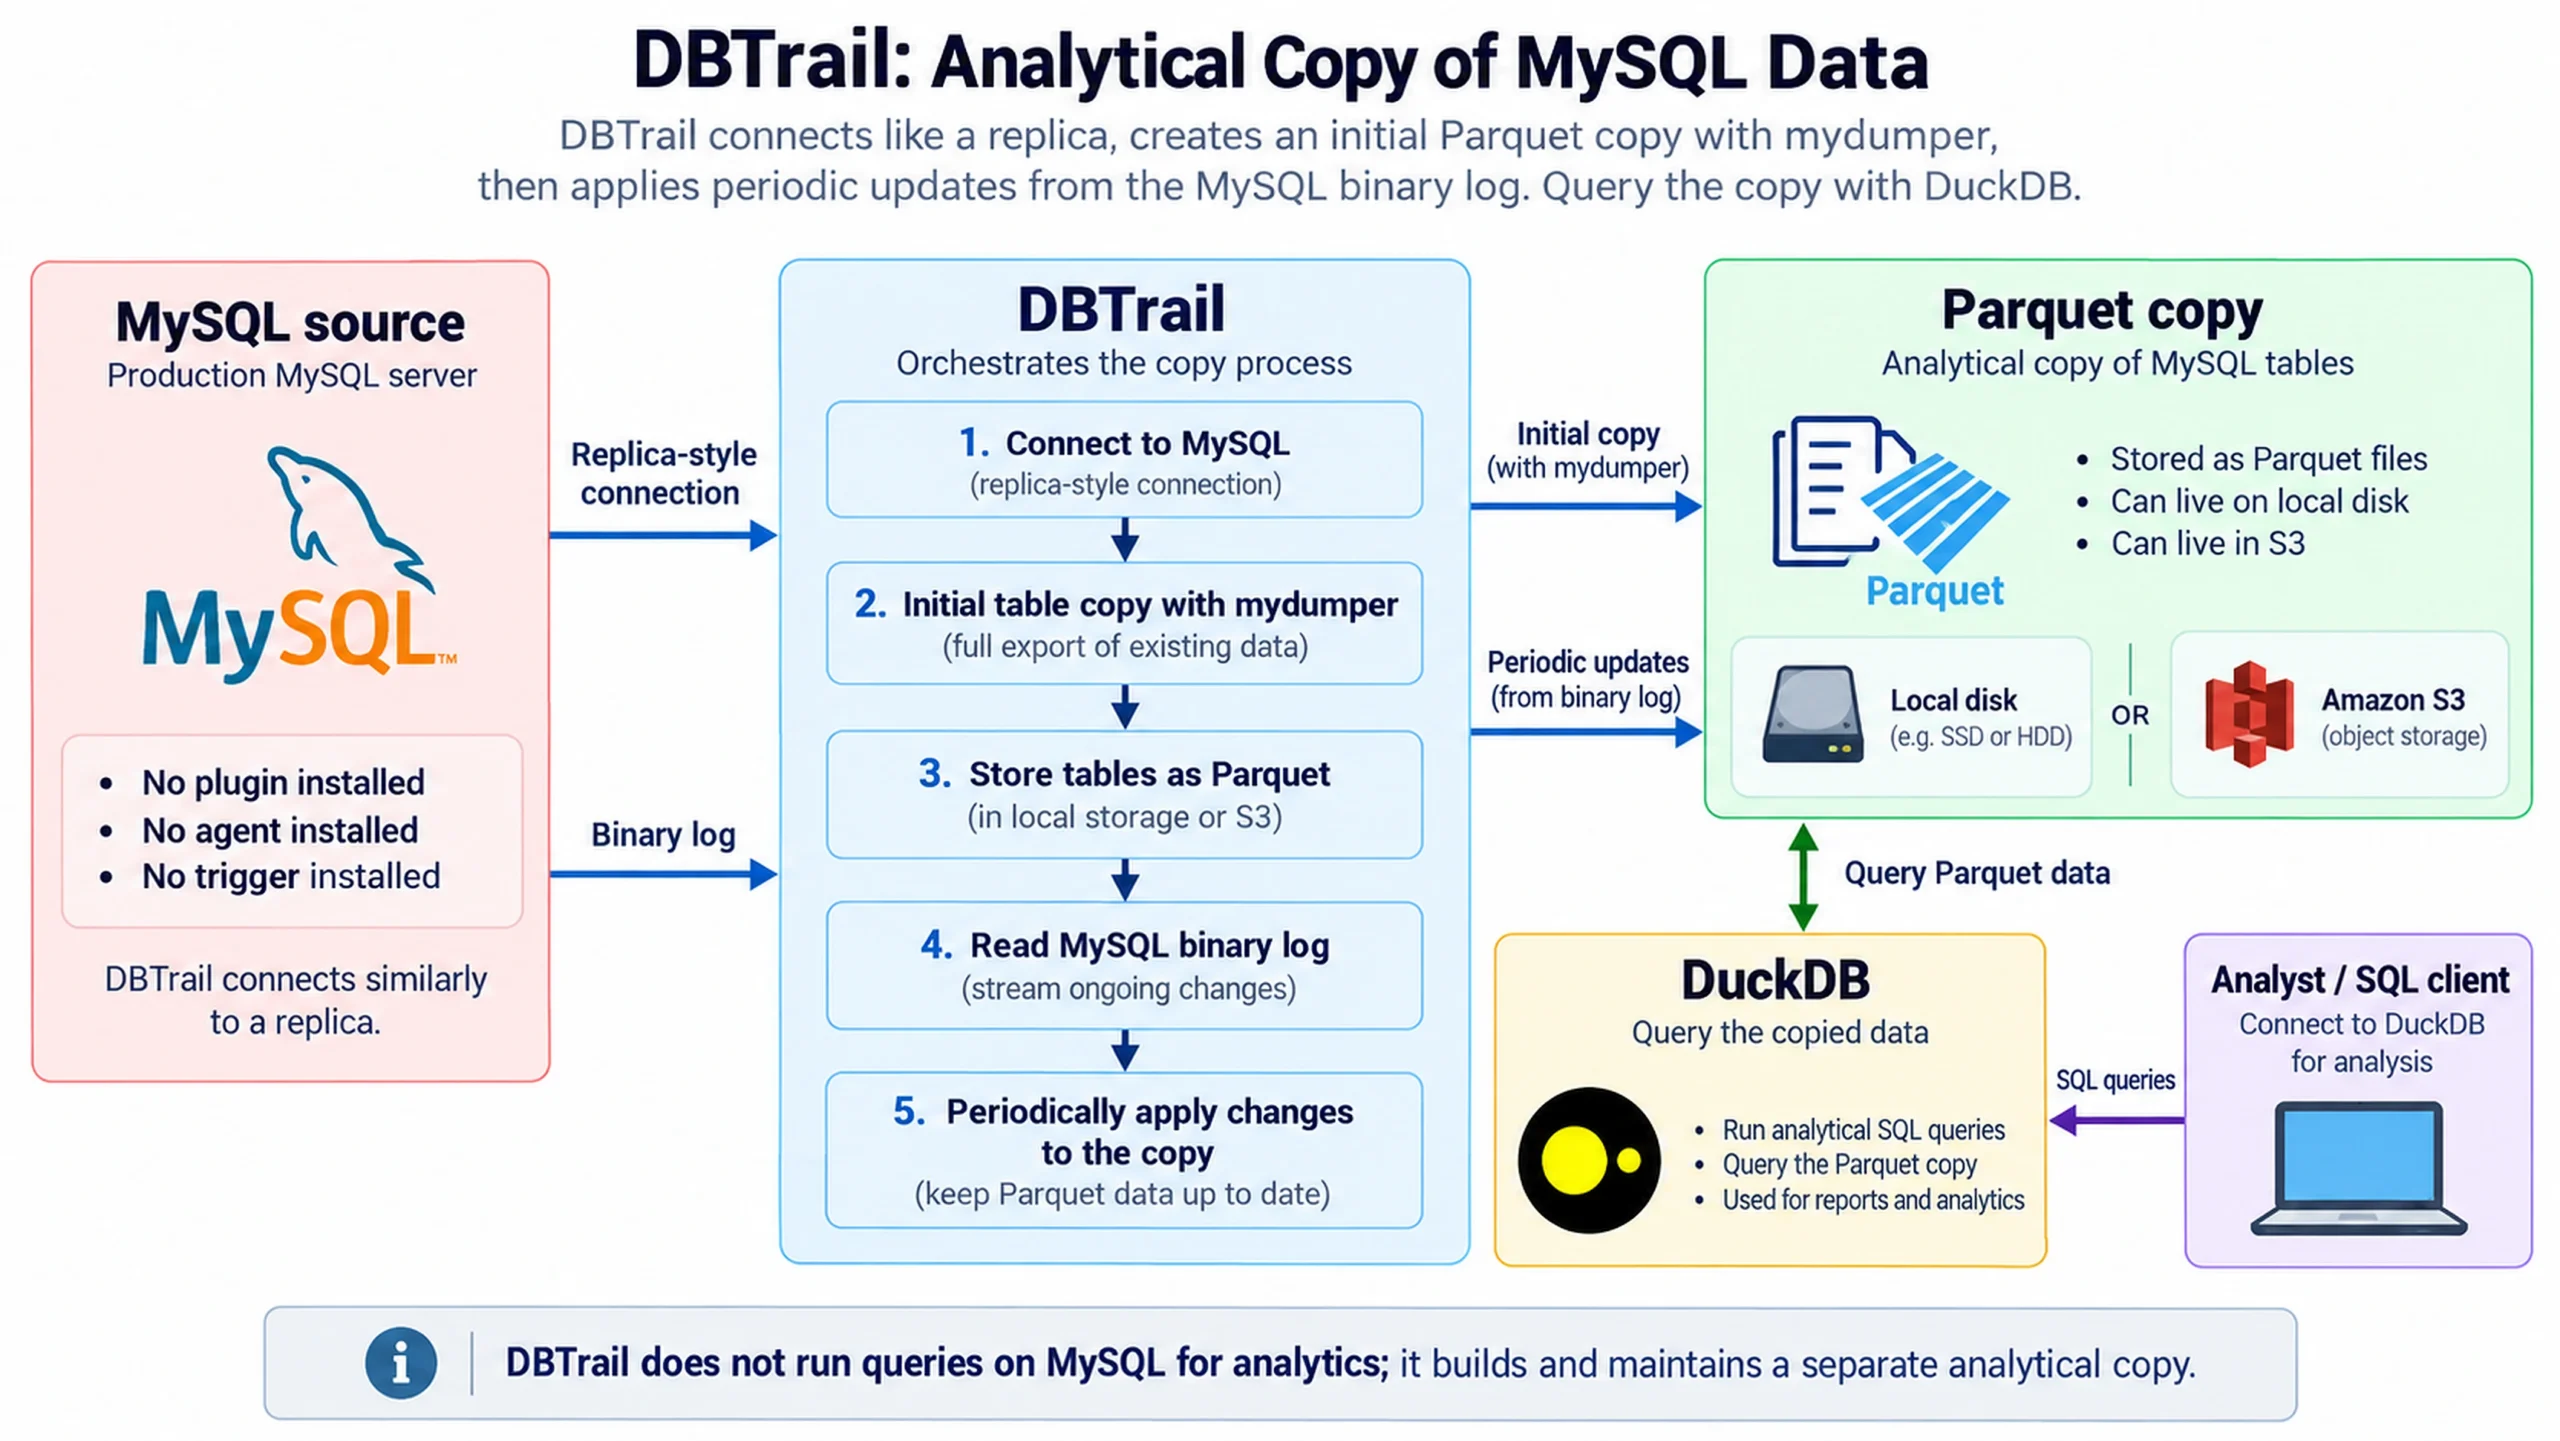
DBTrail connects to MySQL similarly to a replica. It makes an initial copy of the tables using mydumper and stores the data as Parquet files, either locally or in S3.
After that, it reads the MySQL binary log and periodically applies changes to the copy.
You query the resulting data with DuckDB.
Nothing is installed inside MySQL, there is no MySQL plugin, agent, or trigger.
The setup would look like this:
Let’s do some performance testing.
We used three AWS machines in the same subnet in us-west-2a.
| Role | Machine | Software |
|---|---|---|
| Source | r7i.4xlarge | Percona Server for MySQL 8.4.11-11 |
| DBTrail and DuckDB | r7i.4xlarge | DBTrail 0.99.0, DuckDB 1.5.6 |
| Load generator | c7i.2xlarge | sysbench 1.0.20, sysbench-tpcc |
| Source and DBTrail machines | Load machine | |
|---|---|---|
| CPU | Intel Xeon Platinum 8488C, 8 cores, 16 threads | Same CPU, 4 cores, 8 threads |
| Memory | 128 GB, 123.8 GB usable | 16 GB |
| Disk | EBS gp3, 400 GB, 16,000 IOPS, 1,000 MB/s provisioned | Not used by the test |
| Filesystem | ext4, relatime,discard,commit=30 |
|
| I/O scheduler | none, 128 KB read-ahead | |
| OS | Ubuntu 24.04.5, kernel 7.0.0-1013-aws | Same |
| Kernel settings | swappiness 60, dirty ratio 20/10, THP madvise |
Same |
| Docker | 29.1.3 |
Percona Server runs in Docker using host networking.
We used full durability and a buffer pool large enough to keep the whole data set in memory:
|
1 2 3 4 5 6 7 8 9 10 |
<code>innodb_buffer_pool_size = 96G innodb_redo_log_capacity = 32G innodb_flush_log_at_trx_commit = 1 sync_binlog = 1 innodb_flush_method = O_DIRECT innodb_io_capacity = 8000 innodb_io_capacity_max = 16000 binlog_format = ROW binlog_row_image = FULL gtid_mode = ON</code> |
The workload is sysbench-tpcc with 200 warehouses, which produces 102 million rows and about 19 GB of data when the run started.
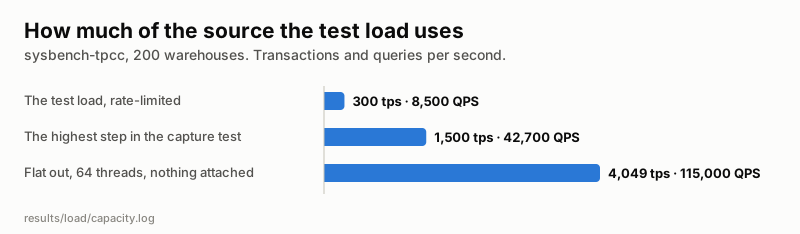
For the initial workload we held the workload at 300 transactions per second.
One TPC-C transaction in this test is roughly 28 SQL statements, so that means about:
It is important to put that load into context—on the same server flat out with 64 threads and nothing else attached, it reached 4,049 transactions per second, or about 115,000 QPS.
So the 300 TPS test uses only about 7% of the available capacity, and we chose a relatively light load intentionally. We wanted to see what analytical queries cost even when the source has plenty of headroom.
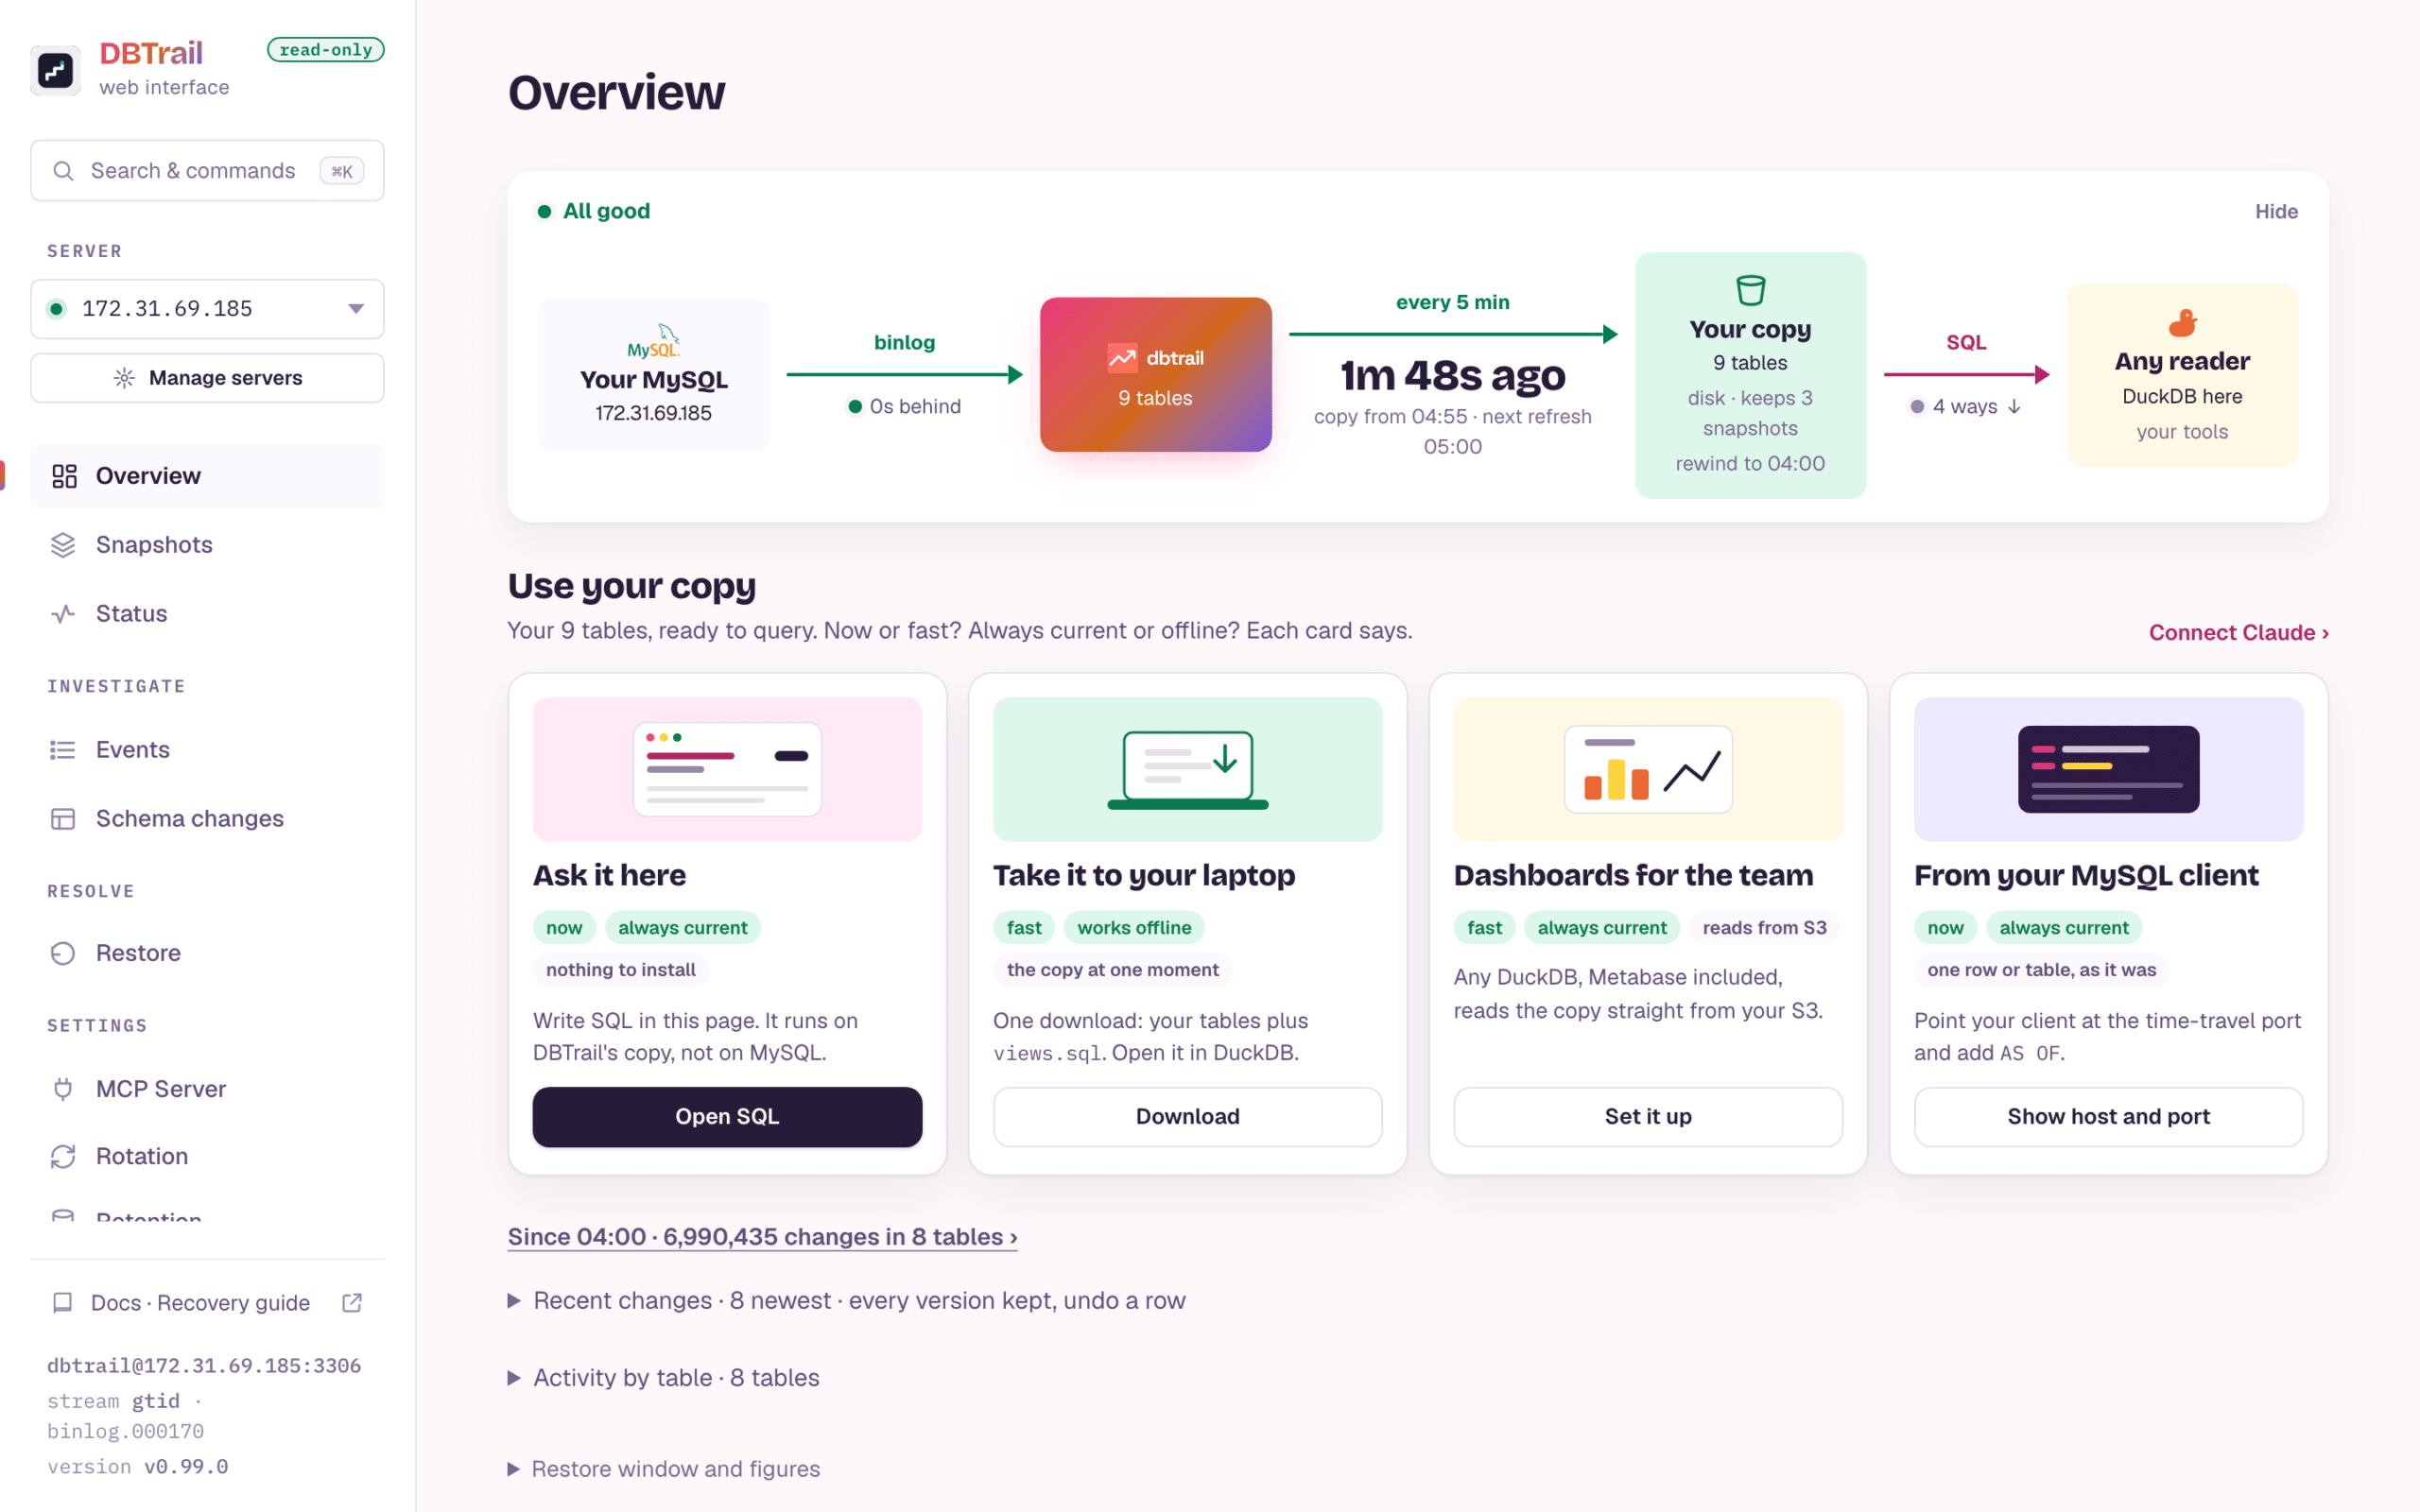
DBTrail installs with one command that starts its Docker Compose stack:
|
1 2 |
<code>curl -fsSL https://raw.githubusercontent.com/dbtrail/dbtrail/v0.99.0/install.sh \ | DBTRAIL_REF=v0.99.0 sh</code> |
The stack contains two containers: DBTrail itself and a MySQL 8.4.9 instance DBTrail uses as an index of row changes.
This internal MySQL needs attention, as the default installation leaves its buffer pool at MySQL’s 128 MB default. For this workload, that is nowhere near enough.
For the main tests we configured it like this:
|
1 2 3 4 5 6 7 8 9 10 |
<code>innodb_buffer_pool_size = 48G innodb_redo_log_capacity = 16G innodb_log_buffer_size = 256M innodb_flush_log_at_trx_commit = 2 innodb_flush_method = O_DIRECT innodb_io_capacity = 8000 innodb_io_capacity_max = 16000 innodb_page_cleaners = 16 innodb_flush_neighbors = 0 skip-log-bin</code> |
DuckDB ran on the same machine with its defaults: 16 threads and a 99 GB memory limit.
Short answer: at this workload, almost not at all.
The load ran continuously. Each row below represents one phase of the same test.
| Phase | TPS | QPS | Median 95th percentile | Worst second |
|---|---|---|---|---|
| Nothing attached, 10 min | 299.9 | 8,554 | 41.9 ms | 46.6 ms |
| DBTrail reading binlog, 10 min | 300.5 | 8,535 | 41.9 ms | 47.5 ms |
| Initial copy of all tables, 4m 40s | 298.1 | 8,460 | 41.1 ms | 118.9 ms |
| Copy updated every 5 min, 75 min | 300.2 | 8,539 | 41.1 ms | 46.6 ms |
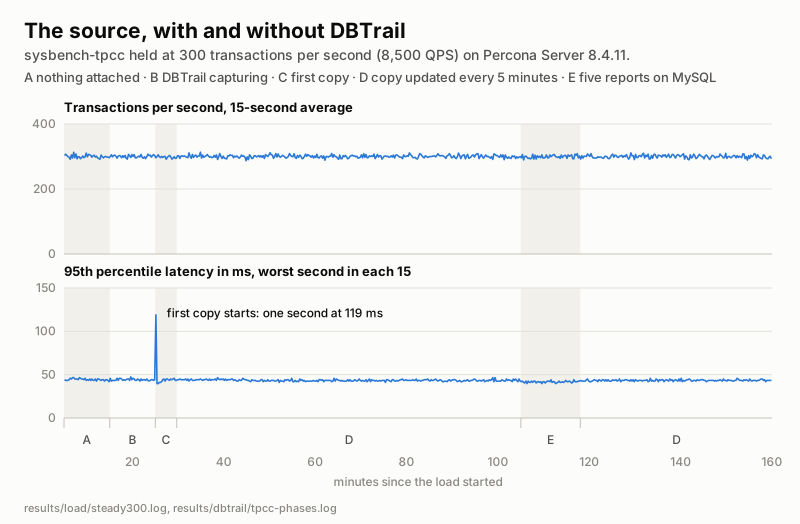
There is one spike here that stands out.
When the initial copy started, at approximately second 1,500 of the workload, the 95th percentile latency jumped to 119 ms and throughput dropped to 271 transactions for that second and it happened once.
The initial copy takes a global read lock briefly when it starts, and the timing matches that operation, after that, DBTrail read 102 million rows in less than five minutes without any measurable slowdown in the application workload.
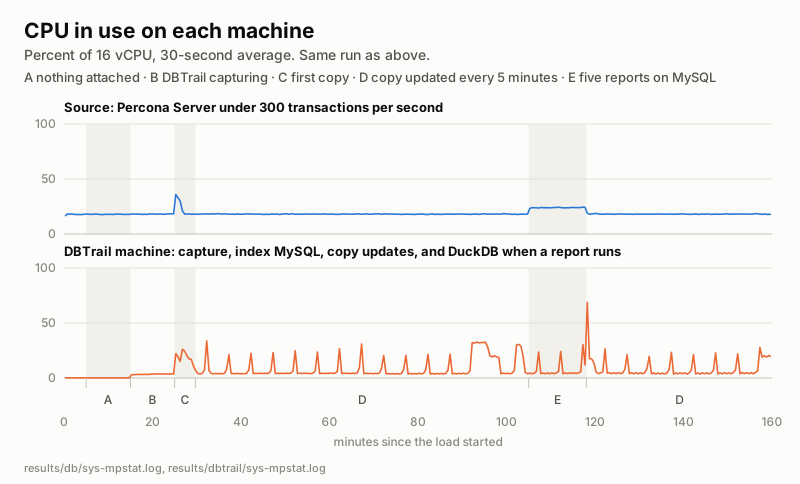
CPU usage confirms the same story: the source normally sat around 18% CPU, but during the initial table copy it increased to about 35%.
When we later ran the five analytical reports directly against MySQL, CPU was around 24%.
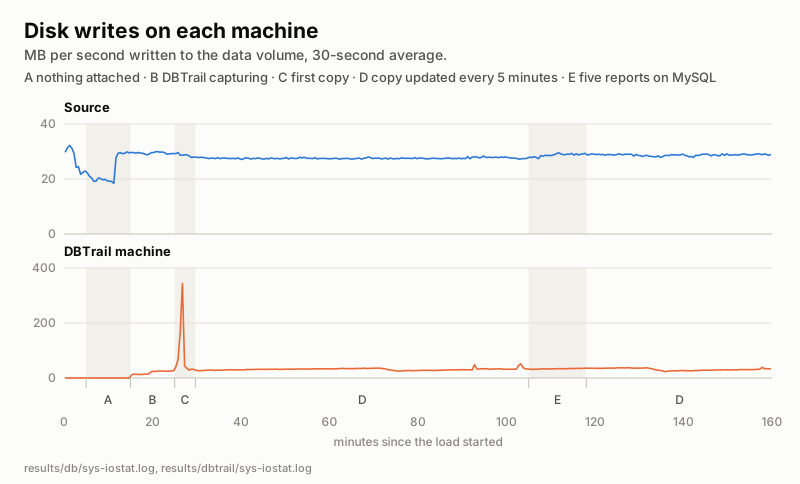
There is also a noticeable increase in source writes around minute 12. That happened three minutes before DBTrail connected, so it was unrelated to DBTrail.
The DBTrail machine itself writes roughly as much as the source because it keeps an index of every captured row change.
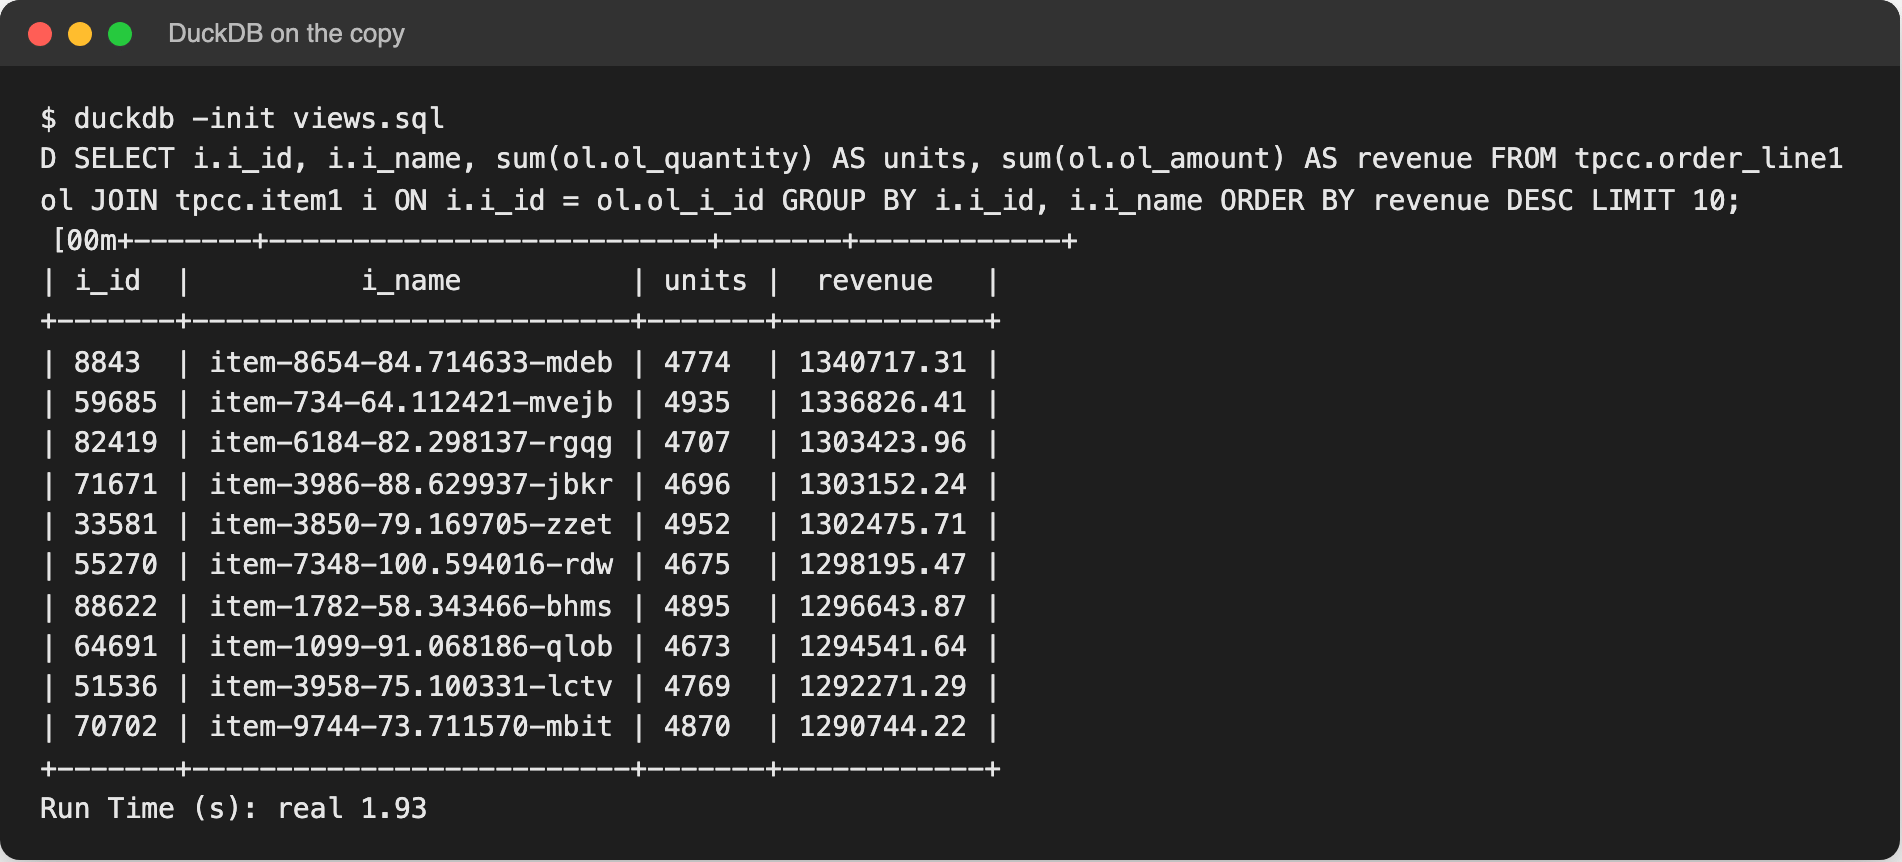
DBTrail creates a views.sql file containing a DuckDB view for each source table.
From there you can query the data normally:
|
1 2 3 4 5 6 7 8 9 10 11 12 |
<code>$ duckdb -init views.sql D SELECT i.i_id, i.i_name, sum(ol.ol_quantity) AS units, sum(ol.ol_amount) AS revenue FROM tpcc.order_line1 ol JOIN tpcc.item1 i ON i.i_id = ol.ol_i_id GROUP BY i.i_id, i.i_name ORDER BY revenue DESC LIMIT 10;</code> |
We ran the same five reports against MySQL and against DuckDB while the transactional workload continued running, during the workload the data had grown from 102 million to 113 million rows.
MySQL had essentially everything cached in memory and the DBTrail copy was also in its normal operating state: a base Parquet file plus the accumulated change files that DuckDB needs to combine when executing the query.
The results:
| Report | MySQL | DuckDB on DBTrail copy |
|---|---|---|
| Revenue per warehouse | 9.7 s | 0.75 s |
| Orders and revenue per district/month | 46.5 s | 2.8 s |
| Ten best-selling items | 5m 32s | 1.7 s |
| Customers by state and credit | 3.6 s | 0.18 s |
| Warehouses low on stock | 3.0 s | 0.23 s |
| Total | 6m 35s | 5.7 s |
This is where the difference becomes interesting: 6m 35s on MySQL and less than 6s on DuckDB.
TPC-H is a more standard analytical workload; for this test, we loaded TPC-H at scale factor 10.
The dataset contained:
The initial DBTrail copy took 6 minutes 26 seconds and produced 2.8 GB of Parquet files.
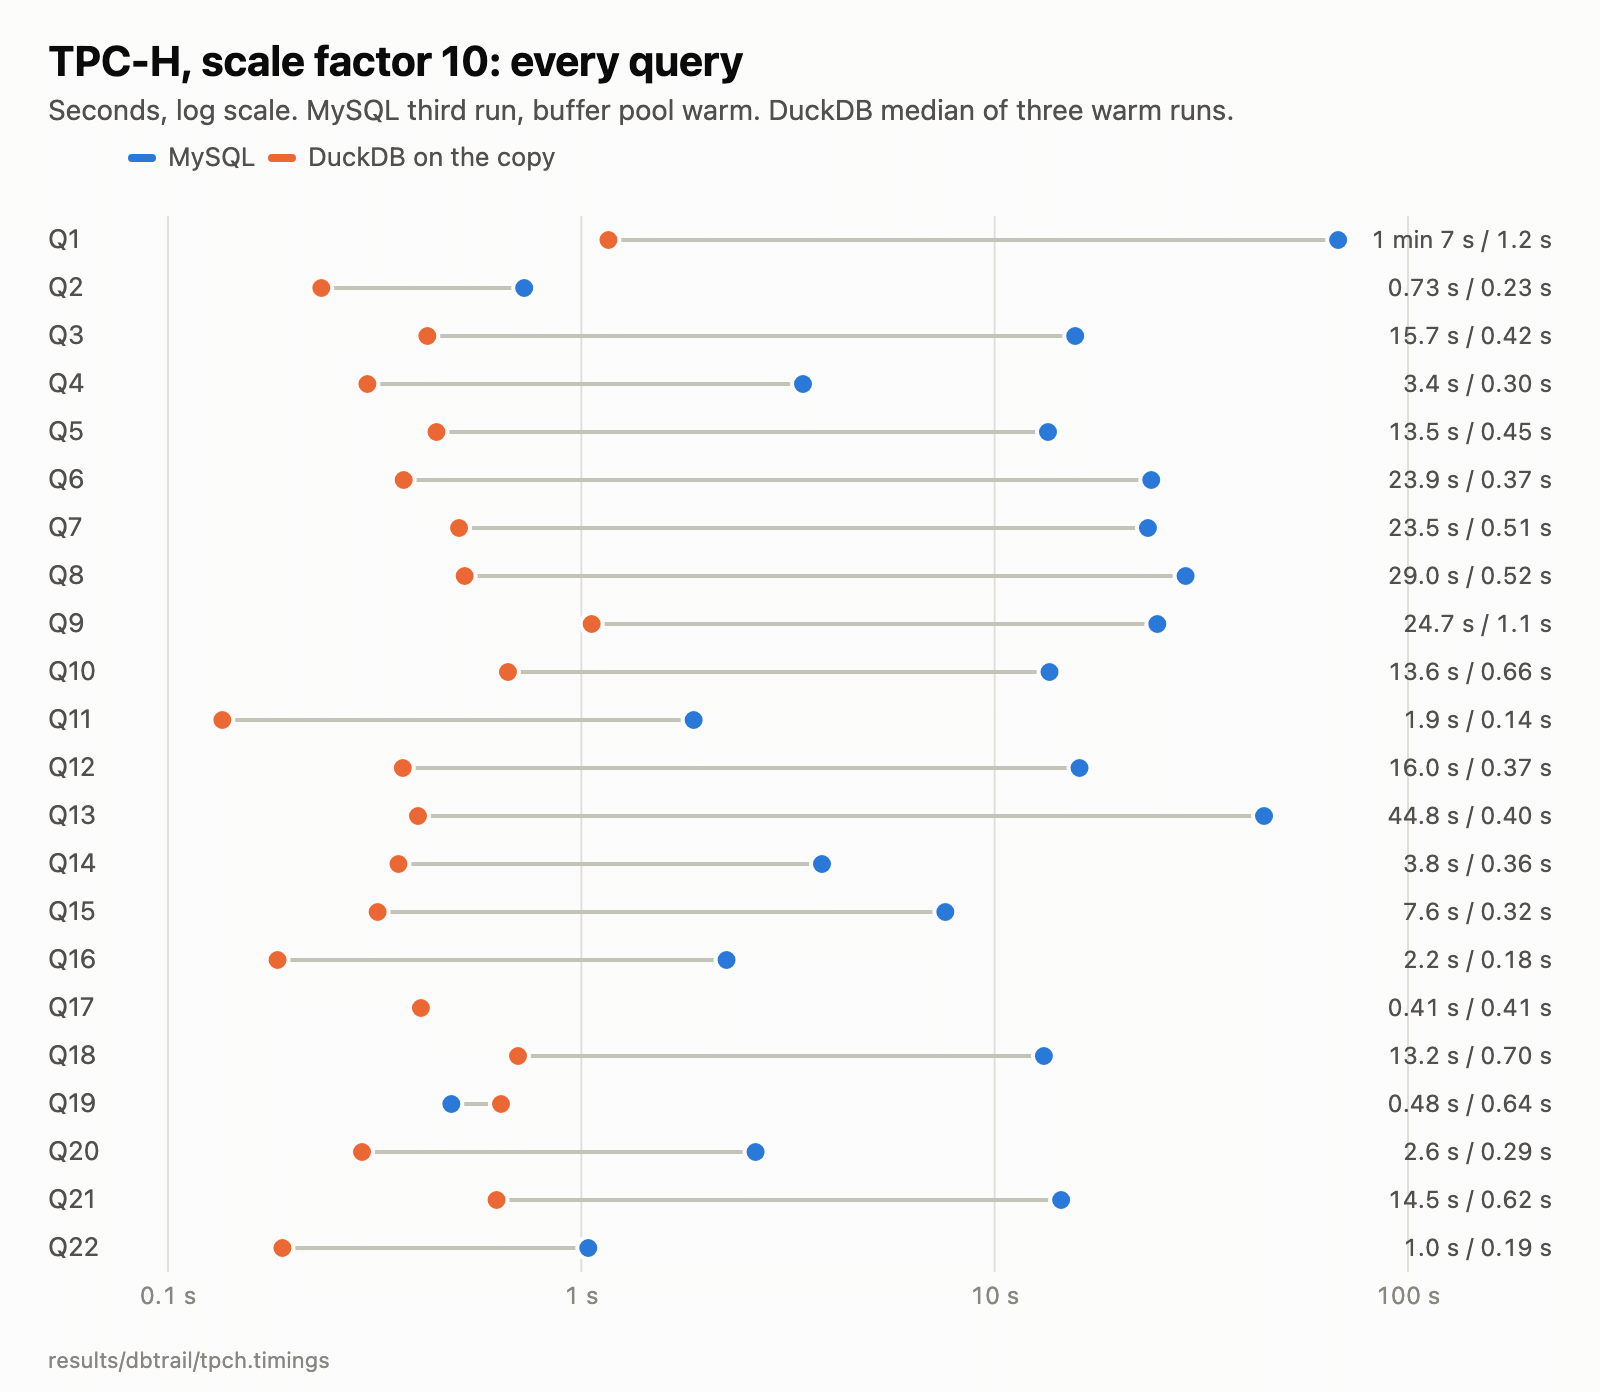
We ran the same SQL against both systems and compared results:
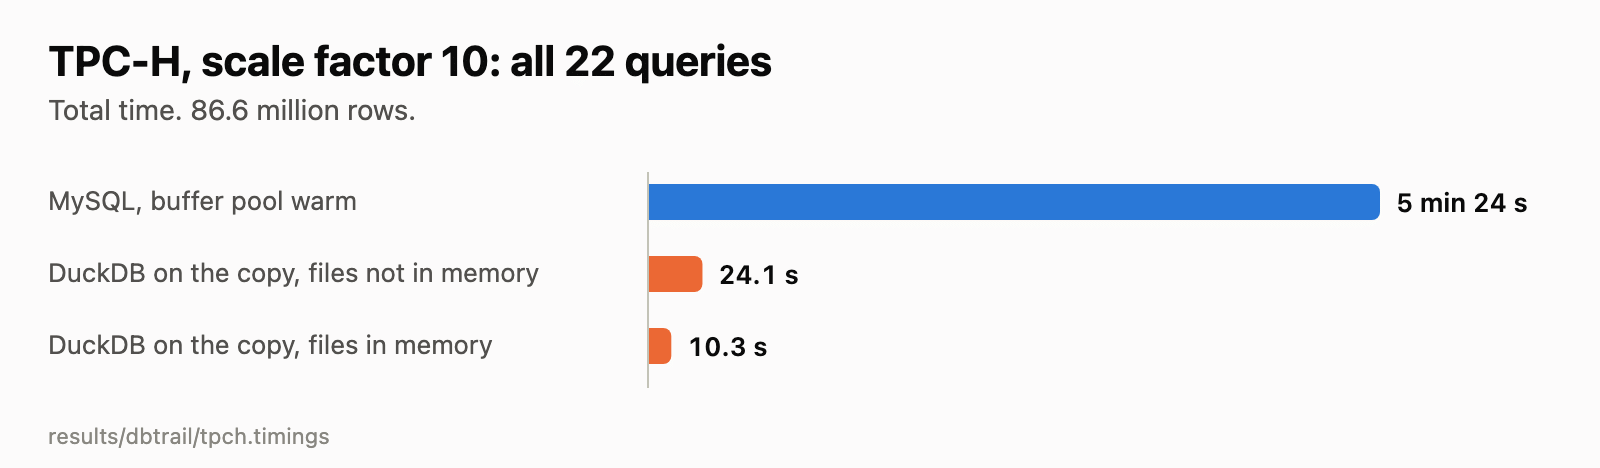
| MySQL | DuckDB warm | |
|---|---|---|
| All 22 queries | 5m 24s | 10.3 s |
MySQL wins Q19 because an index can go directly to the relevant rows, Q17 is effectively a tie and for the rest, DuckDB is substantially faster.
If you are interested in these performance numbers, stay tuned for Part 2, where we will look into how often DBTrail refreshes data to stay up to date.
Resources
RELATED POSTS