

A new version of Community MySQL Server July release contains two versions 26.7.0 and 9.7.2. It is an important milestone because it finally brings a Thread Pooling feature to the community. The official MySQL Server Thread Pool plugin existed for a long time, but was available exclusively for MySQL Enterprise Edition.
Before MySQL 26.7.0 / 9.7.2 the most popular free thread pooling enabled alternatives were:
Now we will be able to see what benefits the thread pooling mechanism brings to MySQL Server and compare it with the implementation of the thread pool in Percona Server for MySQL.
Part 1 will explain the basics of thread pooling and analyze the efficiency of its implementation in Percona Server for MySQL. The performance comparison between Percona Server and MySQL Server is done in Part 2.
Thread Pooling is a technique that reuses a fixed number of pre-created threads to handle multiple client connections and execute statements inside a database.
By default, MySQL creates a dedicated thread whenever a client connects, runs the queries, and then destroys the thread when finished. When connection counts grow very large, this default method causes performance to drop significantly because creating, destroying, and constantly switching between thousands of threads wastes system resources and causes contention.
This blog post from Vadim Tkachenko explains the working of thread pool, which gives an easy to understand similarity with the car traffic:
SimCity outages, traffic control and Thread Pool for MySQL
More information about it can be found in Percona Documentation.
WARNING: the post is several pages long because it looks into different aspects of thread pooling and compares the effect of various options. If you do not want to dive into the details, feel free to read the SPOILER below and proceed to the Conclusion section.
SPOILER: Thread Pool is not a universal database booster, which always brings performance up. Like every advanced tool it should be used with full understanding of the goals and objectives. Otherwise the results might be far from perfect.
See also:
In this research we will be sweeping across the range of various parameters of the Thread Pool and see how the performance of the server is affected.
The base line will be the server configuration when the thread pool is not enabled. This is done by setting thread_handling=one-thread-per-connection. When the pooling is enabled (thread_handling=pool-of-threads) the benchmark will set different values for the following variables that control the thread pool behavior:
| Name | Sweep range | Description |
| thread_pool_size | 10 / 20 / 40 / 80 / 120 / 160 | Number of thread groups in the pool. NOTE: thread_pool_size=5 was also tested, but the performance was unsatisfactory, for that reason it is not included in the report. |
| thread_pool_max_threads / thread_pool_max_active_query_threads |
12000 | Maximum number of threads in the pool. |
| thread_pool_oversubscribe / thread_pool_query_threads_per_group |
2 / 3 / 4 | Number of threads that can be active at the same time within the same group. |
The configuration was as follows:
| Benchmark | Sysbench OLTP Read-Write |
| CPU | Intel Xeon Gold 6230 (2×20 cores, HT = 80 logical CPUs) |
| RAM | 187 GiB DDR4 |
| Storage | NVMe SSD (2.9 TB) INTEL SSDPE2KE032T8 |
| OS | Ubuntu 24.04, kernel 6.8.0-60-generic |
| DB Engines | Percona Server for MySQL 9.7.1-1 (release build)
MySQL Server 26.7.0 (release build) |
Additional dimensions for the benchmark:
| Database Sizes (Row Number) | 24Gb (100M rows) |
| Number of tables in DB Schema | 20 (this number is constant for all runs)
Database Schema definition can be downloaded from here: https://percona-lab-results.github.io/2026-interactive-metrics/schema_dump.sql |
| Number of concurrent threads | 40 / 80 / 120 / 160 / 320 / 640 / 1280 / 2560 / 5120 |
| Buffer to Data Ratio | 1:12 (I/O bound), 1:2 (Partially buffered), 1:1 (Fully buffered) |
Execution of the benchmarks was done as follows:
| Ramp-up | 48G – 600 sec (10 min)
The Ramp-up times were established experimentally depending on the Data Size until the point when increasing them further did not bring significant changes. |
| Measurement window | 900 sec (15 min)
Ideally it should be as long as possible, but measurements should take reasonable time. Hence, we used the experience of previous benchmarks and established that this window is adequate for the purpose. |
| Number of runs | 1
Could be more runs, but testing took a long time. |
Important Database Configuration options (the actual config files with specific settings for each run can be downloaded from the interactive graphs):
| InnoDB – Buffer pool Tier | |
| innodb_buffer_pool_size | 2G/12G/32G |
| innodb_buffer_pool_load_at_startup | OFF |
| innodb_buffer_pool_dump_at_shutdown | OFF |
| Threading | |
| thread_stack | 512K |
| thread_cache_size | 256 |
| back_log | 4096 |
| InnoDB I/O | |
| innodb_io_capacity | 10000 |
| innodb_io_capacity_max | 20000 |
| innodb_read_io_threads | 16 |
| innodb_write_io_threads | 16 |
| innodb_use_native_aio | ON |
| InnoDB Log / Durability | |
| innodb_log_buffer_size | 256M |
| innodb_flush_log_at_trx_commit | 1 # full ACID |
| innodb_doublewrite | ON |
| InnoDB – Concurrency & OLTP Tuning | |
| innodb_stats_on_metadata | OFF |
| innodb_open_files | 65536 |
| innodb_lock_wait_timeout | 50 |
| innodb_rollback_on_timeout | ON |
| Per-Session Buffers | |
| sort_buffer_size | 4M |
| join_buffer_size | 4M |
| read_buffer_size | 2M |
| read_rnd_buffer_size | 4M |
| tmp_table_size | 256M |
| max_heap_table_size | 256M |
| Binary Log | |
| disable_log_bin | ON # Disabled binlog |
| Other InnoDB settings | |
| innodb_redo_log_capacity | 4G |
| innodb_change_buffering | none |
| innodb_flush_method | O_DIRECT |
| innodb_buffer_pool_instances | Calculated as (innodb_buffer_pool_size G / 5) But must be in range [1..8] |
| Misc server settings | |
| collation_server | utf8mb4_unicode_ci |
| bulk_insert_buffer_size | 256M |
| myisam_sort_buffer_size | 128M |
| key_buffer_size | 64M # MyISAM only, keep small for OLTP |
The scope of results is broad and therefore the results presentation will be divided into the sections.
The most impressive effect of the thread pool can be illustrated on the following graph where the level of oversubscription is 4 (os4 in the legend) and the number of thread groups is 10 (TP 10 in the legend).
Graph 1.0 – best effect of thread pooling [ INTERACTIVE GRAPH ][ TABLE ]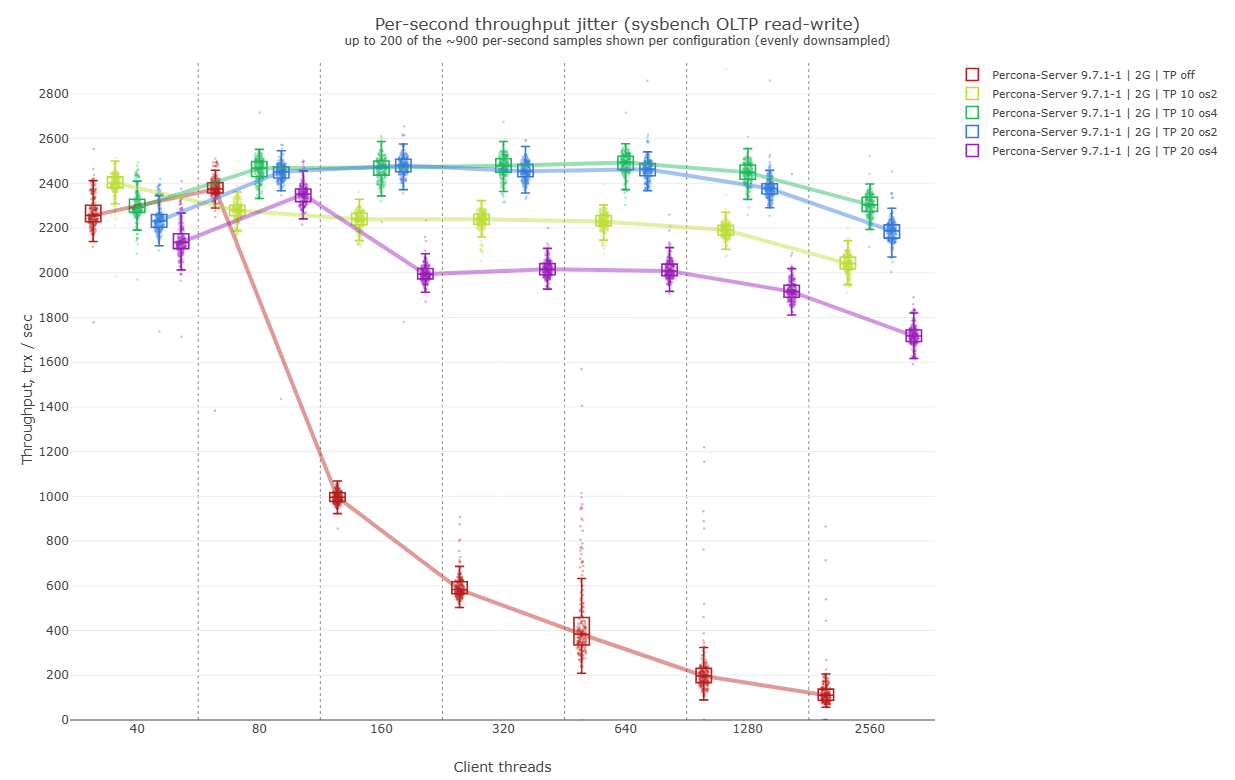
The green line (thread_pool_size=10/thread_pool_oversubscribe=4) is closely followed by the blue line, which corresponds to the number of groups 20 and the oversubscription 2.
As the graph shows – the effect of the thread pool on the performance in the low thread count (40/80) is relatively small. A notable effect starts to show at 120 threads when non-pooled configuration TPS plunges down. It is good to keep in mind that the thread pooling mechanism is not a universal performance booster. Though, it helps to avoid system thrashing when the number of threads is much larger than CPU cores can process.
With 2560 connections the best configuration with thread pool shows excellent efficiency of 2304 TPS against 129 TPS without the thread pool, which is 17.9 times faster. Some thread-pooled configurations are more efficient than the other ones. The combination thread_pool_size=20 with thread_pool_oversubscribe=4 fails to prevent sharp TPS drop at 120 client connections, though its shape improves as the number of connections increases.The drop from the maximum of 2485 TPS at 640 connections to 2304 TPS at 2560 connections is visible (7.5%), but not critical.
Interesting that the optimal number of groups is smaller than the number of physical CPU cores (40).
Another important observation is that in this test increase of the number of thread groups causes the TPS performance to drop: the curve with thread_pool_size=20 is below thread_pool_size=10 and thread_pool_size=40/80/120/160 are even lower.
Graph 1.1 – thread pool size variations [ INTERACTIVE GRAPH ][ TABLE ]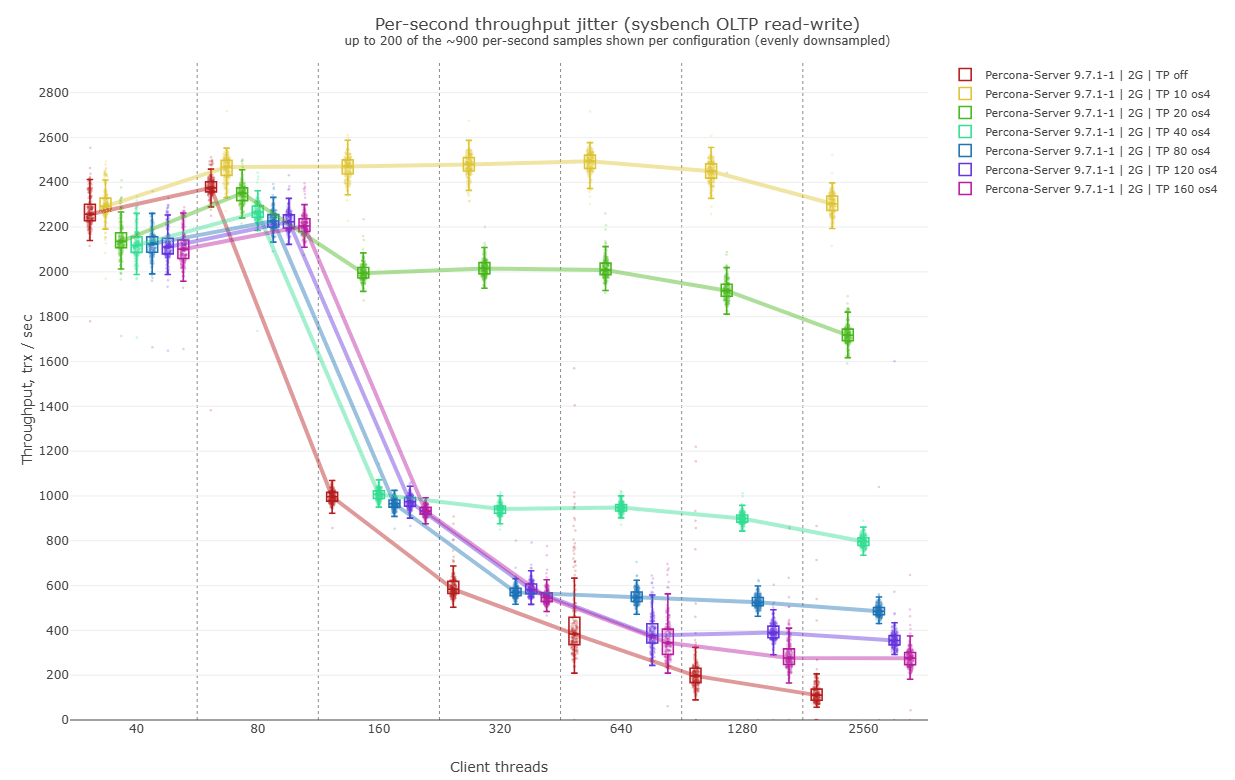
The next graph shows how TPS changes when we consider the optimal value for thread_pool_size=10, but change thread_pool_oversubscribe.
Graph 2.0 – oversubscription variations [ INTERACTIVE GRAPH ][ TABLE ]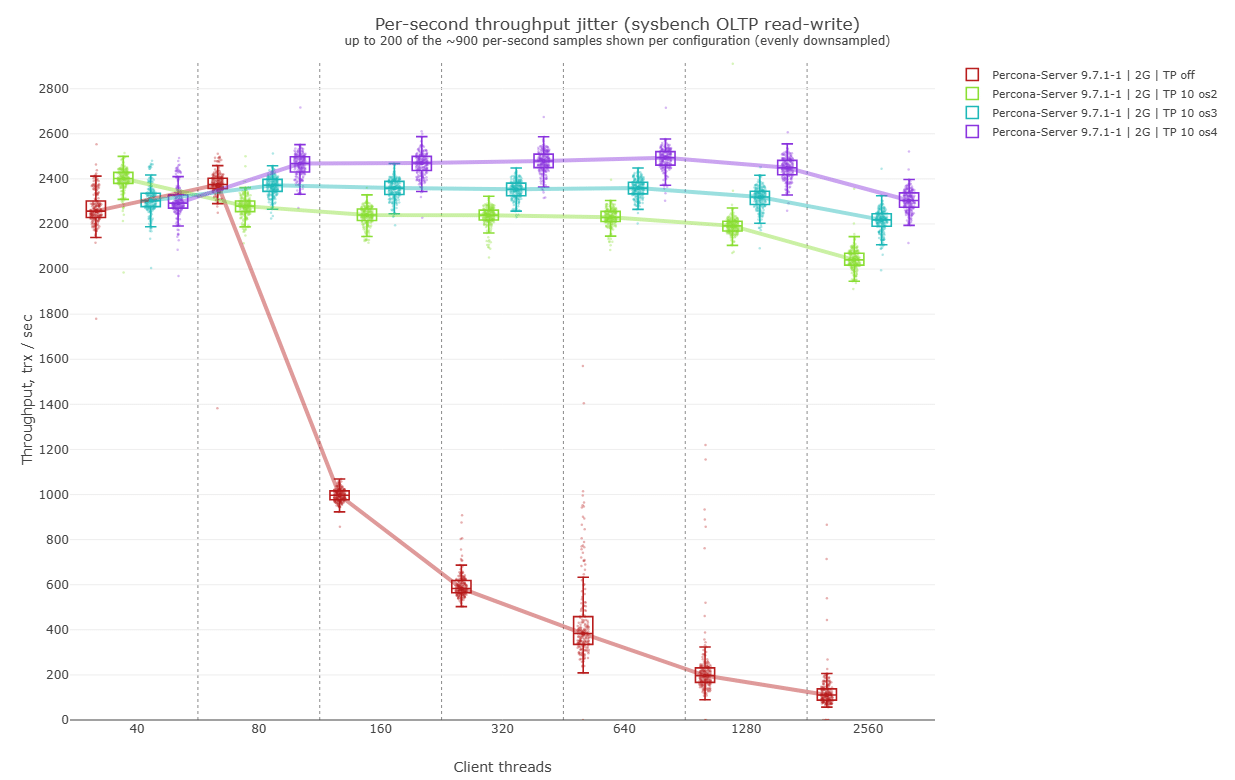
With the best configuration (thread_pool_oversubscribe=4) having 2304 TPS and the least performing pooling configuration (thread_pool_oversubscribe=2) with 2043 TPS the speed difference is 11%. So, a non-optimal oversubscription value can incur a significant penalty.
The above two cases correspond to the I/O bound scenario when the data size (24G) is much larger than the server buffer size (2G).
Let us see how the buffer pool efficiency changes as innodb_buffer_pool_size increased to 12G, which allows buffering approximately half of the data set.
Graph 3.0 – partially buffered data set (12G buffer) [ INTERACTIVE GRAPH ][ TABLE ]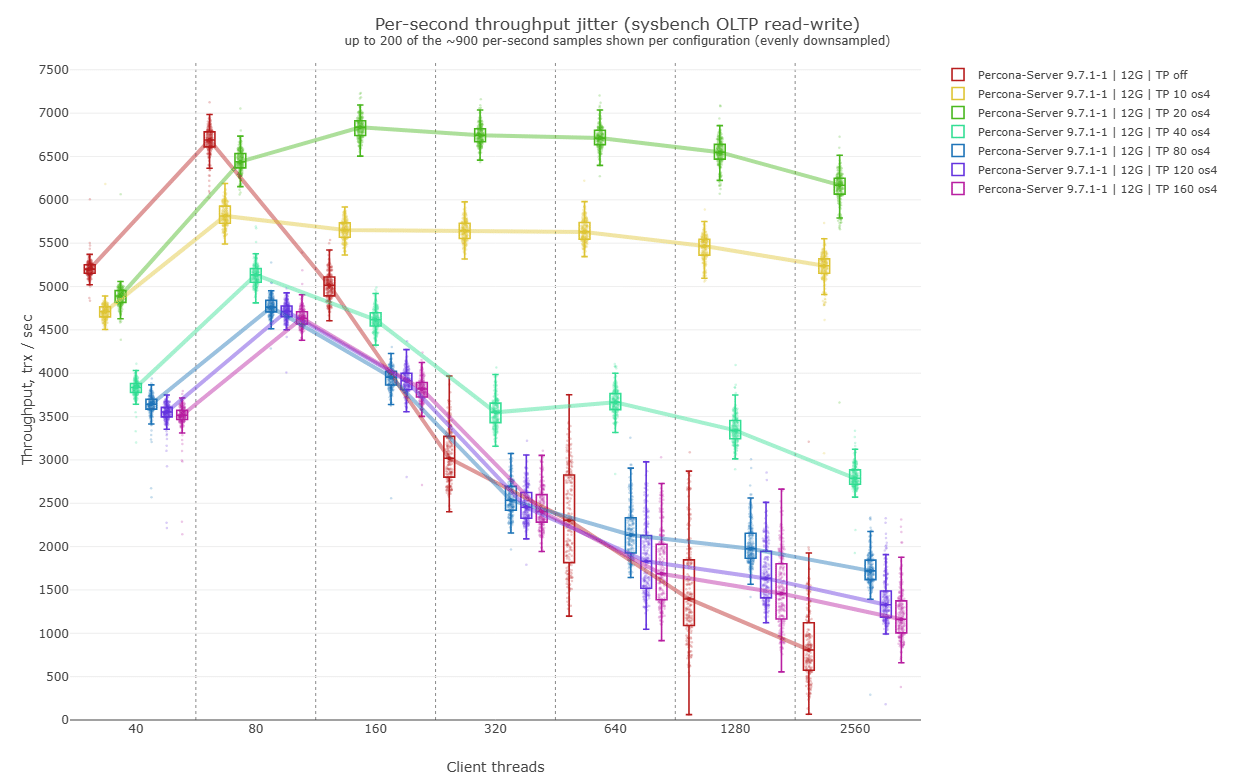
This time thread_pool_size=20 is the optimal value for the data size (24G) and the allocated server buffer size (12G). The non-optimal oversubscription values have a similar effect (look at INTERACTIVE GRAPH) on the performance as in Graph 2.0.
When the server configuration moves to the fully buffered data set the distribution of performance is changed:
Graph 4.0 – fully buffered data set (32G buffer) [ INTERACTIVE GRAPH ][ TABLE ]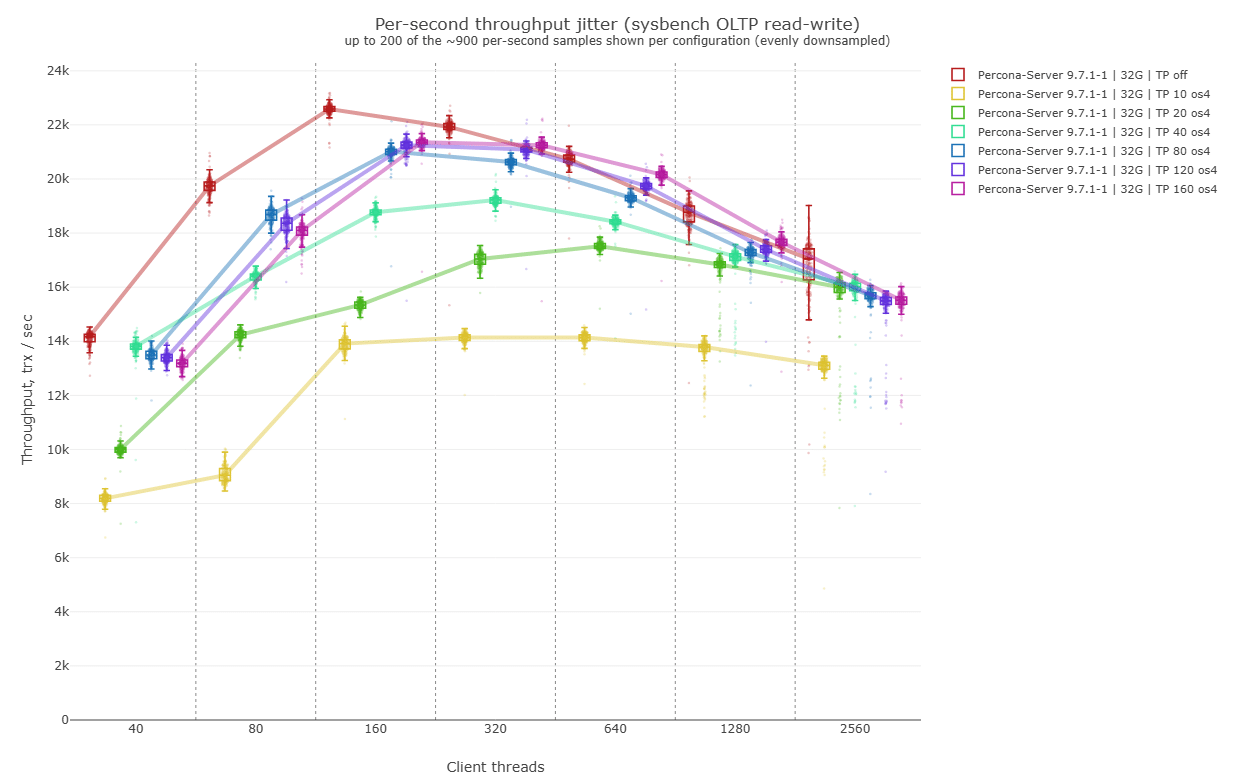
The configuration without the thread pool wins in all number of client connections in this test. The largest deviation from the base line is observed around 80 to 640 connections, but then the performance converses to around 16K TPS for all configurations. The configuration with thread_pool_size=10 is now the slowest one and larger thread pool sizes perform better.
Varying oversubscription did not have a notable effect with fully buffered data.
NOTE: It would be interesting to see if thread pool wins with 5K or 10K connections. We might do another research devoted to extremely high thread count, but this post describes the efficiency of the thread pool across the low (40) to the high (2560) number of client connection threads.
Despite not having superior performance with regards to TPS with the fully buffered data set, the thread pool is still beneficial with regards to predictability of the server behavior. What I mean by this is most of the clients (95%) connected to the server have their transactions executed quickly, but a minority (5%) have to wait much longer. The response latency for the unlucky 5% might be out of the acceptable range. The long waiting clients do not care about other clients whose data was quickly processed. Therefore, the raw TPS does not hold much value for them.
Graph 5.0 – p95 latency [ INTERACTIVE GRAPH ][ TABLE ]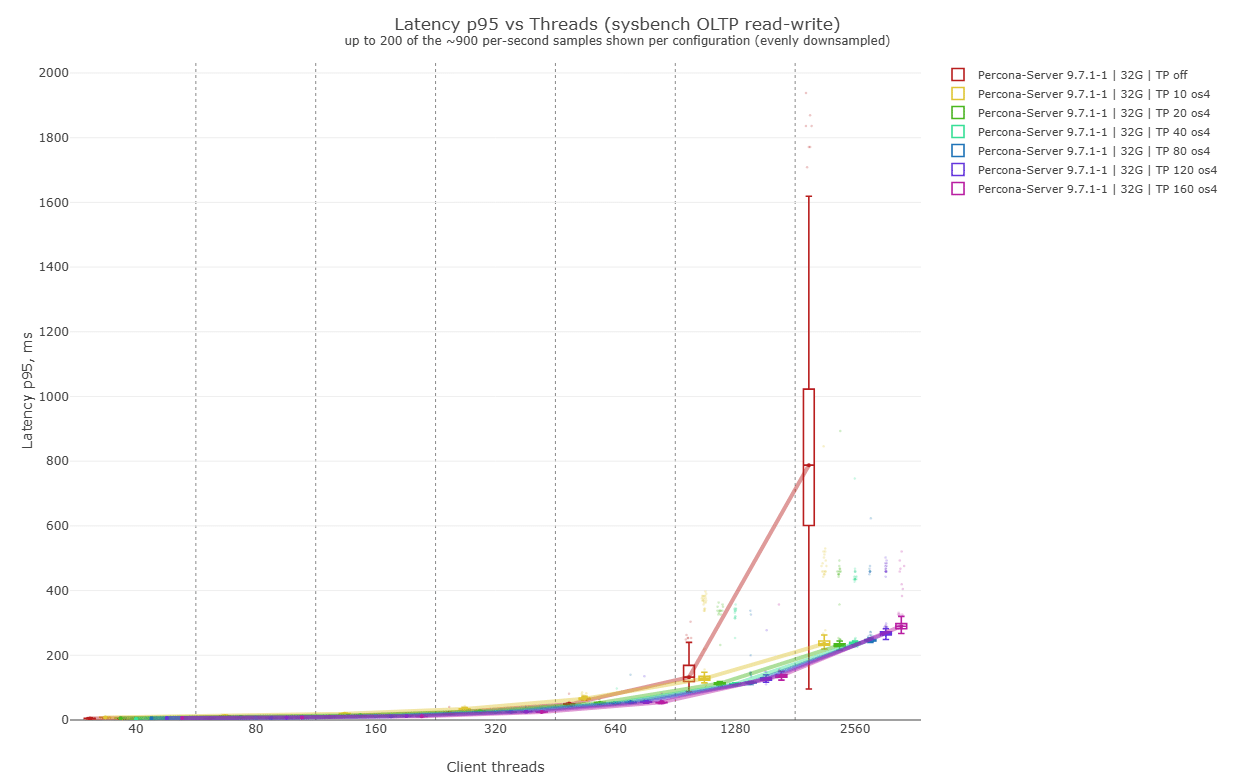
Unlike TPS when the higher value is better, the p95 Latency should be kept as low as possible.
Up to 1280 client connections the p95 latency was grouping around roughly the same numbers. However, for 2560 connections it changed dramatically. The configuration with disabled thread pooling suddenly demonstrated much longer p95 than the pooled counterparts.
The 5% of clients will have to wait longer than 787 ms if the thread pool is not used. The pooled configurations keep a much tighter range of 235-297 ms. The system performs as well as its slowest/weakest link and if a client application performs several transactions it is more likely to end up waiting significantly longer. For some outliers the latency reached 2000 ms.
Thread pooling does not bring any gains and even causes a small slow down on a low number of server connections.
The most visible effect of thread pooling can be seen in the scenario when I/O is one of the factors that limit performance.
Careful tuning of thread pool options is required to get the best performance. Even a seemingly small variation from optimal parameter values can cause large performance drops.
However, when properly configured, it can show spectacular results with almost 18 times TPS boost compared to the same server running without thread pool.
For system stability we should not only consider the raw TPS numbers, but also the latency related to processing of some transactions. Even if no TPS gain is obtained, the thread pool allows to minimize the waiting time for slowest transactions.
Resources
RELATED POSTS