
This PoC demonstrates how to install and configure pg_stat_monitor in order to extract useful and actionable metrics from a PostgreSQL database and display them on a Grafana dashboard.
In order to investigate the potential opportunities for implementing constructive and useful metrics derived from PostgreSQL into Grafana, it is necessary to generate loading using pgbench.
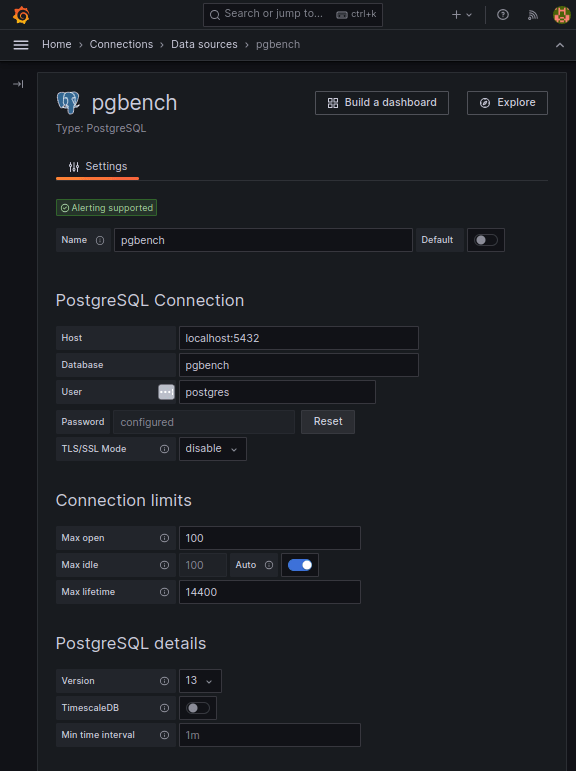
For our purposes, the Grafana datasource used in this PoC is also the Postgres data cluster that is generating the data to be monitored.
pg_stat_monitor is a Query Performance Monitoring tool for PostgreSQL. It collects various statistics data such as query statistics, query plan, SQL comments, and other performance insights. The collected data is aggregated and presented in a single view.
pg_stat_monitor takes its inspiration from pg_stat_statements. Unlike pg_stat_statements, which aggregates its metrics from the last time it was zeroed, pg_stat_monitor possesses the ability to bucket its output within a set number of aggregated results, thus saving user efforts from doing it themselves.
pg_stat_monitor tracks the following operations:
The simplest way to get pg_stat_monitor is to install it via Percona Distribution for PostgreSQL.
The following instructions demonstrate installing Percona Distribution for PostgreSQL and pg_stat_monitor on a CENTOS8 OS Linux distribution:
|
1 2 3 4 5 6 7 8 9 10 11 12 13 14 15 16 17 18 19 20 |
# Install The Percona Repository dnf install -y https://repo.percona.com/yum/percona-release-latest.noarch.rpm percona-release setup ppg14 # Install The postgres Community Repository dnf install -y https://download.postgresql.org/pub/repos/yum/reporpms/EL-8-x86_64/pgdg-redhat-repo-latest.noarch.rpm dnf update -y dnf install -y pg_stat_monitor_14 # perform standard initialization and systemd configurations /usr/pgsql-14/bin/postgresql-14-setup initdb # configure postgres to use pg_stat_monitor echo " shared_preload_libraries=pg_stat_monitor " >> /var/lib/pgsql/14/data/postgresql.auto.conf # complete postgres configuration systemctl enable postgresql-14 systemctl start postgresql-14 |
The pg_stat_monitor extension can be created in any database, but for the purposes of this PoC, it is placed in the database pgbench.
|
1 2 3 4 5 6 7 8 9 |
postgres=# create database pgbench; postgres=# c pgbench pgbench=# create extension pg_stat_monitor; pgbench=# d List of relations Schema | Name | Type | Owner --------+-----------------+------+---------- public | pg_stat_monitor | view | postgres |
|
1 2 3 4 5 6 7 8 9 10 11 12 13 14 15 16 17 18 19 20 21 22 23 24 25 26 27 28 29 30 31 32 33 34 35 36 37 38 39 40 41 42 43 44 45 46 47 48 49 50 51 52 53 54 55 56 57 58 |
View "public.pg_stat_monitor" Column | Type | Collation | Nullable | Default ---------------------+--------------------------+-----------+----------+--------- bucket | bigint | | | bucket_start_time | timestamp with time zone | | | userid | oid | | | username | text | | | dbid | oid | | | datname | text | | | client_ip | inet | | | pgsm_query_id | bigint | | | queryid | bigint | | | toplevel | boolean | | | top_queryid | bigint | | | query | text | | | comments | text | | | planid | bigint | | | query_plan | text | | | top_query | text | | | application_name | text | | | relations | text[] | | | cmd_type | integer | | | cmd_type_text | text | | | elevel | integer | | | sqlcode | text | | | message | text | | | calls | bigint | | | total_exec_time | double precision | | | min_exec_time | double precision | | | max_exec_time | double precision | | | mean_exec_time | double precision | | | stddev_exec_time | double precision | | | rows | bigint | | | shared_blks_hit | bigint | | | shared_blks_read | bigint | | | shared_blks_dirtied | bigint | | | shared_blks_written | bigint | | | local_blks_hit | bigint | | | local_blks_read | bigint | | | local_blks_dirtied | bigint | | | local_blks_written | bigint | | | temp_blks_read | bigint | | | temp_blks_written | bigint | | | blk_read_time | double precision | | | blk_write_time | double precision | | | resp_calls | text[] | | | cpu_user_time | double precision | | | cpu_sys_time | double precision | | | wal_records | bigint | | | wal_fpi | bigint | | | wal_bytes | numeric | | | bucket_done | boolean | | | plans | bigint | | | total_plan_time | double precision | | | min_plan_time | double precision | | | max_plan_time | double precision | | | mean_plan_time | double precision | | | stddev_plan_time | double precision | | | |
pgbench is a simple program executing benchmark tests on PostgreSQL by running the same sequence of SQL commands over and over. pgbench is capable of executing multiple concurrent database sessions and can calculate the average transaction rate (TPS) at the end of a run. Although the default configuration simulates loading based loosely upon TPC-B, it is nevertheless easy to test other use cases by writing one’s own transaction script files.
While it is reasonable to create panels showing real-time load in order to explore better the types of queries that can be run against pg_stat_monitor, it is more practical to copy and query the data into tables after the benchmarking has completed its run.
Save the data generated from a recently completed benchmark run into an archive table:
|
1 2 3 |
select * into pg_stat_monitor_archive from pg_stat_monitor order by bucket_start_time asc |
|
1 2 3 4 5 6 7 8 9 10 11 12 13 14 15 16 17 18 19 20 21 22 23 24 25 26 27 28 29 30 31 32 33 34 35 36 37 38 39 40 41 42 43 44 45 46 47 48 49 50 51 52 53 54 55 56 57 58 |
Table "public.pg_stat_monitor_archive" Column | Type | Collation | Nullable | Default --------------------+--------------------------+-----------+----------+--------- bucket | bigint | | | bucket_start_time | timestamp with time zone | | | userid | oid | | | username | text | | | dbid | oid | | | datname | text | | | client_ip | inet | | | pgsm_query_id | bigint | | | queryid | bigint | | | toplevel | boolean | | | top_queryid | bigint | | | query | text | | | comments | text | | | planid | bigint | | | query_plan | text | | | top_query | text | | | application_name | text | | | relations | text[] | | | cmd_type | integer | | | cmd_type_text | text | | | elevel | integer | | | sqlcode | text | | | message | text | | | calls | bigint | | | total_exec_time | double precision | | | min_exec_time | double precision | | | max_exec_time | double precision | | | mean_exec_time | double precision | | | stddev_exec_time | double precision | | | rows | bigint | | | shared_blks_hit | bigint | | | shared_blks_read | bigint | | | shared_blks_dirtied | bigint | | | shared_blks_written | bigint | | | local_blks_hit | bigint | | | local_blks_read | bigint | | | local_blks_dirtied | bigint | | | local_blks_written | bigint | | | temp_blks_read | bigint | | | temp_blks_written | bigint | | | blk_read_time | double precision | | | blk_write_time | double precision | | | resp_calls | text[] | | | cpu_user_time | double precision | | | cpu_sys_time | double precision | | | wal_records | bigint | | | wal_fpi | bigint | | | wal_bytes | numeric | | | bucket_done | boolean | | | plans | bigint | | | total_plan_time | double precision | | | min_plan_time | double precision | | | max_plan_time | double precision | | | mean_plan_time | double precision | | | stddev_plan_time | double precision | | | |
Extract this metric of interest, i.e., time vs total execution time:
|
1 2 3 4 |
select bucket_start_time, pgsm_query_id, queryid, total_exec_time into pg_stat_monitor_qry from pg_stat_monitor order by bucket_start_time asc |
|
1 2 3 4 5 6 7 8 |
pgbench=# d pg_stat_monitor_qry Table "public.pg_stat_monitor_qry" Column | Type | Collation | Nullable | Default -------------------+--------------------------+-----------+----------+--------- bucket_start_time | timestamp with time zone | | | pgsm_query_id | bigint | | | queryid | bigint | | | total_exec_time | double precision | | | |
Extract this metric of interest, i.e., time vs shared_blk io:
|
1 2 3 4 5 6 |
select bucket_start_time, pgsm_query_id, queryid, shared_blks_hit, shared_blks_read, shared_blks_dirtied, shared_blks_written into pg_stat_monitor_shared_blk_io from pg_stat_monitor_archive order by bucket_start_time asc; |
|
1 2 3 4 5 6 7 8 9 10 11 |
pgbench=# d pg_stat_monitor_shared_blk_io Table "public.pg_stat_monitor_shared_blk_io" Column | Type | Collation | Nullable | Default ---------------------+--------------------------+-----------+----------+--------- bucket_start_time | timestamp with time zone | | | pgsm_query_id | bigint | | | queryid | bigint | | | shared_blks_hit | bigint | | | shared_blks_read | bigint | | | shared_blks_dirtied | bigint | | | shared_blks_written | bigint | | | |
Note: this metric requires runtime parameter track_io_timing to be set on.
Extract this metric of interest, i.e., time vs. blk io:
|
1 2 3 4 |
select bucket_start_time, pgsm_query_id, queryid, blk_read_time, blk_write_time into pg_stat_monitor_blk_io from pg_stat_monitor_archive order by bucket_start_time asc; |
Save a copy of all unique query IDs in order to parse out future queries from the view.
Column pgsm_query_id identifies the query in such a manner that one can still identify the same query even when generated on other platforms under different loading conditions with different data:
|
1 2 3 4 5 6 7 |
with a as (select distinct on (pgsm_query_id) * from pg_stat_monitor_archive where application_name='pgbench') select cmd_type, cmd_type_text,pgsm_query_id, queryid,query as example_query into pg_stat_monitor_uniq_id from a order by cmd_type; |
|
1 2 3 4 5 6 7 8 9 |
pgbench=# d pg_stat_monitor_uniq_id Table "public.pg_stat_monitor_uniq_id" Column | Type | Collation | Nullable | Default ---------------+---------+-----------+----------+--------- cmd_type | integer | | | cmd_type_text | text | | | pgsm_query_id | bigint | | | queryid | bigint | | | example_query | text | | | |
This is an example set of queries generated by pgbench. Note the numbers in column pgsm_query_id are always the same values irrespective of hosts or environments:
|
1 2 |
select cmd_type_text, pgsm_query_id, example_query from pg_stat_monitor_uniq_id where cmd_type > 0; |
|
1 2 3 4 5 6 7 8 9 10 11 |
cmd_type_text | pgsm_query_id | example_query ---------------+----------------------+----------------------------------------------------------------- SELECT | -7455620703706695456 | SELECT abalance FROM pgbench_accounts WHERE aid = 16416498 UPDATE | -510321339504955469 | UPDATE pgbench_accounts SET abalance = abalance + 2063 WHERE aid = 1482568 UPDATE | 5276535447716615446 | UPDATE pgbench_branches SET bbalance = bbalance + 1384 WHERE bid = 7 UPDATE | 3629195281782908951 | UPDATE pgbench_tellers SET tbalance = tbalance + -2966 WHERE tid = 330 INSERT | -8751124061964589929 | INSERT INTO pgbench_history (tid, bid, aid, delta, mtime) VALUES (321, 56, 21104880, 4211, CURRENT_TIMESTAMP) |
Two types of performance monitoring are profiled:
Although the results of the benchmarking can be viewed by querying the view pg_stat_monitor you will note, as demonstrated by the bash script and SQL statements below, that the contents of the view is immediately copied and saved into a collection of tables. This is because the data will disappear over time as pg_stat_monitor cycles through its allotted number of buckets.
A script executing a benchmarking run:
|
1 2 3 4 5 6 7 8 9 10 11 12 13 14 15 16 17 18 19 20 21 22 23 24 25 26 27 28 29 30 31 32 33 34 35 36 37 38 39 40 41 42 43 44 45 46 47 48 49 50 51 52 53 54 55 56 57 58 59 60 61 62 63 64 65 66 67 68 |
#!/bin/bash # REFERENCE # https://docs.percona.com/pg-stat-monitor/reference.html # set -e export PGPASSWORD="MYPASSWORD" PGHOST='MYHOST' PGPORT=5434 PGUSER=postgres # # initialize benchmarking database # dropdb --if-exists pgbench createdb pgbench /usr/pgsql-12/bin/pgbench -i --foreign-keys -s 300 pgbench psql pgbench -c 'create extension pg_stat_monitor' # # configure pg_stat_monitor, requires system restart # psql postgres <<_eof_ -- set bucket time range, default is normally 60 seconds alter system set pg_stat_monitor.pgsm_bucket_time = '1min'; -- set number of buckets, default is normally 10 alter system set pg_stat_monitor.pgsm_max_buckets = 75; _eof_ systemctl restart postgresql@13-main psql postgres <<_eof_ -- zero pg_stat_monitor stats select * from pg_stat_monitor_reset(); _eof_ # # begin benchmarking run # # 4500 seconds (75 minutes) /usr/pgsql-12/bin/pgbench -U postgres -c 4 -j 2 -T 4500 -P 5 -b tpcb-like pgbench # # copy and save the benchmarking run into tables # psql postgres <<_eof_ drop table if exists pg_stat_monitor_archive, pg_stat_monitor_qry, pg_stat_monitor_uniq_id; select * into pg_stat_monitor_archive from pg_stat_monitor order by bucket_start_time; select bucket_start_time, pgsm_query_id, queryid, total_exec_time into pg_stat_monitor_qry from pg_stat_monitor_archive where application_name='pgbench'; with a as (select distinct on (pgsm_query_id) * from pg_stat_monitor_archive where application_name='pgbench') select cmd_type, cmd_type_text,pgsm_query_id, queryid,query as example_query into pg_stat_monitor_uniq_id from a order by cmd_type;; _eof_ echo "DONE" |
|
1 2 3 4 5 6 7 8 9 10 11 12 13 14 |
progress: 4435.0 s, 341.2 tps, lat 11.718 ms stddev 3.951 progress: 4440.0 s, 361.2 tps, lat 11.075 ms stddev 3.519 progress: 4445.0 s, 348.0 tps, lat 11.483 ms stddev 5.246 progress: 4450.0 s, 383.8 tps, lat 10.418 ms stddev 4.514 progress: 4455.0 s, 363.6 tps, lat 10.988 ms stddev 4.326 progress: 4460.0 s, 344.0 tps, lat 11.621 ms stddev 3.981 progress: 4465.0 s, 360.4 tps, lat 11.093 ms stddev 4.457 progress: 4470.0 s, 383.8 tps, lat 10.423 ms stddev 5.615 progress: 4475.0 s, 369.6 tps, lat 10.811 ms stddev 3.784 progress: 4480.0 s, 355.6 tps, lat 11.227 ms stddev 3.954 progress: 4485.0 s, 378.8 tps, lat 10.580 ms stddev 2.890 progress: 4490.0 s, 370.8 tps, lat 10.770 ms stddev 2.879 progress: 4495.0 s, 365.2 tps, lat 10.947 ms stddev 4.997 progress: 4500.0 s, 379.2 tps, lat 10.549 ms stddev 2.832 |
|
1 2 3 4 5 6 7 8 9 10 11 |
transaction type: <builtin: TPC-B (sort of)> scaling factor: 300 query mode: simple number of clients: 4 number of threads: 2 duration: 4500 s number of transactions actually processed: 1564704 latency average = 11.497 ms latency stddev = 4.800 ms tps = 347.711175 (including connections establishing) tps = 347.711731 (excluding connections establishing) |
Five (5) SQL statements are used to create this panel:
|
1 2 3 4 5 6 |
-- SELECT -- select bucket_start_time,total_exec_time as "SELECT" from pg_stat_monitor_qry join pg_stat_monitor_uniq_id using (pgsm_query_id) where a.cmd_type_text='SELECT' order by 1 asc; |
|
1 2 3 4 5 6 |
-- INSERT -- select bucket_start_time,total_exec_time as "INSERT" from pg_stat_monitor_qry join pg_stat_monitor_uniq_id using (pgsm_query_id) where a.cmd_type_text='INSERT' order by 1 asc; |
|
1 2 3 4 5 6 7 |
-- UPDATE 1 -- select bucket_start_time,total_exec_time as "UPDATE 1" from pg_stat_monitor_qry join pg_stat_monitor_uniq_id using (pgsm_query_id) where cmd_type_text='UPDATE' and pgsm_query_id = -510321339504955469 order by 1 asc; |
|
1 2 3 4 5 6 7 |
-- UPDATE 2 -- select bucket_start_time,total_exec_time as "UPDATE 2" from pg_stat_monitor_qry join pg_stat_monitor_uniq_id using (pgsm_query_id) where cmd_type_text='UPDATE' and pgsm_query_id = 5276535447716615446 order by 1 asc; |
|
1 2 3 4 5 6 7 |
-- UPDATE 3 -- select bucket_start_time,total_exec_time as "UPDATE 3" from pg_stat_monitor_qry join pg_stat_monitor_uniq_id using (pgsm_query_id) where cmd_type_text='UPDATE' and pgsm_query_id = 3629195281782908951 order by 1 asc; |
|
1 2 3 4 5 6 7 8 |
-- INSERT (ins_[hit|read|dirty|write]) -- select bucket_start_time, shared_blks_hit as ins_hit, shared_blks_read as ins_read, shared_blks_dirtied as ins_dirt, shared_blks_written as ins_writ from pg_stat_monitor_shared_blk_io join pg_stat_monitor_uniq_id using (pgsm_query_id) where cmd_type_text='INSERT' order by 1 asc; |
|
1 2 3 4 5 6 7 8 9 |
-- UPDATE 1 (update1_[hit|read|dirty|write]) -- select bucket_start_time, shared_blks_hit as update1_hit, shared_blks_read as update1_read, shared_blks_dirtied as update1_dirt, shared_blks_written as update1_writ from pg_stat_monitor_shared_blk_io join pg_stat_monitor_uniq_id using (pgsm_query_id) where cmd_type_text='UPDATE' and pgsm_query_id = -510321339504955469 order by 1 asc; |
|
1 2 3 4 5 6 7 8 9 |
-- UPDATE 2 (update2_[hit|read|dirty|write]) -- select bucket_start_time, shared_blks_hit as update2_hit, shared_blks_read as update2_read, shared_blks_dirtied as update2_dirt, shared_blks_written as update2_writ from pg_stat_monitor_shared_blk_io join pg_stat_monitor_uniq_id using (pgsm_query_id) where cmd_type_text='UPDATE' and pgsm_query_id = 5276535447716615446 order by 1 asc; |
|
1 2 3 4 5 6 7 8 9 |
-- UPDATE 3 (update3_[hit|read|dirty|write]) -- select bucket_start_time, shared_blks_hit as update3_hit, shared_blks_read as update3_read, shared_blks_dirtied as update3_dirt, shared_blks_written as update3_writ from pg_stat_monitor_shared_blk_io join pg_stat_monitor_uniq_id using (pgsm_query_id) where cmd_type_text='UPDATE' and pgsm_query_id = 3629195281782908951 order by 1 asc; |
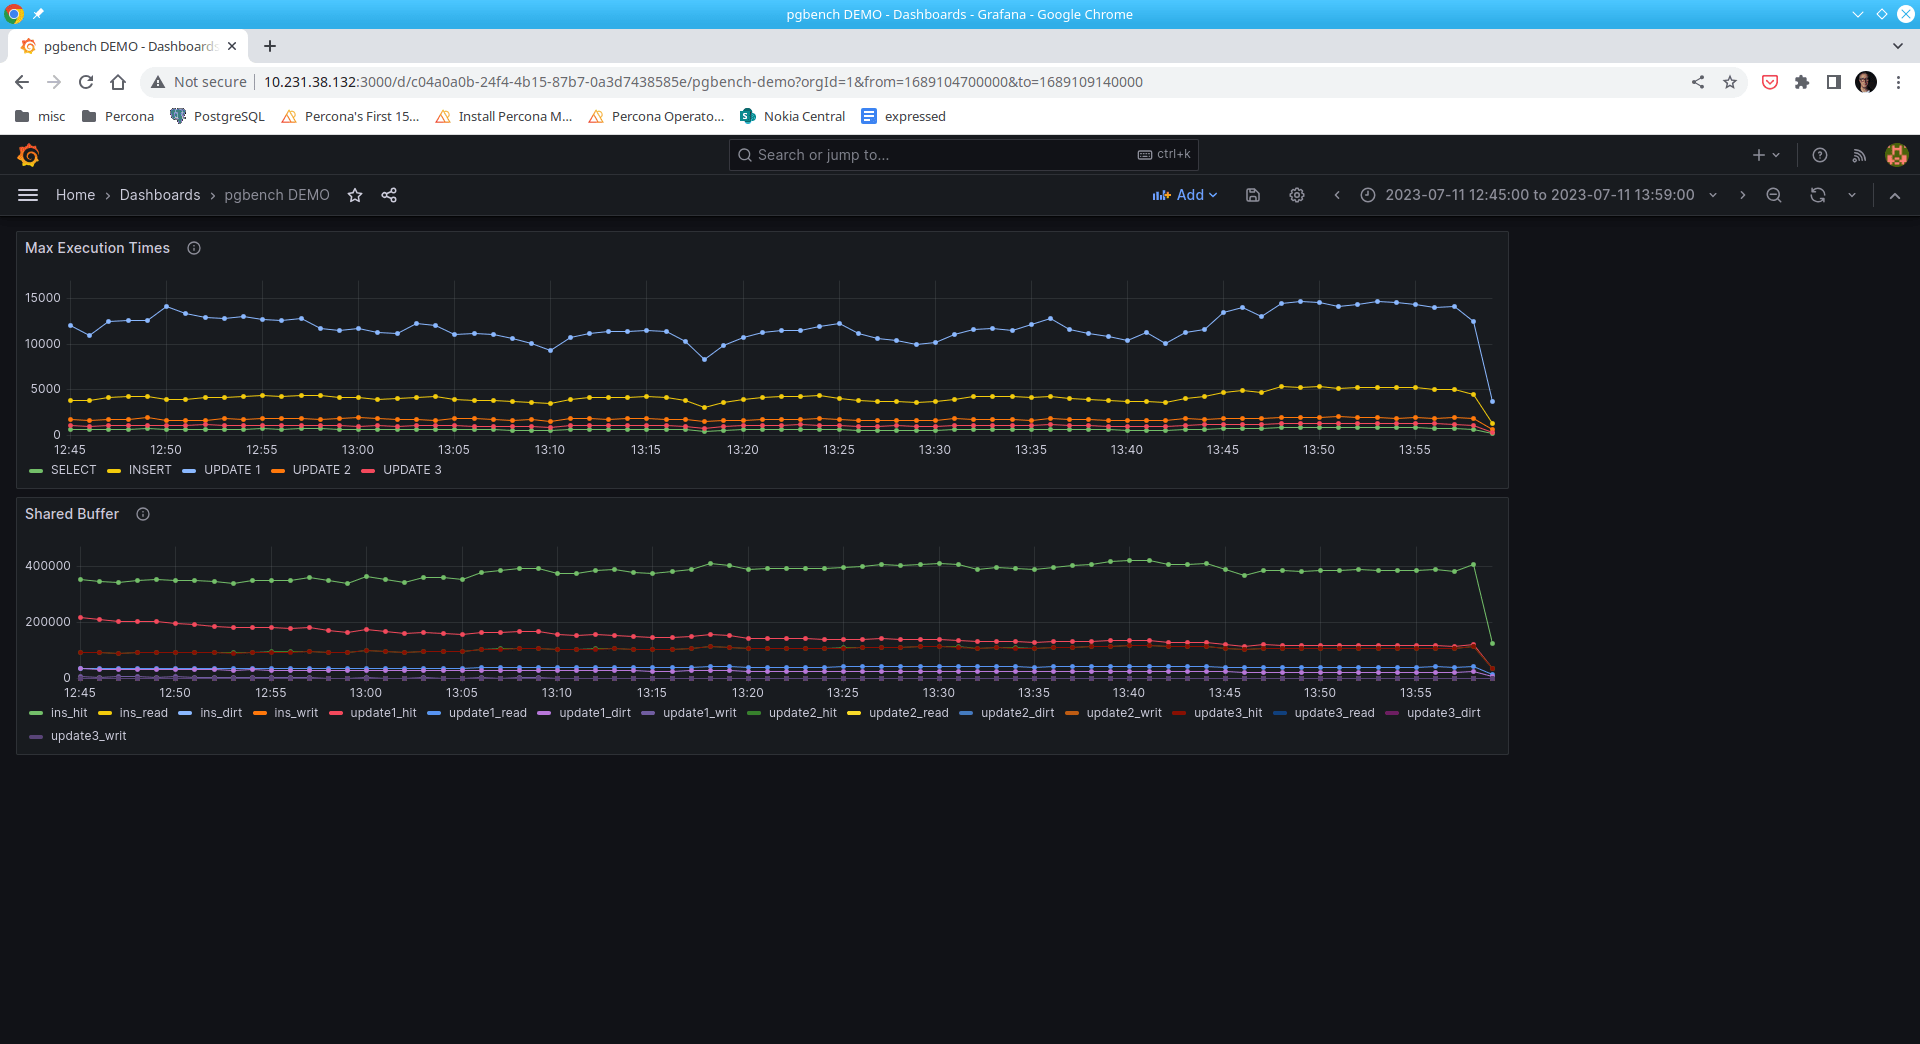
Here are some example patterns that can be discerned:
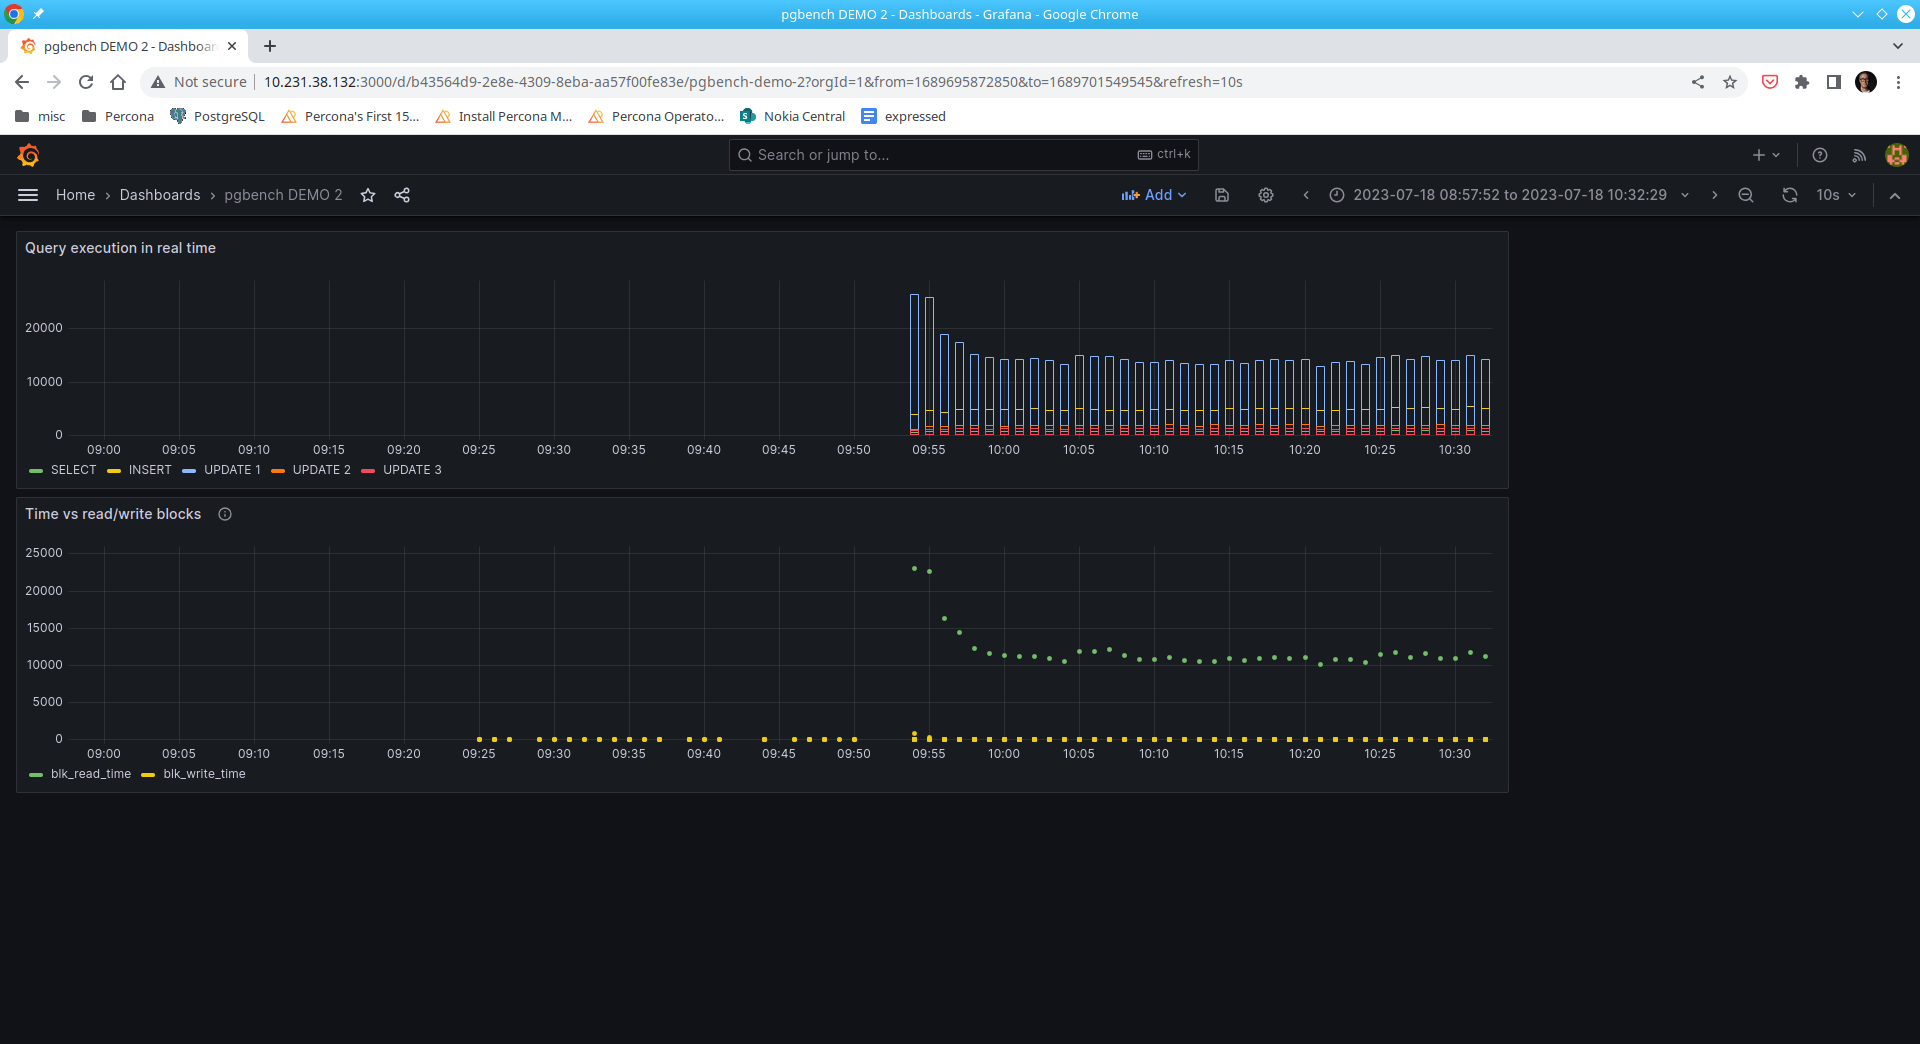
These two panels show read/write IO performance to the persistent storage while benchmarking a live run.
|
1 2 3 4 5 6 |
-- SELECT -- select bucket_start_time,total_exec_time as "SELECT" from pg_stat_monitor join pg_stat_monitor_uniq_id a using (pgsm_query_id) where a.cmd_type_text='SELECT' order by 1 asc; |
|
1 2 3 4 5 6 |
-- INSERT -- select bucket_start_time,total_exec_time as "INSERT" from pg_stat_monitor join pg_stat_monitor_uniq_id a using (pgsm_query_id) where a.cmd_type_text='INSERT' order by 1 asc; |
|
1 2 3 4 5 6 7 |
-- UPDATE 1 -- select bucket_start_time,total_exec_time as "UPDATE 1" from pg_stat_monitor join pg_stat_monitor_uniq_id a using (pgsm_query_id) where a.cmd_type_text='UPDATE' and pgsm_query_id = -510321339504955469 order by 1 asc; |
|
1 2 3 4 5 6 7 |
-- UPDATE 2 -- select bucket_start_time,total_exec_time as "UPDATE 2" from pg_stat_monitor join pg_stat_monitor_uniq_id a using (pgsm_query_id) where a.cmd_type_text='UPDATE' and pgsm_query_id = 5276535447716615446 order by 1 asc; |
|
1 2 3 4 5 6 7 |
-- UPDATE 3 -- select bucket_start_time,total_exec_time as "UPDATE 3" from pg_stat_monitor join pg_stat_monitor_uniq_id a using (pgsm_query_id) where a.cmd_type_text='UPDATE' and pgsm_query_id = 3629195281782908951 order by 1 asc; |
|
1 2 3 |
-- time vs read/write blocks (blk_read_time, blk_write_time -- track_io_timing is on select bucket_start_time, blk_read_time, blk_write_time from public.pg_stat_monitor; |
It’s quite easy to observe that SQL statement UPDATE 1 represents the bulk of the read operations.
|
1 2 |
-- example SQL statement UPDATE pgbench_accounts SET abalance = abalance + 2063 WHERE aid = 1482568 |
Interestingly, writes are not as significant as reads.
I’m excited about pg_stat_monitor. Not only can it be used in Grafana, but it’s easily implemented in any monitoring solution, including our own Percona Monitoring and Management. It’s also incorporated in our latest version of Percona Operator for PostgreSQL.
Pg_stat_monitor is an obvious, common sense improvement over pg_stat_statement’s greatest limitation i.e., its inability to bucket metrics over time intervals. And to be frankly honest, I can see the pg_stat_monitor extension eventually replacing pg_stat_statement as the defacto extension monitoring Postgres when it comes to real-time analysis.
Happy monitoring!
Percona Distribution for PostgreSQL provides the best and most critical enterprise components from the open-source community, in a single distribution, designed and tested to work together.
Resources
RELATED POSTS


Wondering where is prometheus used or what is it used for, because it seems that the datasource is PG itself.
‘+1
And PMM uses VictoriaMetrics instead of Prometheus anyway.
That is correct pg_stat_monitor is capable of standalone servicing since the metrics reside on the production machine itself.
Hope this helps