

We are pleased to announce the launch of PMM 2.0.0-alpha1, Percona’s first Alpha release of our long-awaited PMM 2 project! We focused exclusively on MySQL support in our first Alpha (because we wanted to show progress sooner rather than later), and you’ll find updated MySQL dashboards along with enhancements to Query Analytics. We’ve also added better visibility regarding which services are registered with PMM Server, the client-side addition of a new agent called pmm-agent, and finally PMM Server is now exposing an API!
PMM 2 is still a work in progress – expect to see bugs and other missing features! We are aware of a number of issues, but please report any and all that you find to Percona’s JIRA.
Query Analytics Dashboard now defaults to display all queries on each of the systems that are configured for MySQL PERFORMANCE_SCHEMA, Slow Log, and MongoDB Profiler (this release includes support for MySQL PERFORMANCE SCHEMA only), and includes comprehensive filtering capabilities.
You’ll recognize some of the common elements in PMM 2 Query Analytics such as the Load, Count, and Latency columns, however there are new elements such as the filter box and more arrows on the columns which will be described further down:
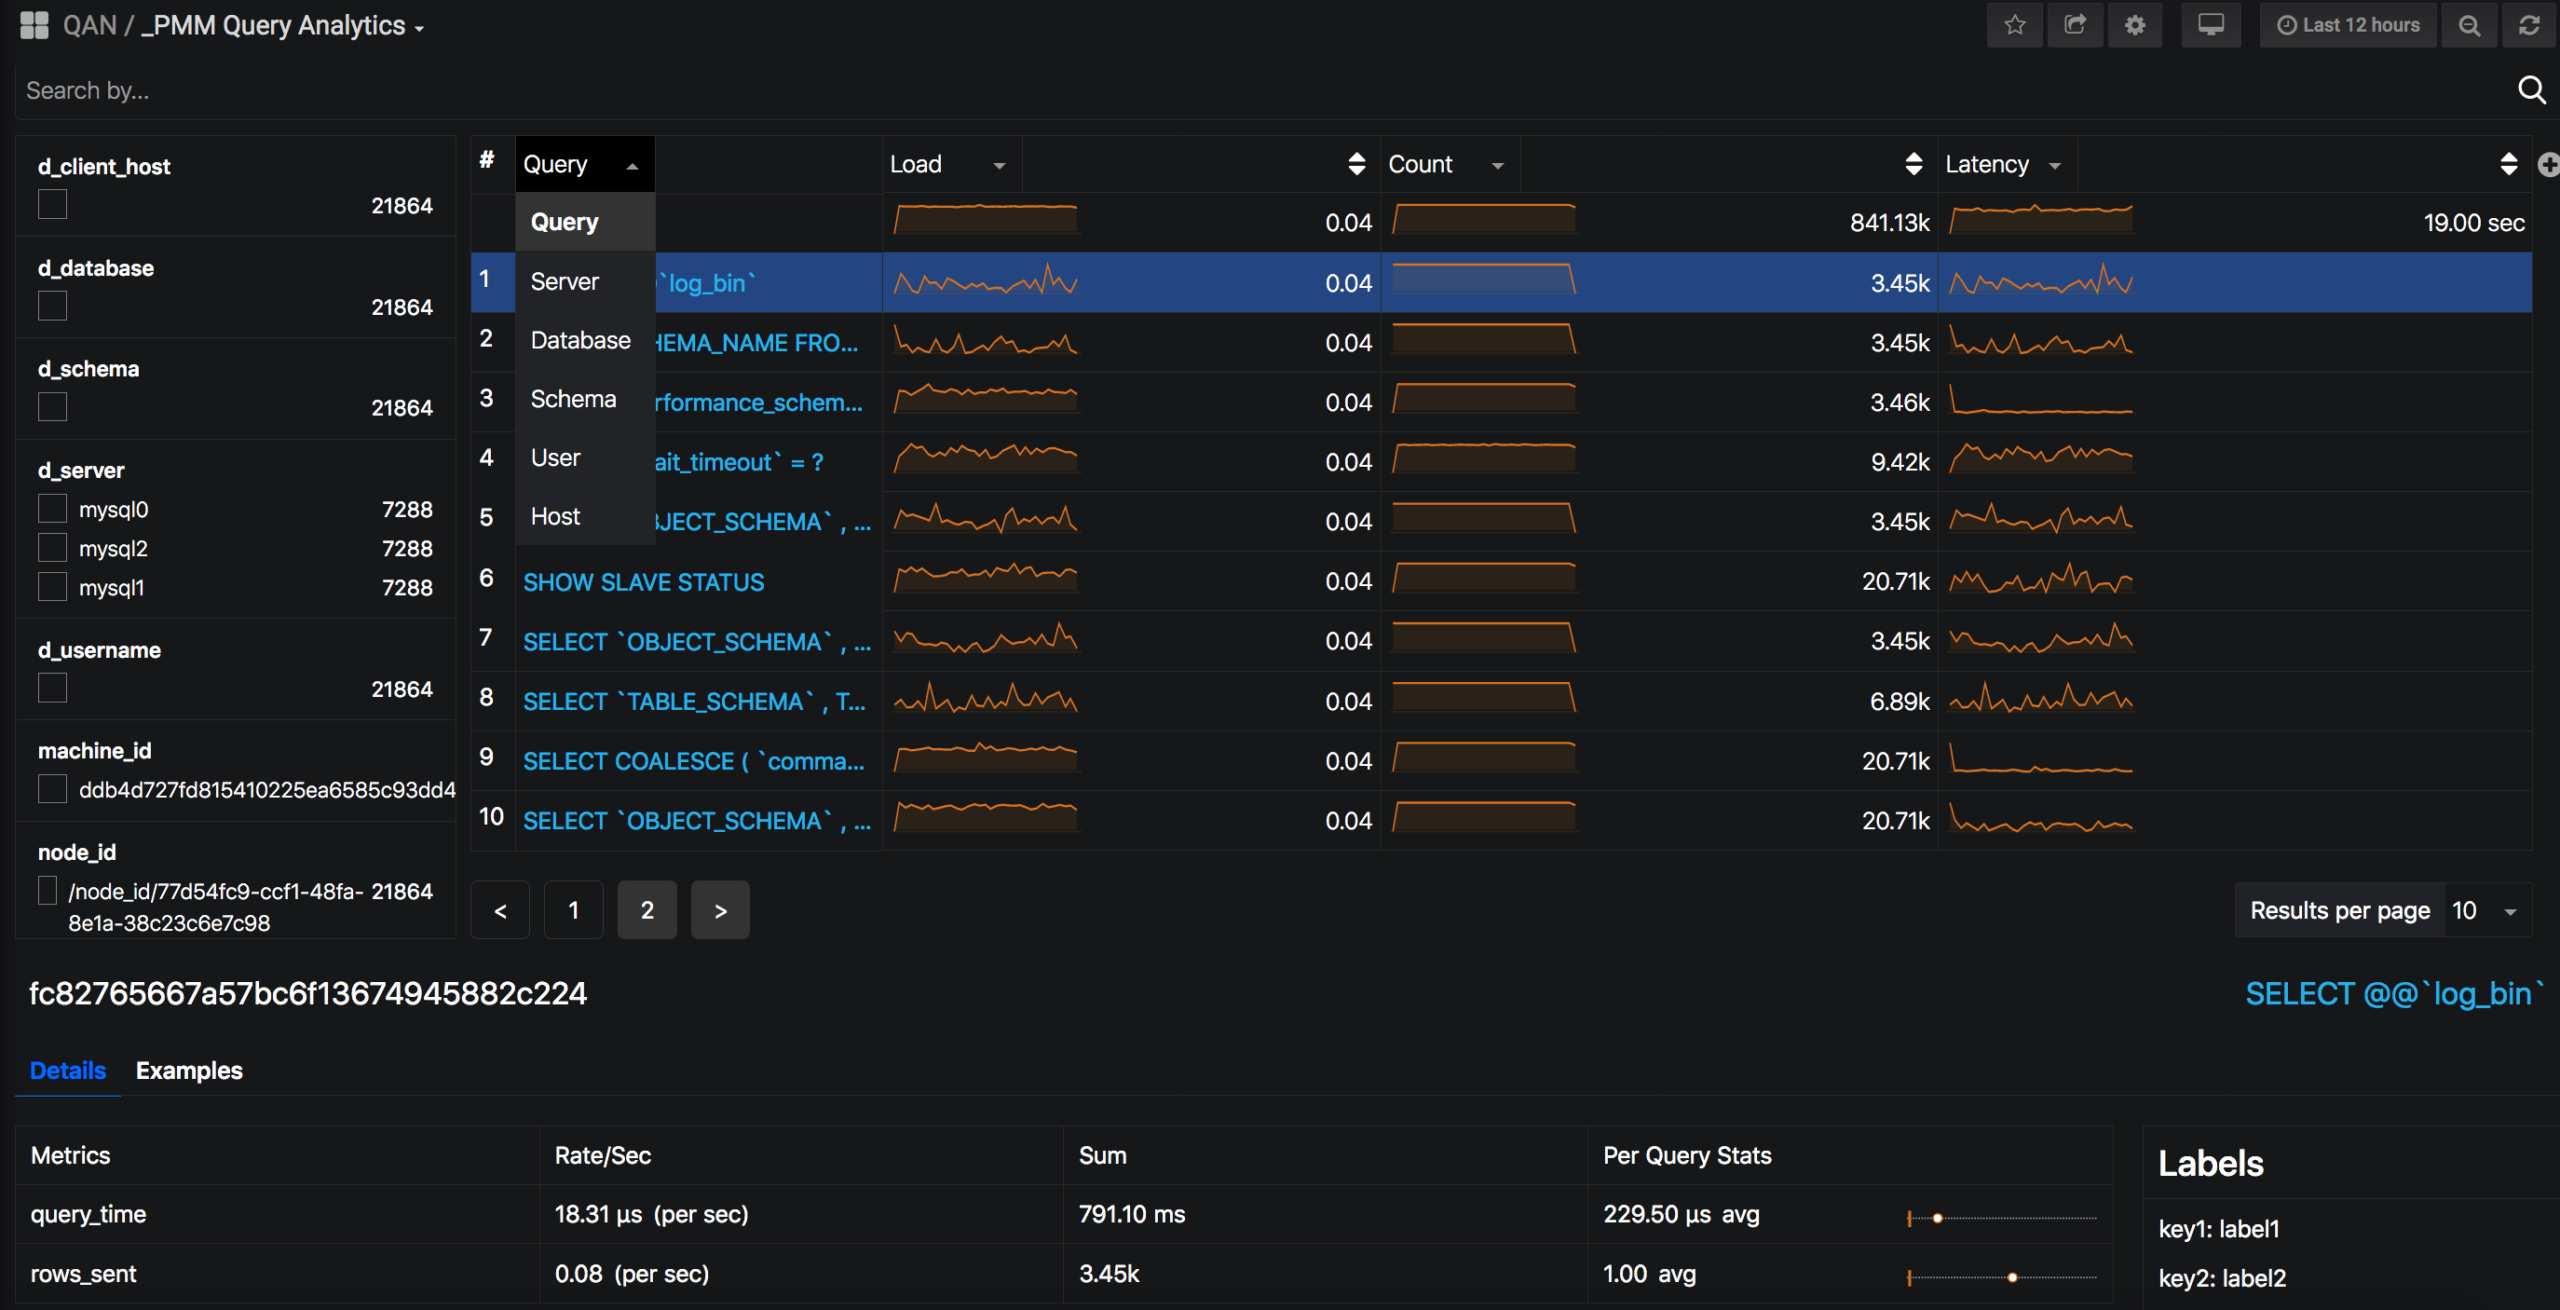
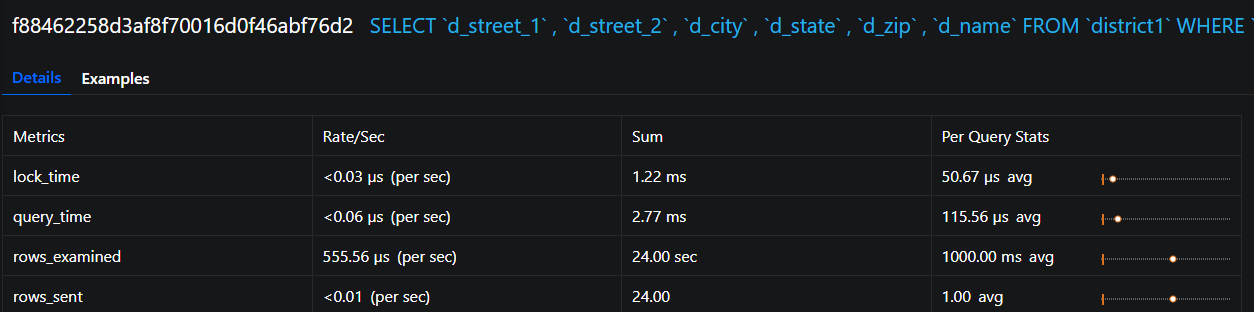
Query Analytics continues to deliver detailed information regarding individual query performance:
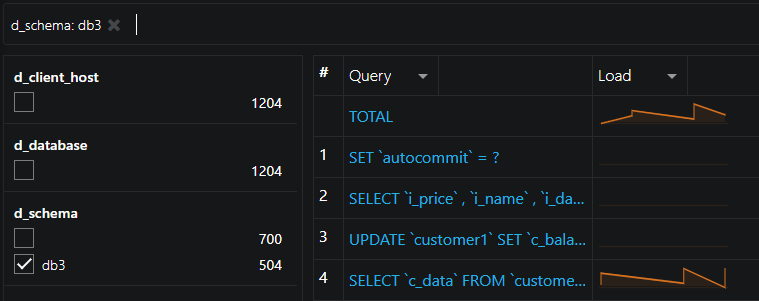
Filtering panel on the left, or use the search by bar to set filters using key:value syntax, for example, I’m interested in just the queries that are executed in MySQL schema db3, I could then type d_schema:db3:
This is a much requested feature from PMM Query Analytics and we’re glad to announce that you can sort by any column! Just click the small arrow to the right of the column name and
Now you can add a column for each additional field which is exposed by the data source. For example you can add Rows Examined by clicking the + sign and typing or selecting from the available list of fields:
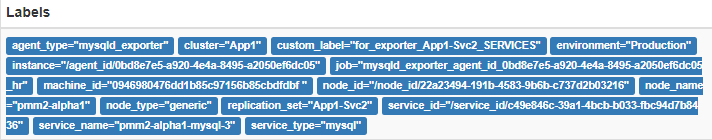
An important concept we’re introducing in PMM 2 is that when a label is assigned it is persisted in both the Metrics (Prometheus) and Query Analytics (Clickhouse) databases. So when you browse a target in Prometheus you’ll notice many more labels appear – particularly the auto-discovered (replication_set, environment, node_name, etc.) and (soon to be released) custom labels via custom_label.
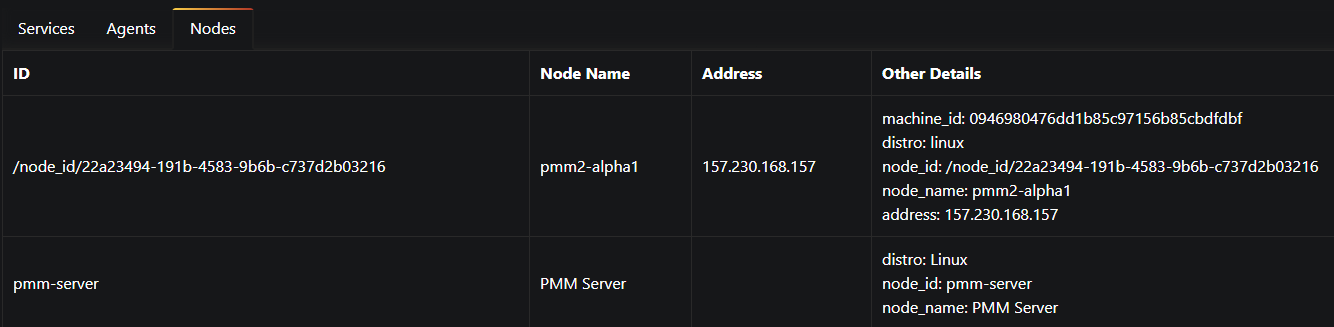
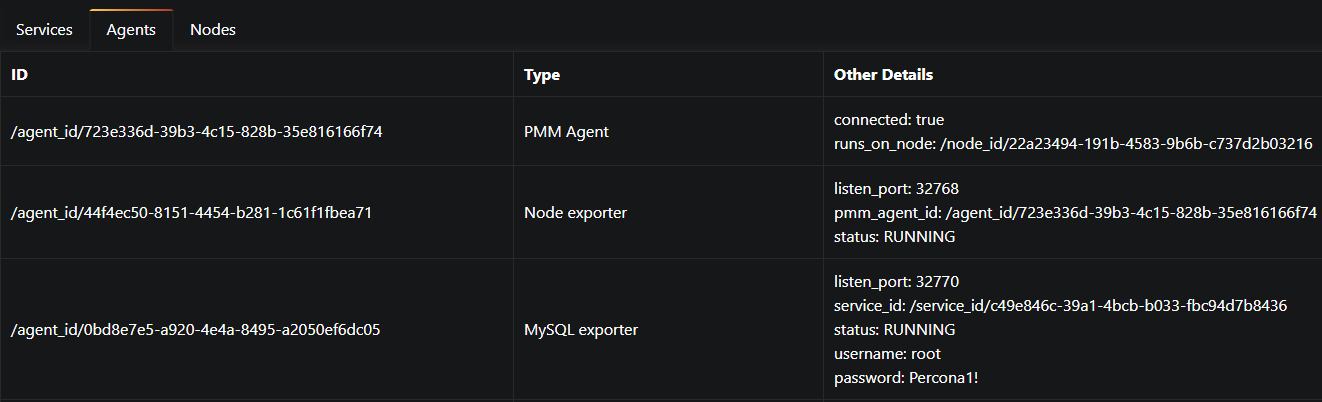
We’ve introduced a new dashboard with several tabs so that users are better able to understand which nodes, agents, and services are registered against PMM Server. We have an established hierarchy with Node at the top, then Service and Agents assigned to a Node.
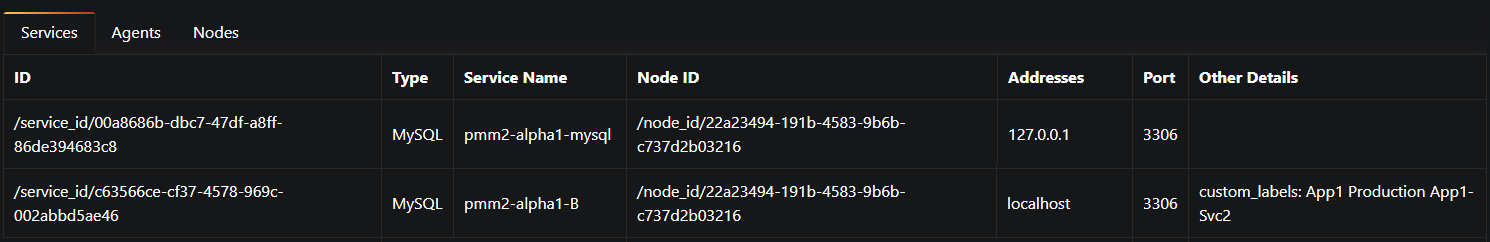
You can now see which services, agents, and nodes are registered with PMM Server.
In this example I have PMM Server (docker) running on the same virtualized compute instance as my Percona Server 5.7 instance, so PMM treats this as two different nodes.
This example has two MySQL services configured:
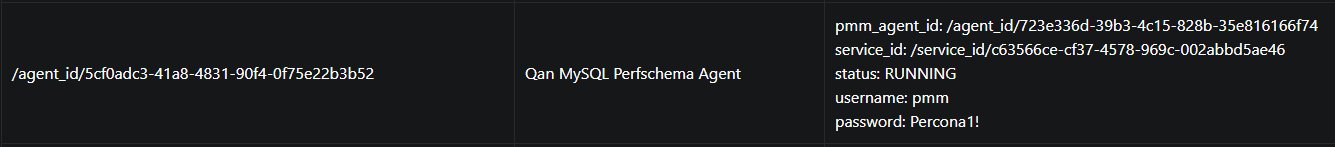
For a monitored Percona Server instance, you’ll see an agent for each of:
Query Analytics now provides you with the opportunity to filter based on labels. We’ are beginning with labels that are sourced from MySQL Performance Schema, but eventually will include all fields from MySQL Slow Log, MongoDB Profiler, and PostgreSQL views. We’ll also be offering the ability to set custom key:value pairs which you’ll use when setting up a new service or instance with pmm-admin during the add ... routine.
We’re exposing four new filters in this release, and we show where we source them from and what they mean:
| Filter name | Source | Notes |
| d_client_host | MySQL Slow Log | MySQL PERFORMANCE_SCHEMA doesn’t include client host, so this field will be empty |
| d_username | MySQL Slow Log | MySQL PERFORMANCE_SCHEMA doesn’t include username, so this field will be empty |
| d_schema | MySQL Slow Log
MySQL Perfschema |
MySQL Schema name |
| d_server | MySQL Slow Log
MySQL Perfschema |
MySQL server instance |
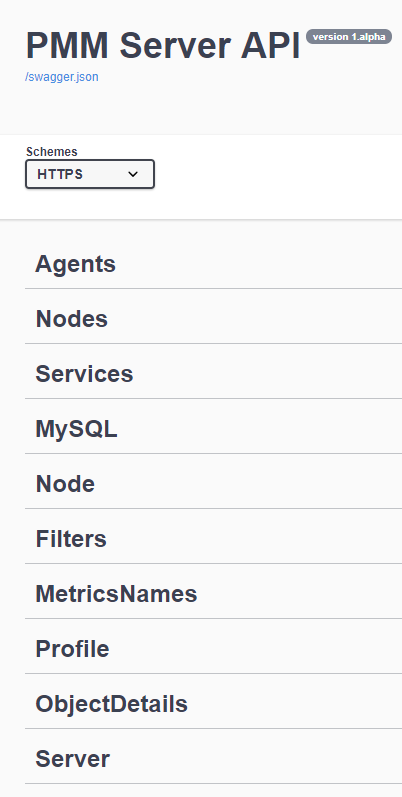
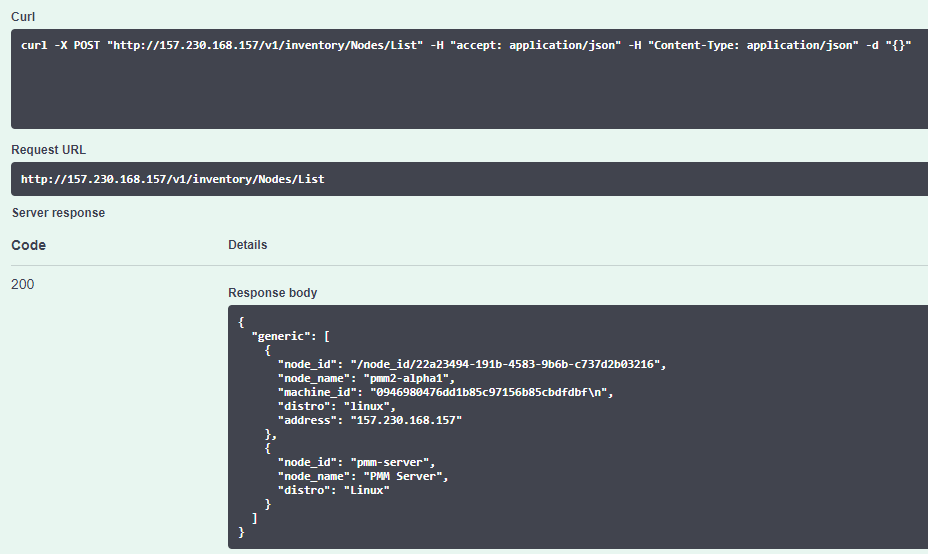
We are exposing an API for PMM Server! You can view versions, list hosts, and more!
The API is not guaranteed to work until we get to our GA release – so be prepared for breaking changes during our Alpha and Beta releases.
Browse the API using Swagger at /swagger
 |
 |
|---|
The easiest way to install PMM Server is to deploy it with Docker. You can run a PMM 2 Docker container with PMM Server by using the following commands (note the version tag of 2.0.0-alpha1):
|
1 2 |
docker create -v /srv --name pmm-data-2-0-0-alpha1 perconalab/pmm-server:2.0.0-alpha1 /bin/true docker run -d -p 80:80 -p 443:443 --volumes-from pmm-data-2-0-0-alpha1 --name pmm-server-2.0.0-alpha1 --restart always perconalab/pmm-server:2.0.0-alpha1 |
Since PMM 2 is still not GA, you’ll need to leverage our experimental release of the Percona repository. You’ll need to download and install the official percona-release package from Percona, and use it to enable the Percona experimental component of the original repository. Specific instructions for a Debian system are as follows:
|
1 2 |
wget https://repo.percona.com/apt/percona-release_latest.generic_all.deb sudo dpkg -i percona-release_latest.generic_all.deb |
Now enable the correct repo:
|
1 2 |
sudo percona-release disable all sudo percona-release enable original experimental |
Now install the pmm2-client package:
|
1 2 |
apt-get update apt-get install pmm2-client |
See percona-release official documentation for details.
Please note that having experimental packages enabled may affect further packages installation with versions which are not ready for production. To avoid this, disable this component with the following commands:
|
1 2 |
sudo percona-release disable original experimental sudo apt-get update |
Once PMM Client is installed, run the pmm-admin setup command with your PMM Server IP address to register your Node within the Server:
|
1 |
# pmm-agent setup --server-insecure-tls --server-address=<IP Address>:443 |
We will be moving this functionality back to pmm-admin config in a subsequent Alpha release.
You should see the following:
|
1 2 3 4 5 6 7 |
Checking local pmm-agent status... pmm-agent is running. Registering pmm-agent on PMM Server... Registered. Configuration file /usr/local/percona/pmm-agent.yaml updated. Reloading pmm-agent configuration... Configuration reloaded. |
You then add MySQL services (Metrics and Query Analytics) with the following command:
|
1 |
# pmm-admin add mysql --use-perfschema --username=pmm --password=pmm |
where username and password are credentials for the monitored MySQL access, which will be used locally on the database host.
After this you can view MySQL metrics or examine the added node on the new PMM Inventory Dashboard:
You can then check your MySQL dashboards and Query Analytics in order to view your server’s performance information!
We hope you enjoy this release, and we welcome your comments on the blog!
Percona Monitoring and Management (PMM) is a free and open-source platform for managing and monitoring MySQL®, MongoDB®, and PostgreSQL performance. You can run PMM in your own environment for maximum security and reliability. It provides thorough time-based analysis for MySQL®, MongoDB®, and PostgreSQL® servers to ensure that your data works as efficiently as possible.
Help us improve our software quality by reporting any Percona Monitoring and Management bugs you encounter using our bug tracking system.
Resources
RELATED POSTS


Hi guys, nice work. I’ll be waiting for GA release and the procedure for upgrade from my 1.17.1 version.
Thanks @Fernando Ipar!
Good job guys.
What is the default login for the PMM (container based).
I tried root / percona and root nothing – both didnt work.
Kind Regards
It is admin / admin.
ok further problems
pmm 2.0 alpha webinterface works fine
when trying to add the agent following the above commands
how can 443 work when container is initially configured to run on port 80??
port 80 doesnt work either though nor does without any port
how to proceed?
pmm-agent setup –server-insecure-tls –server-address=http://172.16.127.82:443
Checking local pmm-agent status…
pmm-agent is running.
Registering pmm-agent on PMM Server…
Failed to register pmm-agent on PMM Server: Post https://http:%2F%2F172.16.127.82:443/v1/management/Node/Register: invalid URL port “//172.16.127.82:443”.
root@ubu1804template:~# pmm-agent setup –server-insecure-tls –server-address=http://172.16.127.82
Checking local pmm-agent status…
pmm-agent is running.
Registering pmm-agent on PMM Server…
Failed to register pmm-agent on PMM Server: Post https://http:%2F%2F172.16.127.82/v1/management/Node/Register: invalid URL port “//172.16.127.82”.
root@ubu1804template:~# pmm-agent setup –server-insecure-tls –server-address=http://172.16.127.82:80
Checking local pmm-agent status…
pmm-agent is running.
Registering pmm-agent on PMM Server…
Failed to register pmm-agent on PMM Server: Post https://http:%2F%2F172.16.127.82:80/v1/management/Node/Register: invalid URL port “//172.16.127.82:80”.
this is how it looks on the dockerhost
root@t-pmm-sv-01:~# netstat -tulpen
Active Internet connections (only servers)
Proto Recv-Q Send-Q Local Address Foreign Address State User Inode PID/Program name
tcp 0 0 0.0.0.0:9000 0.0.0.0:* LISTEN 0 727048 1959/docker-proxy
tcp 0 0 0.0.0.0:80 0.0.0.0:* LISTEN 0 725319 2251/docker-proxy
tcp 0 0 127.0.0.53:53 0.0.0.0:* LISTEN 101 19161 827/systemd-resolve
tcp 0 0 0.0.0.0:22 0.0.0.0:* LISTEN 0 22712 1191/sshd
tcp 0 0 0.0.0.0:443 0.0.0.0:* LISTEN 0 727296 2237/docker-proxy
udp 0 0 127.0.0.53:53 0.0.0.0:* 101 19160 827/systemd-resolve
udp 0 0 172.16.127.82:68 0.0.0.0:* 100 564878 782/systemd-network
so my comment about this not working was deleted?
following the steps in the article agent cant connect / communicate with pmm server
Hi @andrews2018
Can I suggest you post your scenario to https://www.percona.com/forums/questions-discussions/percona-monitoring-and-management/ and we can take a look?
ok posted it in the forums
waiting for moderation again…
Hi @andrews2018 , I saw on the forums you now have a fully functional PMM 2 environment 🙂
https://www.percona.com/forums/questions-discussions/percona-monitoring-and-management/53982-pmm-2-0-0-alpha1-client-cannot-connect-to-server