
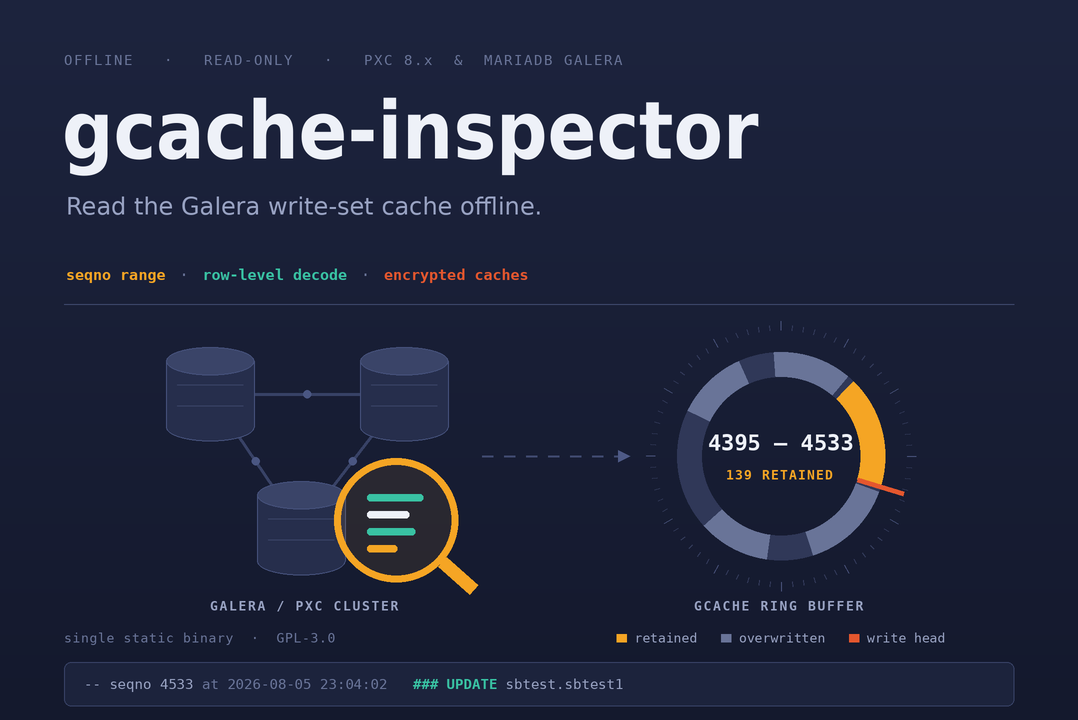
The common practice is to size the Galera Cache based on write volume measured during peak load, but often it is more of a guesswork. The writeset cache capacity planning is crucial to shorten the maintenance time and avoid long state transfers while the cluster runs with reduced compute power. Now, if you could understand what’s exactly inside the cache, wouldn’t the planning be more aware as compared to only calculating the best size based on wsrep_received/replicated_bytes variables?
Similarly, while dealing with various incidents occurring in Percona XtraDB Cluster or MariaDB Galera Cluster environments, how many times did you stumble upon the fact that the GCache file (galera.cache) is a black box and you can’t inspect it in a meaningful way?
In some scenarios, having the opportunity to see what exactly ended up in the cache file(s) could help us understand the write workload impact or what happened with transactions.
Why would one need to dig into galera.cache files, though? Let’s think about possible scenarios:
binlog_row_image setting on the writesets size.To address those, I decided to experiment with a tool that would decode the Galera cache files. As a result of these experiments, I recently published gcache-inspector – an open source project available on GitHub.
Before I introduce how the tool works, let’s quickly review the write set caching process.
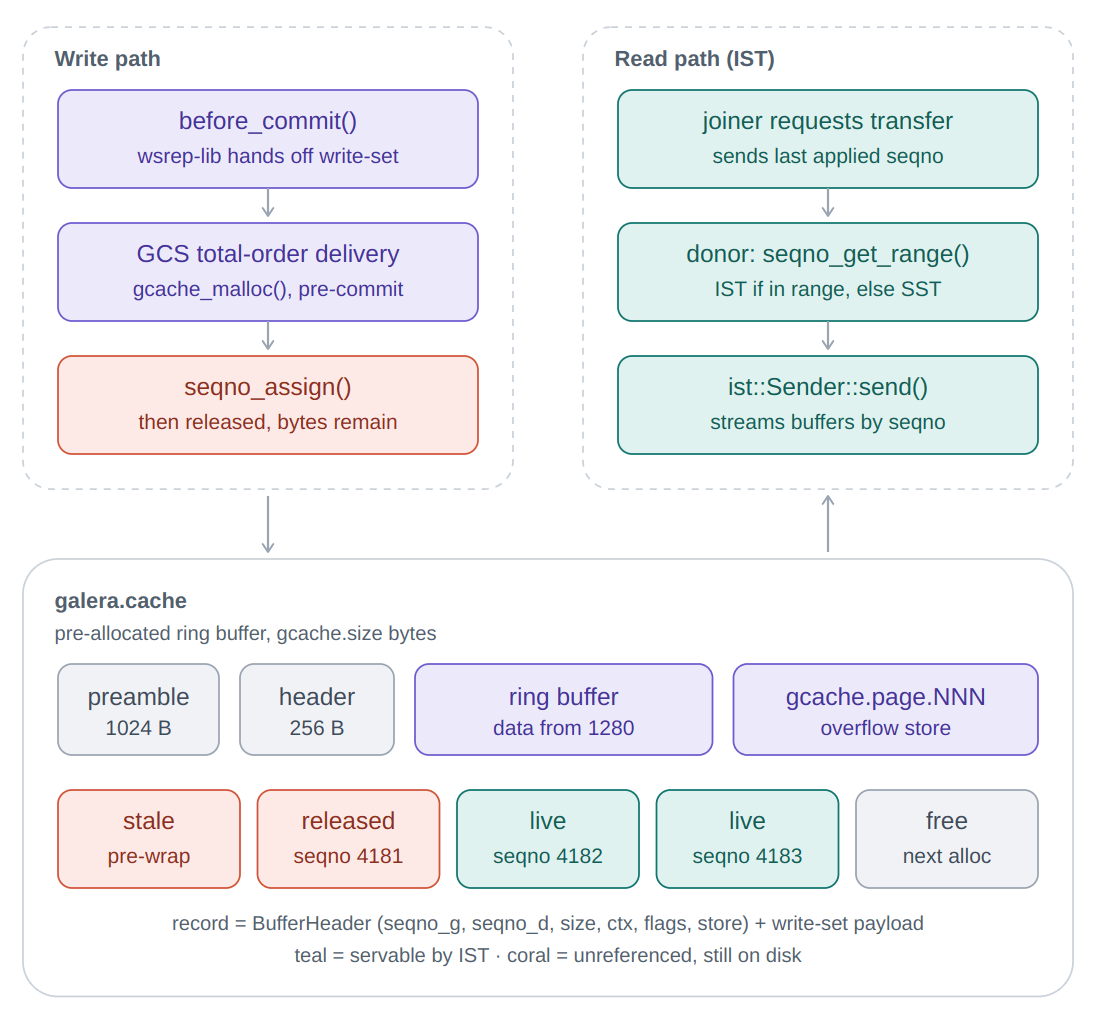
In short, it is a RingBuffer file storing Write-set Cache, which is also memory-mapped. Every replicated transaction is appended to it. Due to the fixed size, the oldest entries are overwritten to allow new writes. In special circumstances when the cache file is too small to fit a big transaction or old entries are not ready to be removed, additional on-demand cache files are created.
From the operational perspective, the most important role of the Galera cache is to provide quick incremental synchronization (IST) of (re-)joining cluster nodes. Having the cache of enough size, so that it can store enough time’s worth of writes, determines the joining process – whether a restarted node will be able to join quickly via IST or whether it will have to pull a full backup (SST) from the donor.
The diagram below shows the typical transaction lifecycle, role, and structure of the Galera cache.
The IST determination is a bit more complex than you’d expect. The joiner estimates the donor’s capabilities with some safety margin.
It is possible to verify the current potential donor Galera cache coverage from its wsrep_local_cached_downto status variable. Moreover, the cache rotation can be put on hold to extend the donor’s time window coverage via the gcache.freeze_purge_at_seqno provider option.
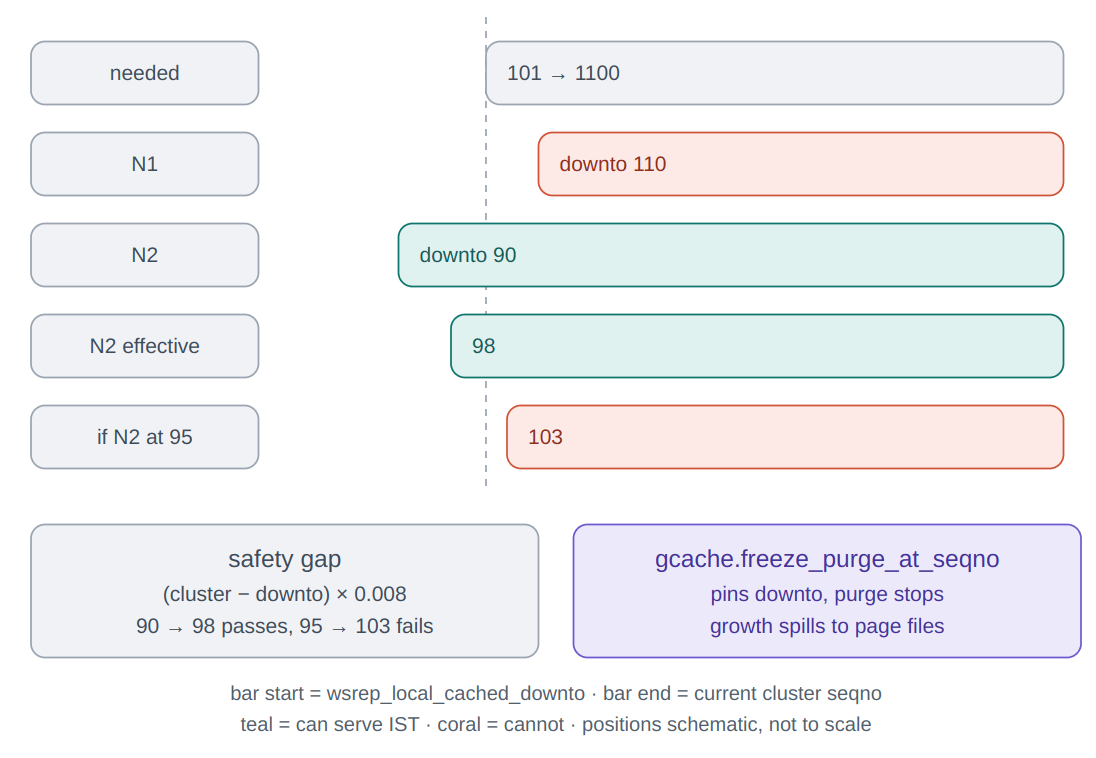
If the above diagram is difficult to digest, the following blog post should shed light on the process: https://www.percona.com/blog/understanding-ist-donor-selected/
Given all this complexity, you may sometimes just want to check and verify for yourself what on earth is in the Galera cache files, instead of guessing.
And historically, the cache files were just a mystery – no tools available to actually properly inspect them. This is why I decided to experiment with a utility that would fill that gap.
The tool I ended up with can fully decode the Galera cache files. It makes quick general write patterns statistics, write set nature information, and can decode the actual Row-based events (binary log style).
Gcache-inspector works offline (the examined PXC node can be running or not). You may point it to a galera.cache or gcache.page.X file. Below is an example of the default report without additional options used.
|
1 2 3 4 5 6 7 8 9 10 11 12 13 14 15 16 17 18 19 20 21 22 23 24 25 26 27 28 29 30 |
$ gcache-inspector --file node2/data/galera.cache === gcache-inspector 0.2.5 — GCache Summary === File: /data/sandboxes/pxc_msb_pxc8_4_10/node2/data/galera.cache Size: 128.00 MB Version: 2 UUID: 62f2ad43-8de5-11f1-9fb8-8bae2a687fc9 Seqno (retained): 2 – 4533 (4532 in cache) Synced: yes Offset: 1704 Encrypted: no Flavor: PXC / MySQL 8.x Write-sets found: 4498 4498 retained, 0 older/overwritten Decodable seqnos: 3 – 4533 (4498 write-sets; pick one with --seqno) Time range: 2026-08-01 22:12:58 – 2026-08-05 23:04:02 CEST (span 96h51m4s, newest 12d ago) DDL statements: 216 GTID events seen: 0 Rows changed: 513758 (95.20 MB) [all write-sets] Top 10 tables by row activity: table insert update delete ddl size ─────────────────────────────────────────────────────────────────── sbtest.sbtest1 5039 5574 15 2 2.9M sbtest.sbtest32 5053 37 18 2 0.9M sbtest.sbtest8 5050 30 23 2 0.9M sbtest.sbtest60 5049 31 21 2 0.9M sbtest.sbtest100 5045 36 18 2 0.9M sbtest.sbtest10 5054 26 19 2 0.9M sbtest.sbtest85 5055 25 17 2 0.9M sbtest.sbtest35 5042 40 14 2 0.9M sbtest.sbtest87 5045 37 14 2 0.9M sbtest.sbtest33 5048 30 18 2 0.9M |
By using the --detail parameter, the tool will show per-individual sequence number details, i.e.:
|
1 2 3 4 5 6 7 8 9 |
$ gcache-inspector --file node2/data/galera.cache --detail --no-summary --seqno 100-105 === Write-sets === seqno 100 453632 B 2026-08-01 22:14:39 RELEASED sbtest.sbtest16[i:2281 u:0 d:0] seqno 101 256 B 2026-08-01 22:14:39 RELEASED 1 DDL: CREATE INDEX k_16 ON sbtest16(k); sbtest.sbtest16[i:0 u:0 d:0] seqno 102 432 B 2026-08-01 22:14:39 RELEASED 1 DDL: CREATE TABLE sbtest17(; sbtest.sbtest17[i:0 u:0 d:0] seqno 103 540664 B 2026-08-01 22:14:39 RELEASED sbtest.sbtest17[i:2719 u:0 d:0] seqno 104 453632 B 2026-08-01 22:14:39 RELEASED sbtest.sbtest17[i:2281 u:0 d:0] seqno 105 256 B 2026-08-01 22:14:39 RELEASED 1 DDL: CREATE INDEX k_17 ON sbtest17(k); sbtest.sbtest17[i:0 u:0 d:0] |
The above example shows that a transaction committed with the sequence number 100 has inserted 2281 rows into the table sbtest16 and did not update or delete any rows.
To see exactly what a given transaction was about, the --decode-rows option prints the whole event details. For example, it’s possible to see what rows were changed under seqno 4252:
|
1 2 3 4 5 6 7 8 9 10 11 12 13 14 15 |
$ gcache-inspector --file node2/data/galera.cache --decode-rows --no-summary --seqno 4252 -- seqno 4252 at 2026-08-01 22:15:32 (816 bytes) RELEASED ### DELETE FROM `sbtest`.`sbtest41` ### WHERE ### @1= 1843 ### @2= 3562 ### @3= '55824051154-00248428540-43829027453-18090470997-77687189613-13487855838-34568671126-01577127301-81564593132-49010886470' ### @4= '09475435259-72703365718-14065084029-80972334150-38881617733' ### INSERT INTO `sbtest`.`sbtest41` ### SET ### @1= 1843 ### @2= 4879 ### @3= '37041074202-54426174421-76052854404-43175485519-62755971707-75981734496-81616509419-51624022546-52075561216-00090498892' ### @4= '46023326729-33104312594-23620888475-28615232417-62781559343' |
Handling DDLs in Galera replication may be quite confusing. Even if, for instance, an ALTER query fails on the writer, it still gets replicated, causing surprising errors on the peer members, similar to this:
|
1 2 3 |
2026-08-05T21:04:02.137267Z 11 [ERROR] [MY-010584] [Repl] Replica SQL: Error 'Table 'sbtest.foo' doesn't exist' on query. Default database: 'sbtest'. Query: 'alter table foo engine=innodb', Error_code: MY-001146 2026-08-05T21:04:02.137334Z 11 [Warning] [MY-000000] [WSREP] Event 1 Query apply failed: 1, seqno 4533 2026-08-05T21:04:02.138503Z 0 [Note] [MY-000000] [Galera] Member 0(przemek-d1) initiates vote on 62f2ad43-8de5-11f1-9fb8-8bae2a687fc9:4533,aebcd4f61a8a51aa: Table 'sbtest.foo' doesn't exist, Error_code: 1146; |
Although such an event normally produces a GRA file to let us investigate, like in this case: GRA_11_4533_v2.log, now we can also look into the cache file for the same (here the SKIPPED flag confirms it was not applied):
|
1 2 3 4 |
$ gcache-inspector --file node2/data/galera.cache --detail --no-summary --seqno 4533 === Write-sets === seqno 4533 256 B 2026-08-05 23:04:02 RELEASED|SKIPPED 1 DDL: alter table foo engine=innodb; sbtest.foo[i:0 u:0 d:0] |
For strict security compliance cases, Percona XtraDB Cluster allows encrypting the Gcache files. The tool allows inspection of encrypted files as well, if the encryption key or vault credentials are provided. But there is one caveat here. A regular, non-encrypted cache file will contain all replicated transactions immediately. Whilst the encrypted one will not show anything new until the encryption in-memory cache is filled or synced during shutdown. Therefore, new transactions are expected to appear in the encrypted cache file with a delay.
Note: the tool does not support encryption available in MariaDB Galera Cluster Enterprise Edition (no source code access).
An example output against an encrypted file:
|
1 2 3 4 5 6 7 8 9 10 11 12 13 14 15 16 17 18 19 20 21 22 23 24 25 26 27 28 29 30 31 32 33 34 |
$ gcache-inspector --file node1/data/galera.cache --keyring-file /opt/mysql/pxc8.4.10/keyring/component_keyring_file === gcache-inspector 0.2.5 — GCache Summary === File: node1/data/galera.cache Size: 128.00 MB Version: 2 UUID: 62f2ad43-8de5-11f1-9fb8-8bae2a687fc9 Seqno (retained): 4395 – 4533 (139 in cache) Synced: yes Offset: 1776 Encrypted: yes — decrypted (enc version 1) Master key: GaleraKey-d6945297-8f7a-11f1-9533-7a5bf82f508c@62eff734-8de5-11f1-b956-7f3a785ad5e2-1 Key source:/opt/mysql/pxc8.4.10/keyring/component_keyring_file (GaleraKey-d6945297-8f7a-11f1-9533-7a5bf82f508c@62eff734-8de5-11f1-b956-7f3a785ad5e2-1) Cipher: AES-256-ctr-file, clear below 0x400, counter from 0x0 [CTR unwrap (zero IV), keyring bytes] Freshness: on a live node the encrypted file lags the in-memory cache (write-back page cache; flushed on eviction/shutdown) Flavor: PXC / MySQL 8.x Write-sets found: 127 127 retained, 0 older/overwritten Decodable seqnos: 4395 – 4533 (127 write-sets; pick one with --seqno) Time range: 2026-08-01 22:15:32 – 2026-08-05 23:04:02 CEST (span 96h48m30s, newest 12d ago) DDL statements: 1 GTID events seen: 0 Rows changed: 5782 (2.08 MB) [all write-sets] Top 10 tables by row activity: table insert update delete ddl size ─────────────────────────────────────────────────────────────────── sbtest.sbtest1 2 5545 1 0 2.0M sbtest.sbtest58 5 1 2 0 0.0M sbtest.sbtest64 3 2 2 0 0.0M sbtest.sbtest52 4 1 2 0 0.0M sbtest.sbtest14 2 3 1 0 0.0M sbtest.sbtest26 2 2 2 0 0.0M sbtest.sbtest6 2 2 2 0 0.0M sbtest.sbtest98 3 1 2 0 0.0M sbtest.sbtest97 4 0 2 0 0.0M sbtest.sbtest68 1 4 0 0 0.0M |
Although in most cases, problems with PXC/Galera replication can be successfully investigated based on error logs, binary logs, and GRA files, there may be more complex cases where you may want to look inside the Galera cache files. Or simply for experimenting or to allow better understanding of how it works. I hope gcache-inspector will help you do this. The tool is available as GPLv3, with Go source code and binary packages ready to play with on GitHub: https://github.com/PrzemekMalkowski/gcache-inspector. Demo recording: https://asciinema.org/a/1263342
If, despite acquiring details, you face undersized gcache or other reasons causing nodes to keep falling back to SST, Percona’s engineers can help you tackle those problems. Talk to us about a cluster health review https://www.percona.com/contact-us/
Additional references about Galera Cache can be found in the following blog posts by other Percona engineers:
https://www.percona.com/blog/all-you-need-to-know-about-gcache-galera-cache/
https://www.percona.com/blog/no-sst-node-rejoins/
https://www.percona.com/blog/understanding-ist-donor-selected/
https://www.percona.com/blog/gcache-and-record-set-cache-encryption-in-percona-xtradb-cluster-part-one/
The article was written by a human
Resources
RELATED POSTS




Nice! A complementary tool also reads the Galera cache: https://github.com/claudionanni/gcachereader. It’s best to use it, for example, to answer “What is transaction seqno X?”
It also provides –show-hex, -o trx-bin (to write raw trx to file)