

This performance investigation aims to look into the read/write performance of Percona Server for MySQL 8.4 and how it changed between versions released in 2026:
We want to see if there are improvements in scalability and performance in OLTP read/write operations, where the improvements are most noticeable and how they were achieved. For some readers this material might help with making the decision whether upgrading to a newer version is worth the effort.
An important note is that the new features or security patches will not be taken into consideration.
Measuring Latency (Percentiles) and Resource Utilization (CPU, RAM, I/O) is not in the scope of this post.
The configuration was as follows:
| Benchmark | Sysbench OLTP Read-Write |
| CPU | Intel Xeon Gold 6230 (2×20 cores, HT = 80 logical CPUs) |
| RAM | 187 GiB DDR4 |
| Storage | NVMe SSD (2.9 TB) INTEL SSDPE2KE032T8 |
| OS | Ubuntu 24.04, kernel 6.8.0-60-generic |
| DB Engines | Percona Server for MySQL 8.4.8-8 (release build) Percona Server for MySQL 8.4.10-10 (release build)Percona Server for MySQL 8.4.11-11 (release build) |
The benchmarks were done across the following dimensions:
| Database Sizes (Row Number) | 24Gb (100M rows) / 48Gb (200M rows) / 96Gb (400M rows) |
| Number of tables in DB Schema | 20 (this number is constant for all runs)
Database Schema definition can be downloaded from here: https://percona-lab-results.github.io/2026-interactive-metrics/schema_dump.sql |
| Number of concurrent threads | 1 / 4 / 16 / 32 / 64 / 128 / 256 / 512 |
| Buffer to Data Ratio | 1:12 (I/O bound), 1:2 (Partially buffered), 1:1 (Fully buffered) |
One of the points in benchmarking was to create combinations of similar Buffer to Data Ratios, but with the different Database Sizes. This gives us the following possible combinations of innodb_buffer_pool_size and Database Size:
| 1:12 (I/O bound) | innodb_buffer_pool_size = 2G, Data Size = 24Gb innodb_buffer_pool_size = 4G, Data Size = 48Gb innodb_buffer_pool_size = 8G, Data Size = 96Gb |
| 1:2 (Partially buffered) | innodb_buffer_pool_size = 12G, Data Size = 24Gb innodb_buffer_pool_size = 24G, Data Size = 48Gb innodb_buffer_pool_size = 48G, Data Size = 96Gb |
| 1:1 (Fully buffered) | innodb_buffer_pool_size = 32G, Data Size = 24Gb innodb_buffer_pool_size = 64G, Data Size = 48Gb innodb_buffer_pool_size = 128G, Data Size = 96Gb |
We should be able to see how efficiently the server manages an increasingly larger number of rows while keeping the Buffer to Data Ratio the same.
Execution of the benchmarks was done as follows:
| Ramp-up | 24G – 600 sec (10 min) – could be shorter 48G – 600 sec (10 min)96G – 900 sec (15 min) The Ramp-up times were established experimentally depending on the Data Size until the point when increasing them further did not bring significant changes. |
| Measurement window | 900 sec (15 min) Ideally it should be as long as possible, but measurements should take reasonable time. Hence, we used the experience of previous benchmarks and established that this window is adequate for the purpose. |
| Number of runs | 3
For each combination there are multiple runs. |
Important Database Configuration options (the actual config files with specific settings for each run can be downloaded from the interactive graphs):
| InnoDB – Buffer pool Tier | |
| innodb_buffer_pool_size | 2G/4G/8G/12G/24G/32G/48G/64G/128G |
| innodb_buffer_pool_load_at_startup | OFF |
| innodb_buffer_pool_dump_at_shutdown | OFF |
| Thread Pool | |
| thread_handling | pool-of-threads |
| thread_pool_size | 80 # match physical core count |
| thread_pool_max_threads | 2000 |
| thread_pool_oversubscribe | 3 |
| Threading | |
| thread_stack | 512K |
| thread_cache_size | 256 |
| back_log | 4096 |
| InnoDB I/O | |
| innodb_io_capacity | 10000 |
| innodb_io_capacity_max | 20000 |
| innodb_read_io_threads | 16 |
| innodb_write_io_threads | 16 |
| innodb_use_native_aio | ON |
| InnoDB Log / Durability | |
| innodb_log_buffer_size | 256M |
| innodb_flush_log_at_trx_commit | 1 # full ACID |
| innodb_doublewrite | ON |
| InnoDB – Concurrency & OLTP Tuning | |
| innodb_stats_on_metadata | OFF |
| innodb_open_files | 65536 |
| innodb_lock_wait_timeout | 50 |
| innodb_rollback_on_timeout | ON |
| Per-Session Buffers | |
| sort_buffer_size | 4M |
| join_buffer_size | 4M |
| read_buffer_size | 2M |
| read_rnd_buffer_size | 4M |
| tmp_table_size | 256M |
| max_heap_table_size | 256M |
| Binary Log | |
| disable_log_bin | ON # Disabled binlog |
| Other InnoDB settings | |
| innodb_redo_log_capacity | 4G |
| innodb_change_buffering | none |
| innodb_flush_method | O_DIRECT |
| innodb_buffer_pool_instances | Calculated as (innodb_buffer_pool_size G / 5) But must be in range [1..8] |
| Misc server settings | |
| collation_server | utf8mb4_unicode_ci |
| bulk_insert_buffer_size | 256M |
| myisam_sort_buffer_size | 128M |
| key_buffer_size | 64M # MyISAM only, keep small for OLTP |
In the high concurrency scenario when all CPU cores are working under maximum load the performance fluctuations might appear out of the ability of a specific CPU crystal to work at a specific sustainable maximum frequency. Intel Xeon Gold 6230 processors installed in the test servers have a base frequency of 2100 MHz and maximum turbo frequency of 3900 MHz. However, such turbo frequency can only be achieved for a short period of time on an isolated core. The load and the heat production of the physical core neighbours limit the frequency of the whole CPU. Some CPU’s were able to hold 2530 MHz on all cores for 20+ hours of intense load, others could only reach 2420 MHz. For consistency of the tests the turbo frequency was capped to 2400 MHz from the beginning on all servers. It helped to eliminate the struggle between turbo mode trying to increase the frequency beyond sustainable levels and the CPU thermal protection bringing the clock down. More stable hardware performance reduced the measurement fluctuations during the benchmark runs regardless if they were done on the same or a different physical server.
First, let’s check the I/O bound scenario where the InnoDB Buffer to Data Size is the smallest (1:12).
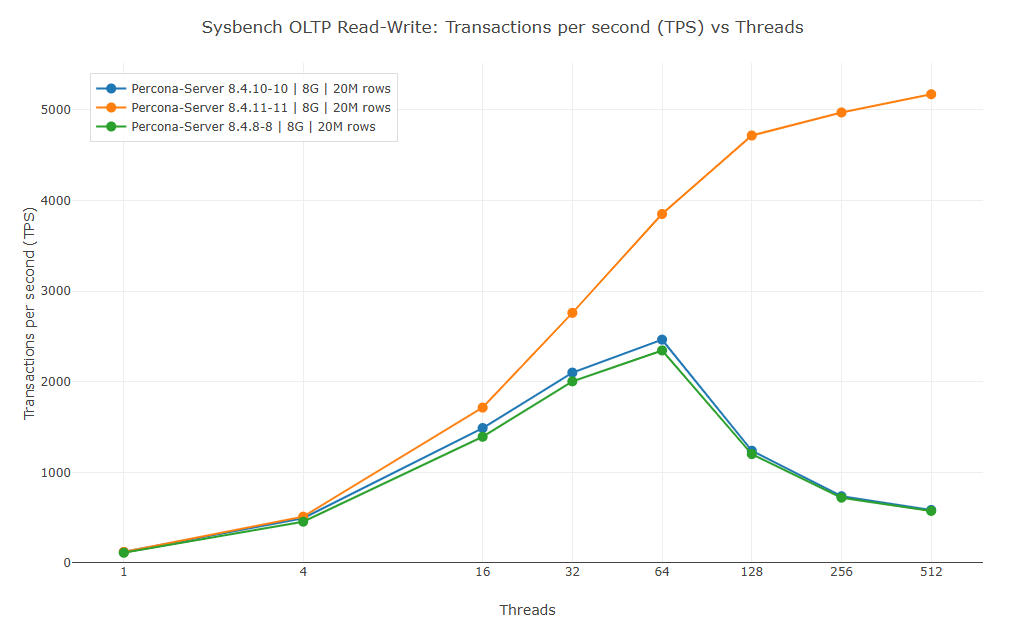
The graph shows the configurations with innodb_buffer_pool_size=8G and Data Size 96G (or 20M rows per table, 400M rows in total):
[ INTERACTIVE GRAPH ][ TABLE ]
The first thing that catches the eye is the hugely superior performance of the version 8.4.11-11 over 8.4.10-10 and 8.4.8-8 in the high thread numbers. In the situations when the number of physical cores (80) is smaller than the number of threads (128+) the versions 8.4.10-10 and 8.4.8-8 have a steep performance degradation. However, the TPS for 8.4.11-11 keeps growing. This is due to the optimization done to InnoDB LRU pages flushing algorithm. The optimization specifically targeted the scenario when the data size is larger than the available server buffers and the server has many concurrent connections doing random read-write operations. The optimizations in 8.4.11-11 deserve a separate explanation and they will be published in another blog post.
The less noticeable, but important difference can be spotted between the TPS for 8.4.8-8 and 8.4.10-10.
The version 8.4.10-10 shows better performance (especially at the saturation point with 64 threads), which should mostly be attributed to the introduction of Performance Guided Optimization (PGO).
More information on PGO can be found here:
https://docs.percona.com/percona-server/8.4/pgo.html
With the smaller data and buffer sizes the performance difference gives an almost identical picture:
4G buffer, 48G data [ INTERACTIVE GRAPH ][ TABLE ]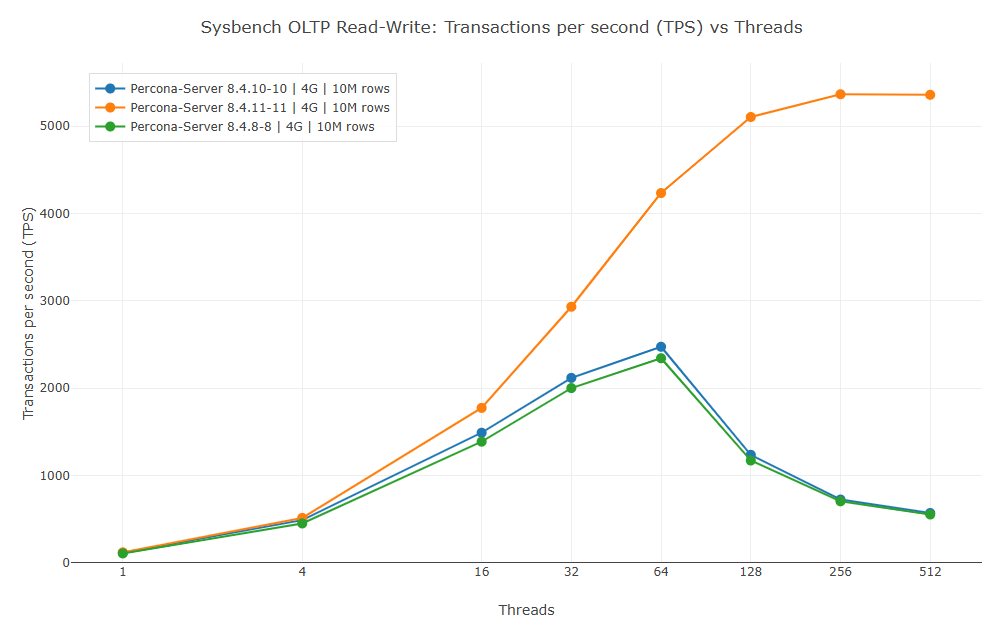 |
2G buffer, 24G data [ INTERACTIVE GRAPH ][ TABLE ]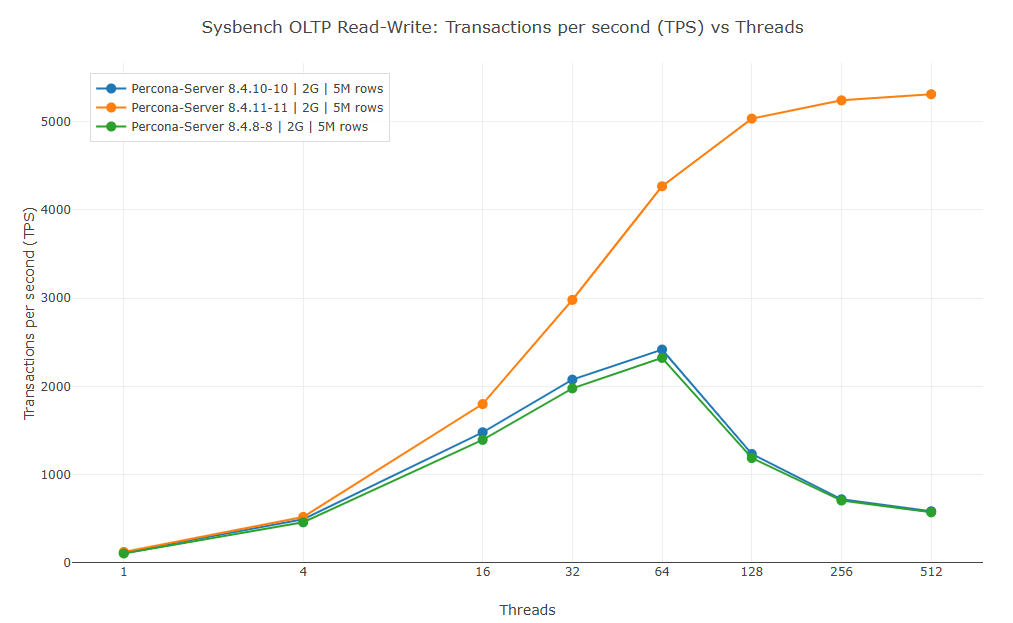 |
Now let’s review what happens with the ratio 1:2.
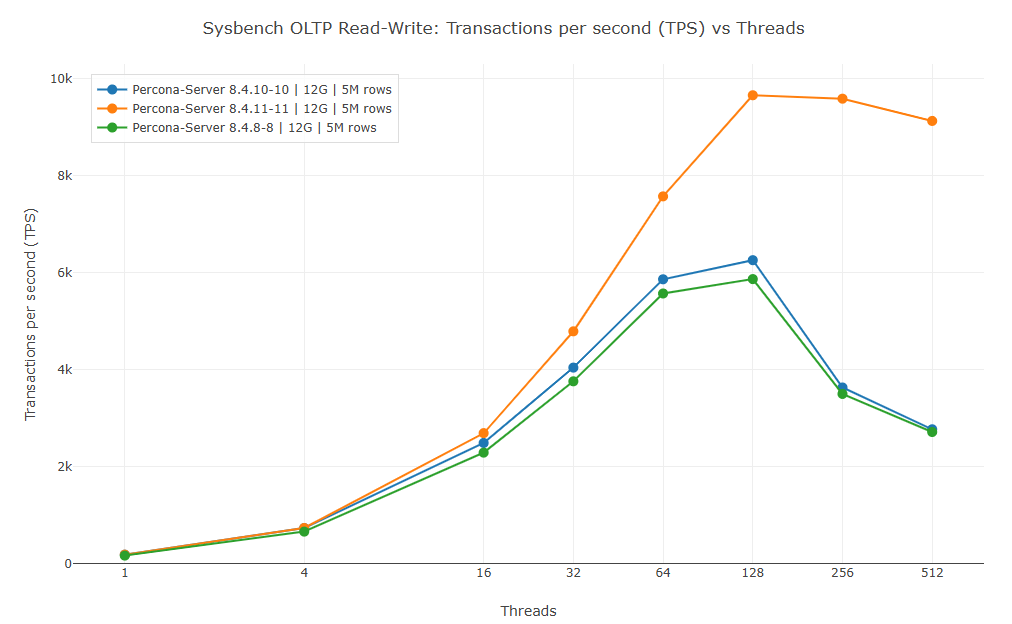
This time the buffer pool size also plays a more significant role and the performance difference is not characterized by the Buffer / Data size ratio.
With innodb_buffer_pool_size=12G and 24G data size the performance gap between 8.4.11-11 and older versions is still huge as can be seen on the graph:
[ INTERACTIVE GRAPH ][ TABLE ]
However, setting innodb_buffer_pool_size=24G and 48G data size reduces the gap. The superiority of 8.4.11-11 is still visible:
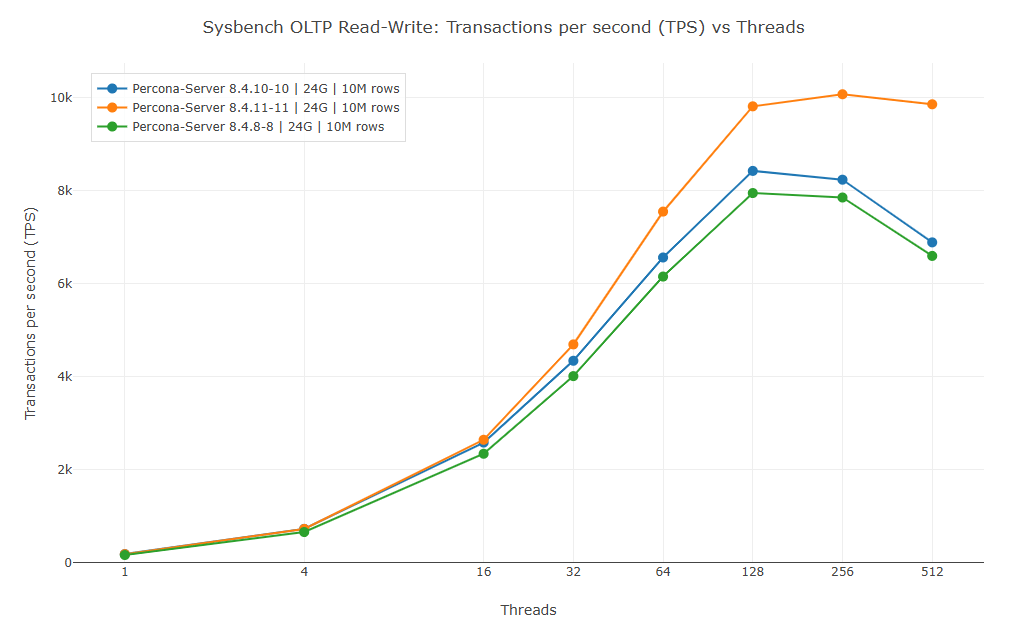
[ INTERACTIVE GRAPH ][ TABLE ]
Moving to innodb_buffer_pool_size=48G and 96G data size shrinks the gap even more:
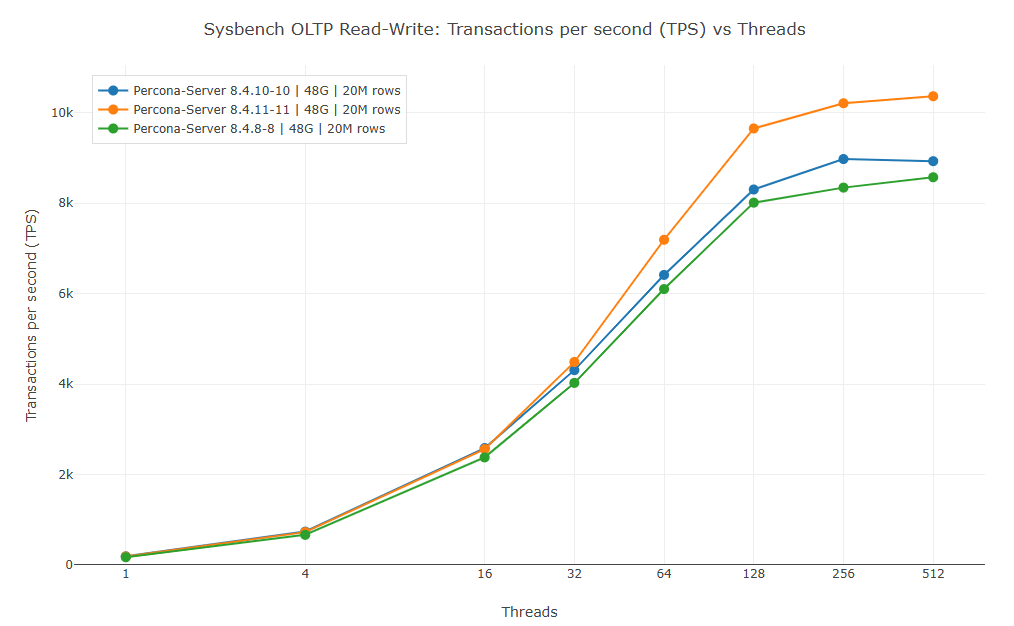
[ INTERACTIVE GRAPH ][ TABLE ]
In this post we are not going to talk about mechanisms behind shrinking performance gaps in 1:2 Buffer / Data size ratio.
Holding the entire data set in memory is not the most common thing for the database server, but in some cases it happens. Therefore, we are covering such situations as well.
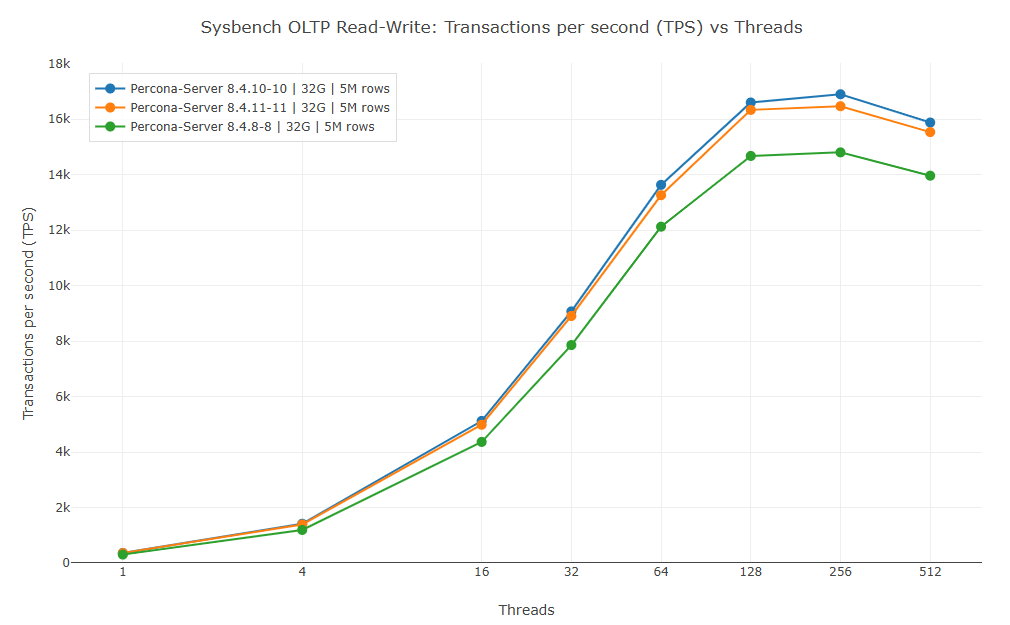
[ INTERACTIVE GRAPH ][ TABLE ]
As the above graph shows, 8.4.10-10 is slightly ahead of 8.4.11-11, but the gap is very small.
This behavior is consistent with other data sizes for fully buffered data:
innodb_buffer_pool_size=64G and 48G Data Size:
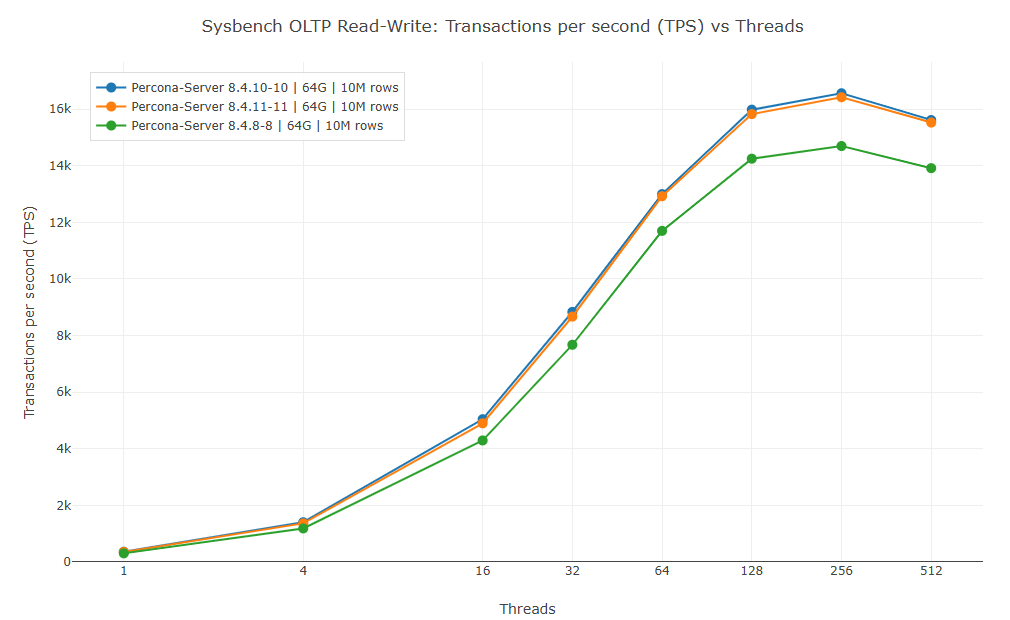
[ INTERACTIVE GRAPH ][ TABLE ]
innodb_buffer_pool_size=128G and 96G Data Size:
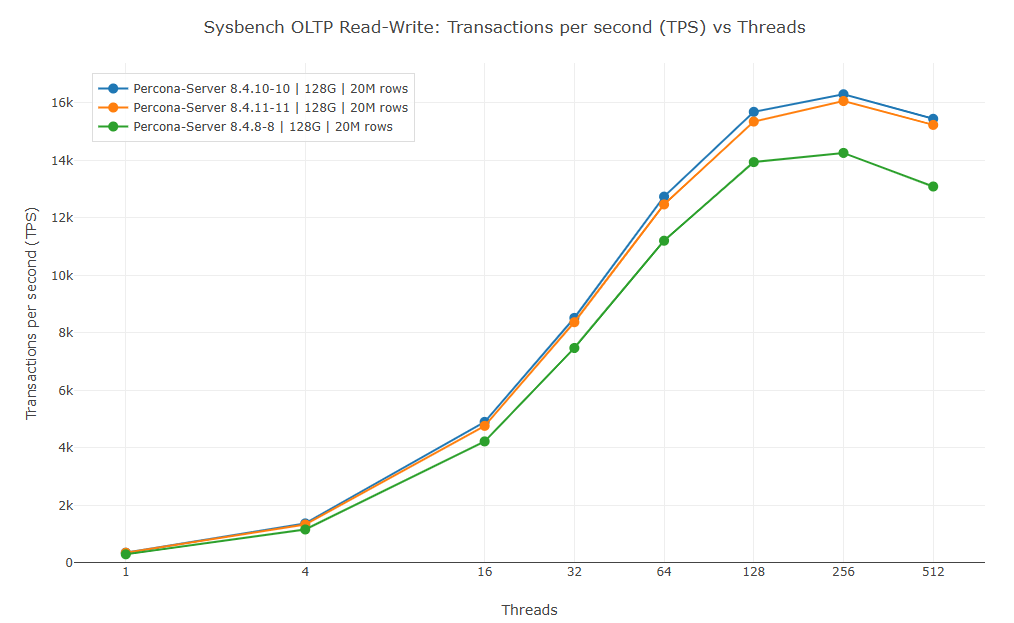
[ INTERACTIVE GRAPH ][ TABLE ]
Again, we will not go into details about why this happens. Though it is worth noting that both 8.4.10-10 and 8.4.11-11 do better than 8.4.8-8 in all runs and configurations.
The table interpretation of the results is available as well.
The performance improvements in Percona Server for MySQL 8.4.11-11 are not a part of the Upstream MySQL 8.4.11. The patch was specifically designed to address the issue of Percona Server being slower than MySQL in I/O bound scenarios.
Also, the patch eliminated the abrupt performance degradation in the higher thread count after reaching the saturation point at 64 threads:
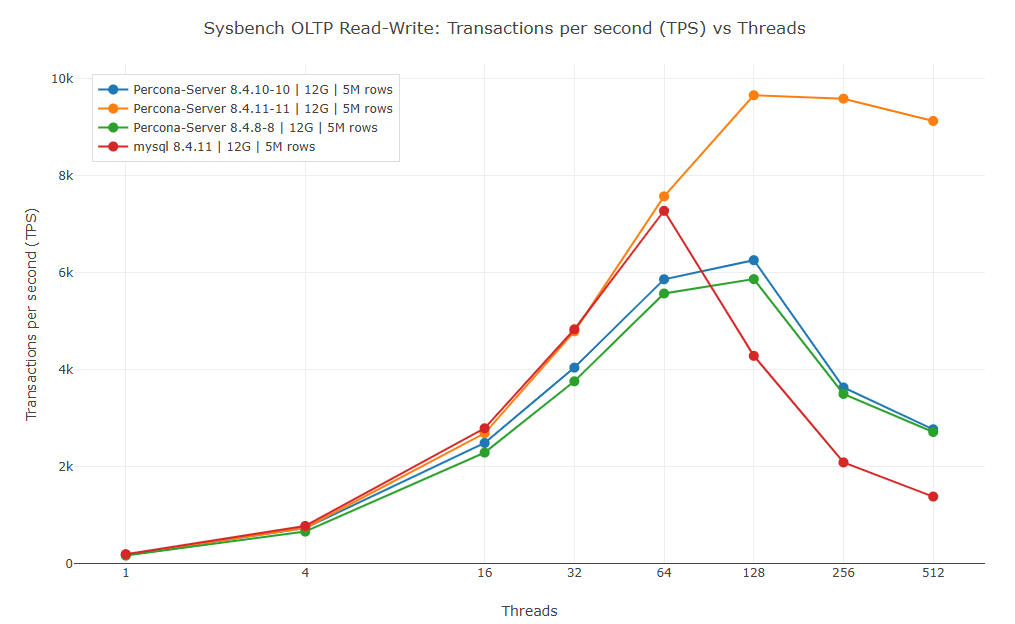
[ INTERACTIVE GRAPH ][ TABLE ]
As the graph shows – Percona Server 8.4.8-8 / 8.4.10-10 was slower than MySQL in lower thread count. Although it was still faster in 128+ threads, the Percona Server was still subject to a substantial slow-down. That is where Percona Server 8.4.11-11 really shines.
However, with the fully buffered data MySQL goes faster than any Percona Server:
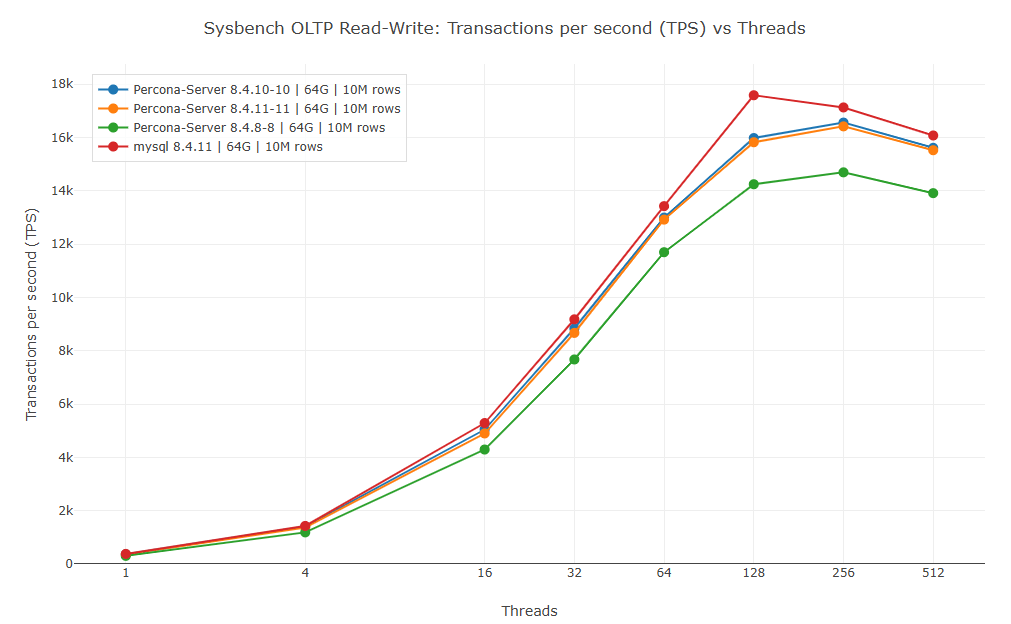
[ INTERACTIVE GRAPH ][ TABLE ]
The Performance of the Percona Server 8.4 for MySQL is progressing well from older to newer version offering significant performance improvements especially in the version 8.4.11-11. This version shows very significant improvements in performance on the data sets that require I/O. Also, it outperformed the upstream MySQL 8.4.11.
With fully buffered data sets the version 8.4.10-10 is slightly better than 8.4.11-11. MySQL Server in this case shows the fastest performance.
The PGO had a positive impact demonstrating the version 8.4.10-10 being faster in all tests on all configurations than 8.4.8-8.
The performance depends not only on the ratio between the buffer and the data size, but also on the buffer size.
Resources
RELATED POSTS