
 The frontend part of Percona Monitoring and Management (PMM) is a set of extensions for Grafana, and the Grafana documentation provides a basic understanding of how things work. But after I studied it, it was still difficult to understand how to approach development in practice. The purpose of this series of articles is to summarize the knowledge and help you prevent the mistakes that we made. The topic will be considered from the perspective of a front-end engineer.
Grafana is the most popular open monitoring platform (34,000 stars, and almost 7,000 forks on Github) and it has a convenient extension mechanism: plugins that any front-end developer familiar with React or AngularJS can develop with minimal preparation.
Grafana provides many convenient mechanisms:
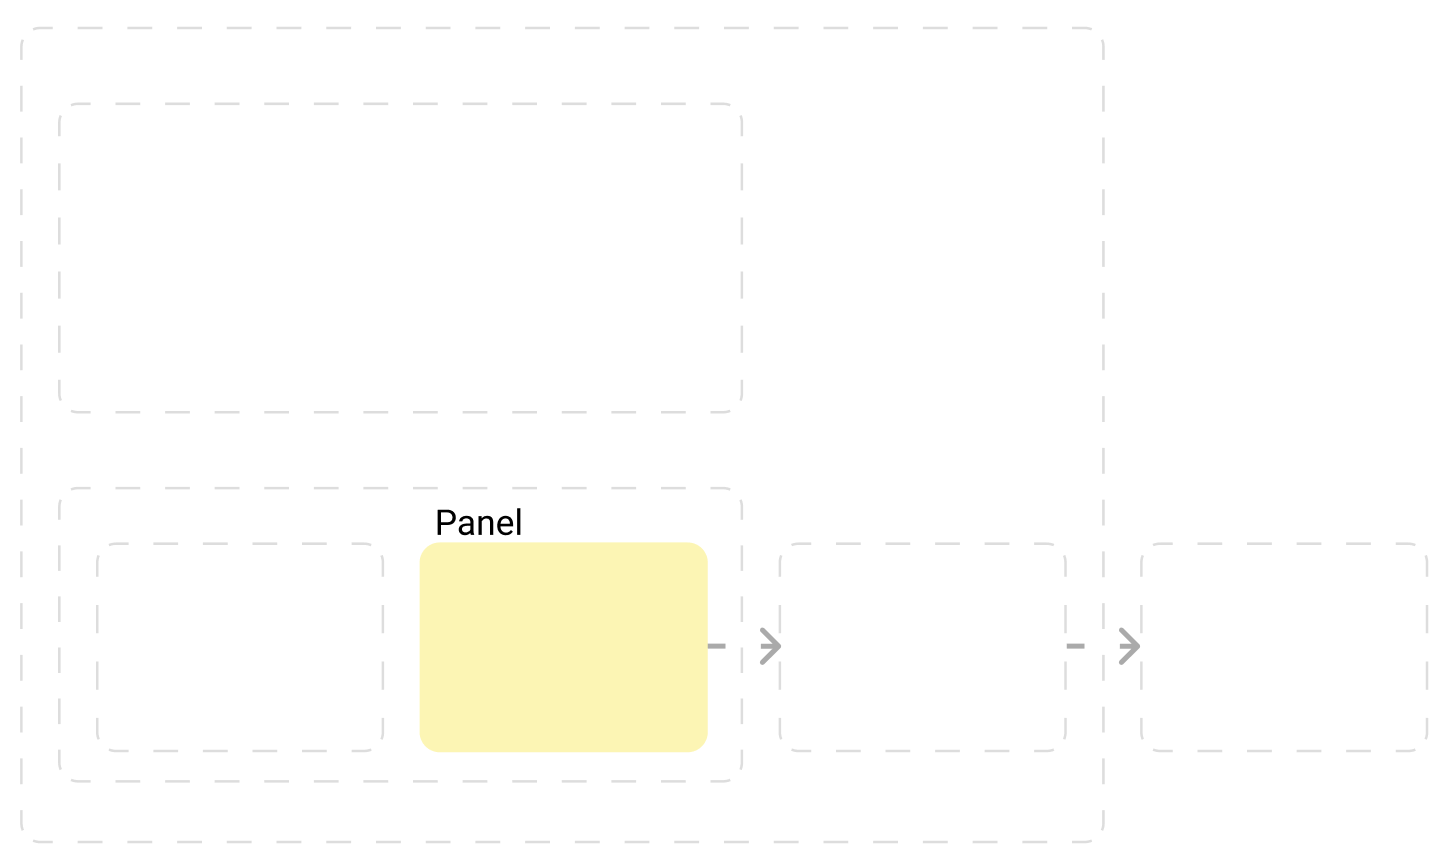
This is the most common type of plugin, the basic element of visualization of selected indicators. Grafana supports panels with graphs, statuses, tables, or just text supports integration with official and community-created panels (like a clock, a map, or any other panel) and applications that can also be visualized.
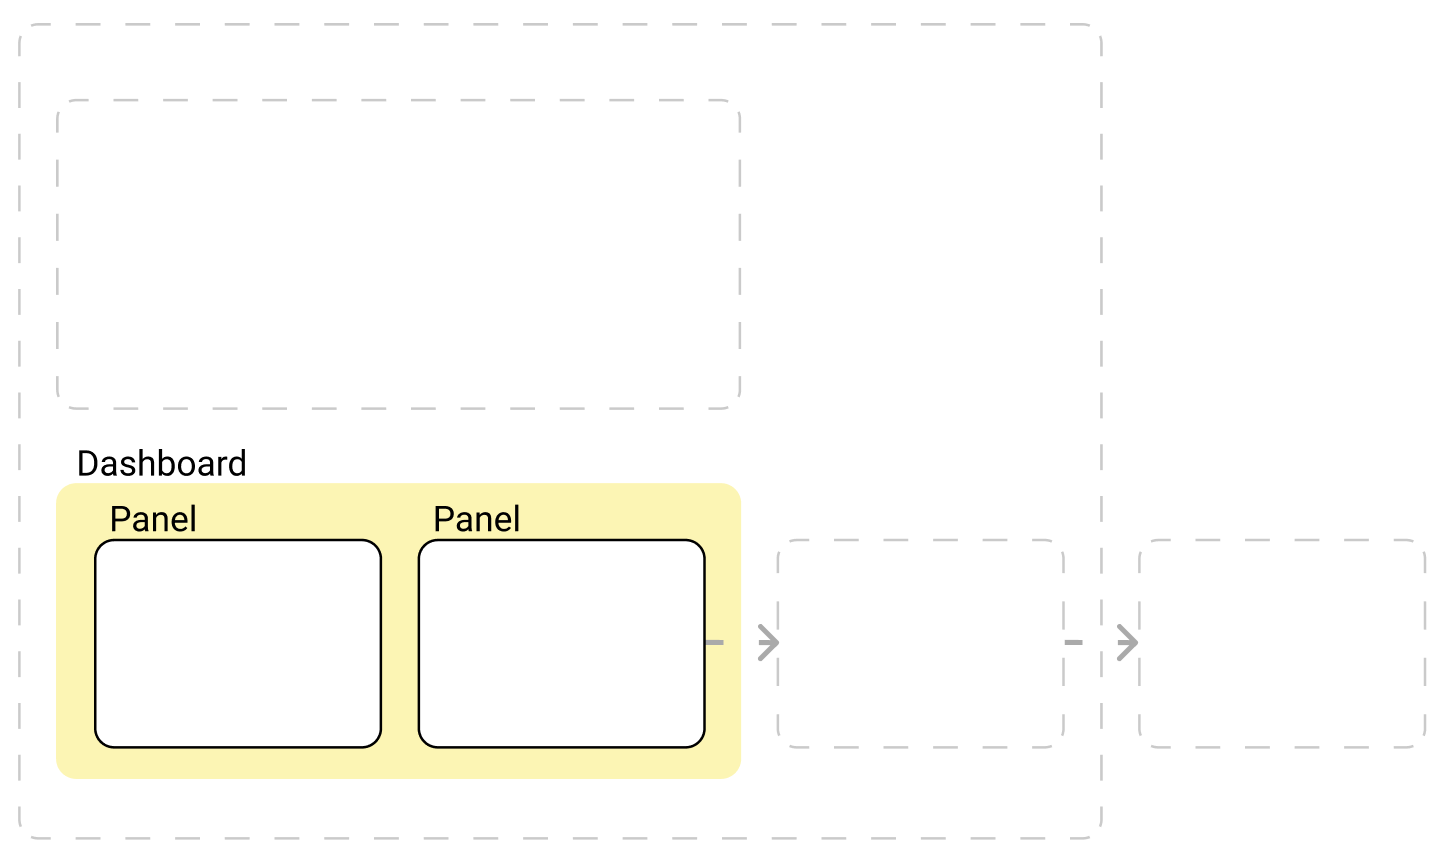
Dashboards are a set of panels organized in a grid with a set of variables (for example, server name). By changing the variables, you can change the data that is displayed on the dashboard, like show data from two separate servers. All dashboards can be customized, you can set the composition of the panels and their layout. There are many dashboards developed by the Grafana or community for different types and sources of data. We use it in PMM to organize our plugins and plugins developed by the community.
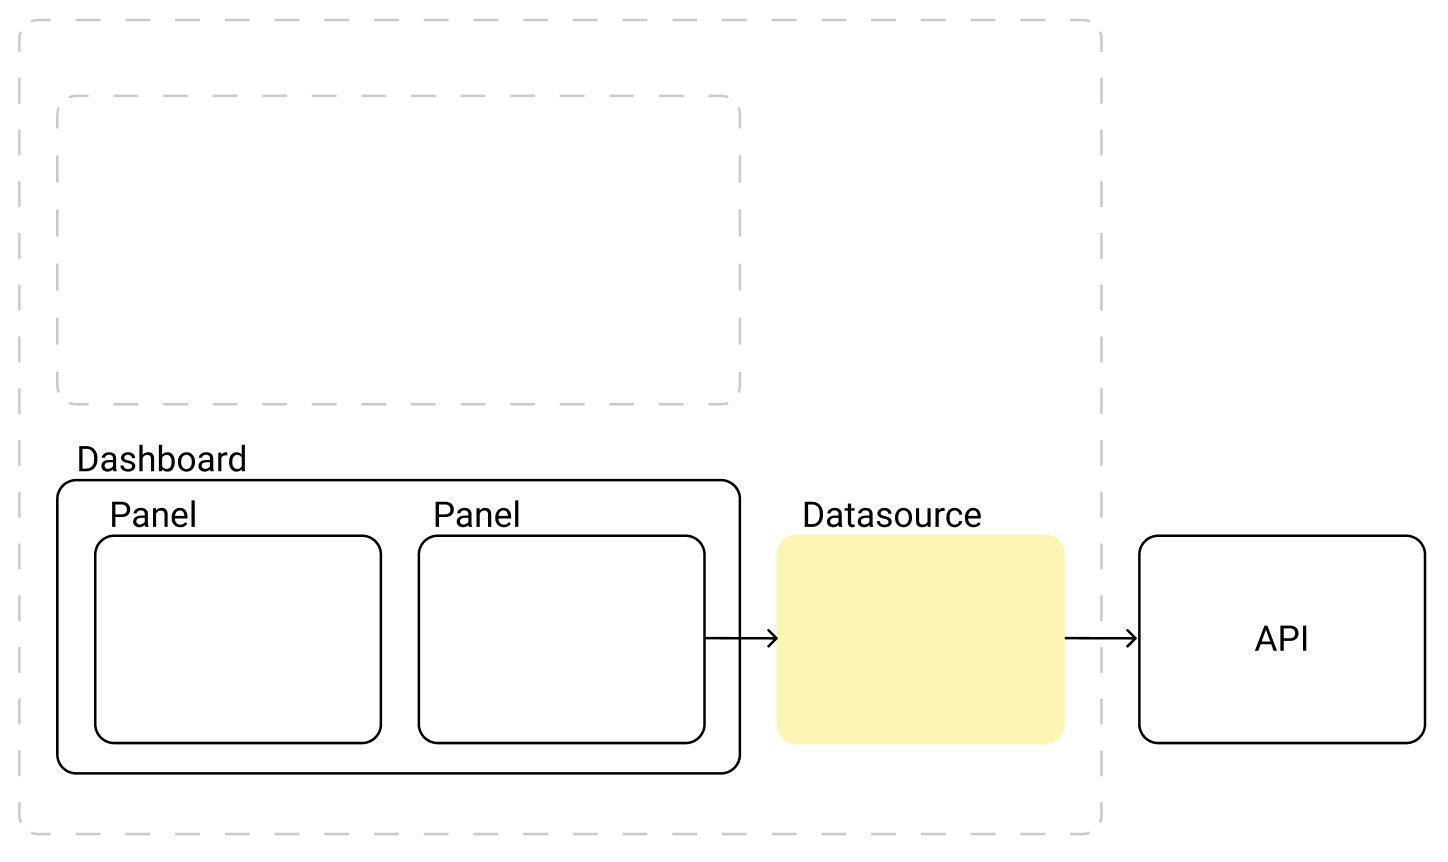
A connector for a data source (for example, Clickhouse-datasource, Elastic-datasource, Prometheus-datasource). The source can be a file, database, or API.
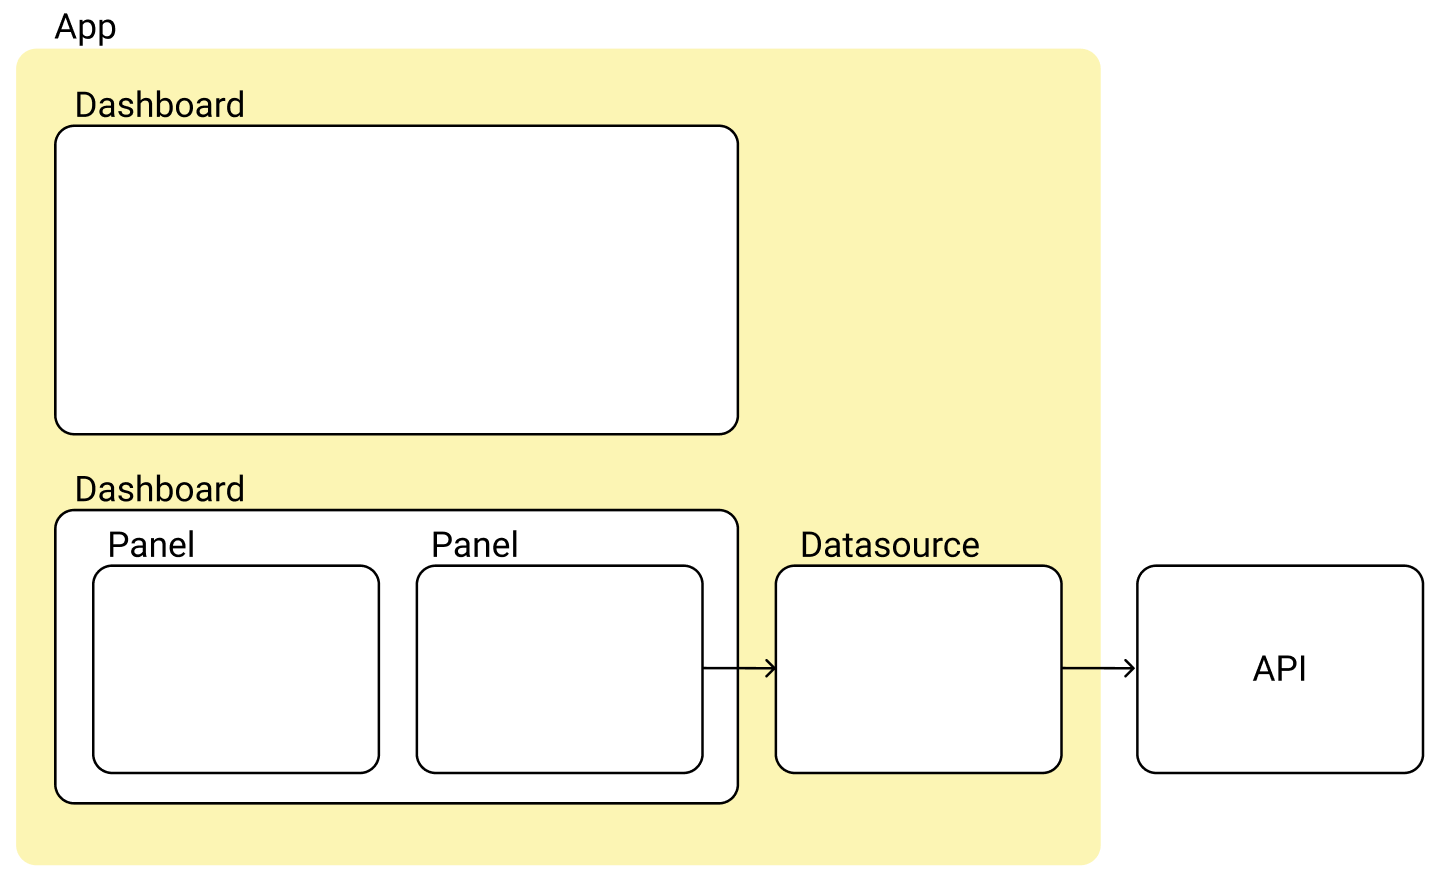
The most interesting part. It allows you to build your own front-end application inside Grafana. Create your own pages and access datasources for data visualization, or work with the API directly, of course. The App may consist of datasources, panels, and dashboards.
Plugins are Javascript modules that can be written with anything, but Grafana supports React or AngularJS, which are built into Grafana and can expand its capabilities with almost any functionality. In compiled form, the plugin contains at least two required files:
plugin.json – Your plugin meta-information: name, version, type. Links to the repository, website, or license. Dependencies, and so on.
module.js – The entry point through which the Grafana connects the plugin to itself. The main requirement is that it contains a single export – the entry point to your plugin, but inside it, you can do anything you want, for Grafana it is a black box.
Inside the plugin, you can use literally anything that you can use inside the standard react application, such as:
This opens up great flexibility in the selection of suitable technologies, in our case it is:
Resources
RELATED POSTS


Nice post, I’ll look forward the next in this serie.
I have been looking into Grafana plugin development but I was missing an easy to follow guide.
As a PMM user I would love to have a page where I can see the incidents in my databases; similar to OEM incident manager. This would be a perfect playground for a new plugin.