
Percona Monitoring and Management (PMM) provides an excellent solution for system monitoring. Sometimes, though, you’ll have the need for a metric that’s not present in the list of node_exporter metrics out of the box. In this post, we introduce a simple method and show how to extend the list of available metrics without modifying the node_exporter code. It’s based on the textfile collector.
This collector is not enabled by default in the latest version of pmm-client. So, first let’s enable the textfile collector.
|
1 2 3 4 5 6 7 8 9 10 11 12 13 14 15 16 17 18 |
# pmm-admin rm linux:metrics OK, removed system pmm-client-hostname from monitoring. # pmm-admin add linux:metrics -- --collectors.enabled=diskstats,filefd,filesystem,loadavg,meminfo,netdev,netstat,stat,time,uname,vmstat,textfile --collector.textfile.directory="/tmp" OK, now monitoring this system. # pmm-admin ls pmm-admin 1.13.0 PMM Server | 10.178.1.252 Client Name | pmm-client-hostname Client Address | 10.178.1.252 Service Manager | linux-upstart -------------- -------------------- ----------- -------- ------------ -------- SERVICE TYPE NAME LOCAL PORT RUNNING DATA SOURCE OPTIONS -------------- -------------------- ----------- -------- ------------ -------- linux:metrics pmm-client-hostname 42000 YES - |
Notice that the whole list of default collectors has to be re-enabled. Also, don’t forget to specify the directory for reading files with the metrics (–collector.textfile.directory=”/tmp”). The exporter reads files with the extension .prom
The second step is to add a crontab task to collect metrics and place them into a file.
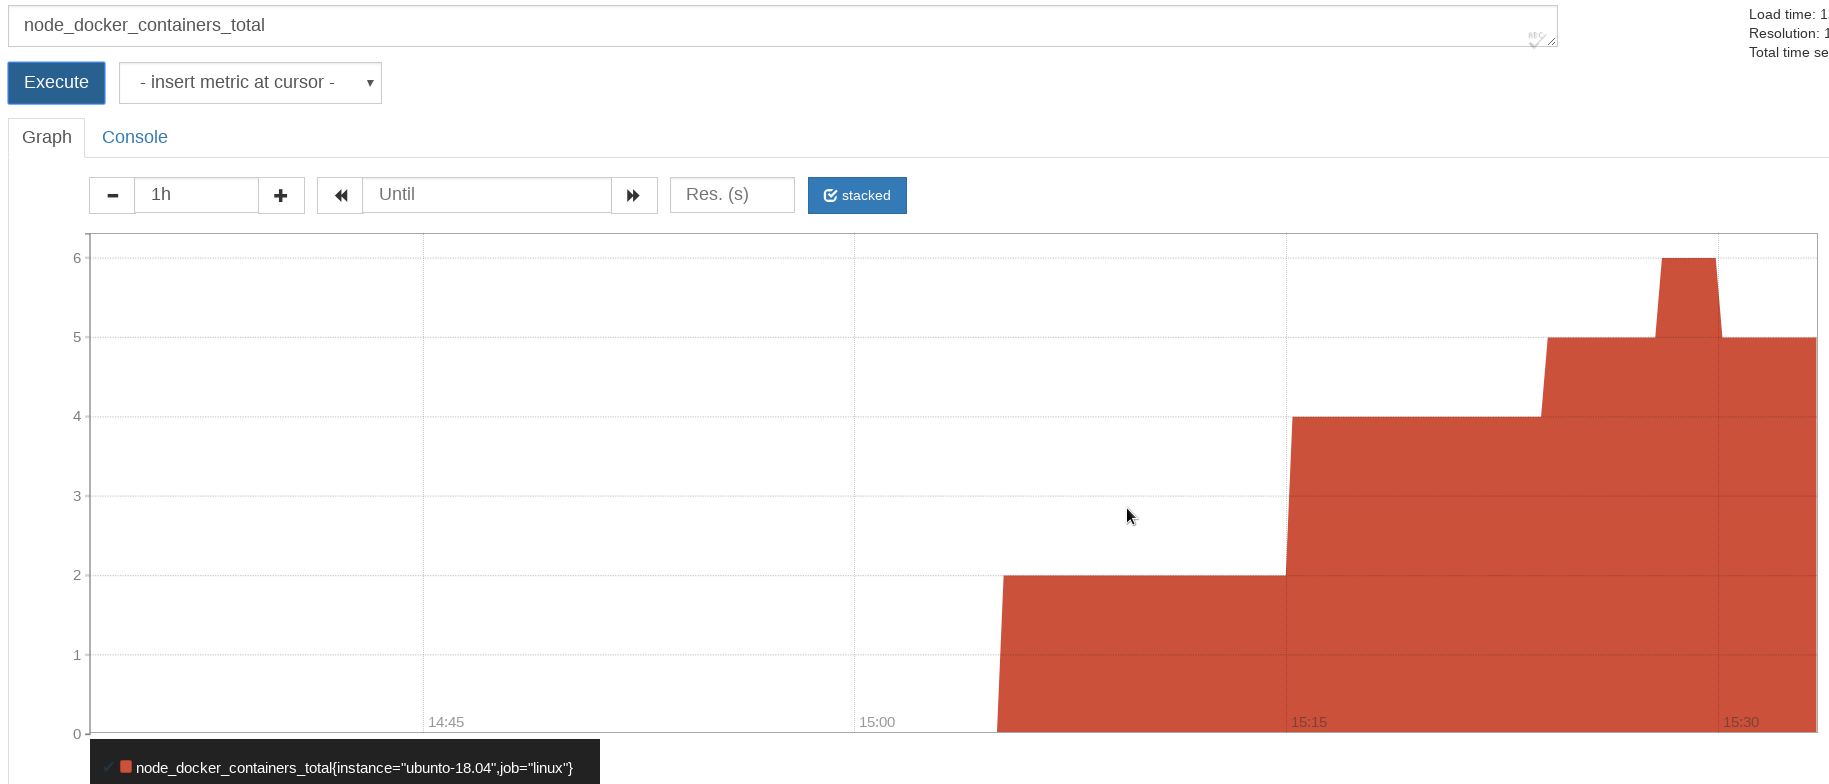
Here are the cron commands for collecting the number of running and stopping docker containers.
|
1 2 |
*/1 * * * * root echo -n "" > /tmp/docker_all.prom; /usr/bin/docker ps -a | sed -n '1!p'| /usr/bin/wc -l | sed -ne 's/^/node_docker_containers_total /p' >> /tmp/docker_all.prom; */1 * * * * root echo -n "" > /tmp/docker_running.prom; /usr/bin/docker ps | sed -n '1!p'| /usr/bin/wc -l | sed -ne 's/^/node_docker_containers_running_total /p' >>/tmp/docker_running.prom; |
The result of the commands is placed into the files /tmp/docker_running.prom and /tmp/docker_running.prom and read by exporter.
Also, we have a few bash scripts that make it much easier to add crontab tasks.
The first one allows you to collect the logged-in users and the size of Innodb data files.
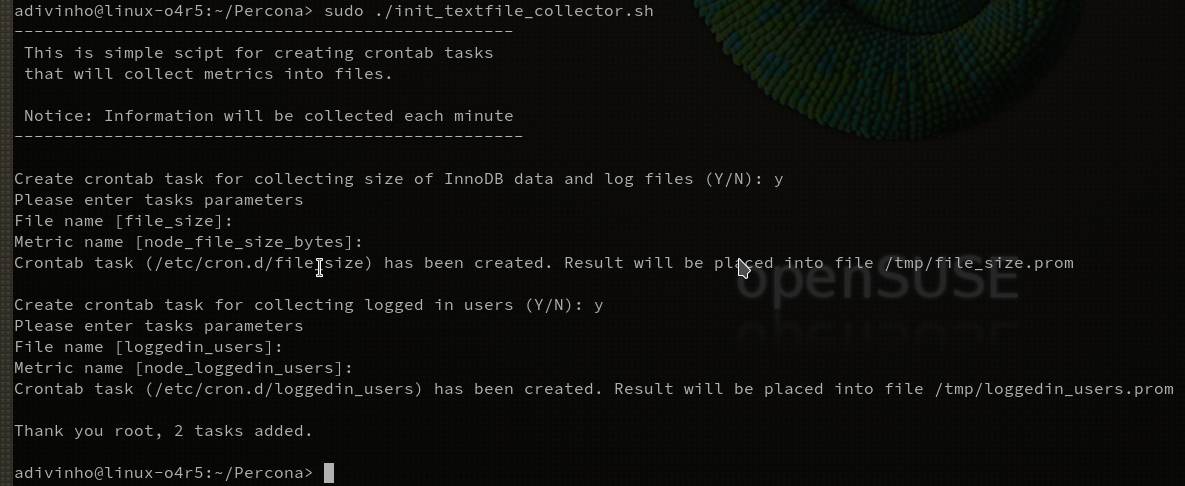
You may use the suggested names of files and metrics or set new ones.
The second script is more universal. It allows us to get the size of any directories or files. This script can be placed directly into a crontab task. You should just specify the list of monitored instances (e.g. /var/log /var/cache/apt /var/lib/mysql/ibdata1)
|
1 |
echo "*/5 * * * * root bash /root/object_sizes.sh /var/log /var/cache/apt /var/lib/mysql/ibdata1" > /etc/cron.d/object_size |
So, I hope this has provided useful insight into how to set up the collection of new PMM metrics without the need to write code. Please feel free to use the scripts or configure commands similar to the ones provided above.
If you are new to PMM, there is a great demo site of the latest version, showing you those out of the box metrics. Or how about our free webinar on monitoring Amazon RDS with PMM?
Resources
RELATED POSTS


pmm-admin add linux:metrics — –collectors.enabled=diskstats,filefd,filesystem,loadavg,meminfo,netdev,netstat,stat,time,uname,vmstat,textfile –collector.textfile.directory=”/tmp”
does not work…i tried with only giving “–collectors.enabled=textfile” and –collector.textfile.directory=”/tmp” but in all cases the log shows that its enabling default set of collectors which does not include textfile collector
The collector is enabled by default in the pmm-admin release 1.16.0. It’s configured to check *.prom text files from the folder /usr/local/percona/pmm-client/textfile-collector.
This release is scheduled on the next week.
Thank you for the good article.
What should I do if I want to automatically visualize the collected data in grafana?
You should verify that your metric is really collected.
The most easiest way is prometheus UI (https://your-pmm-ip/prometheus/)
If the metric is present in “Expression” drop-down list you may proceed with adding a grafana element to a dashboard.
Some tips can be found in the next article in the section “PMM dashboard”
https://www.percona.com/blog/2018/03/14/adding-custom-graphs-dashboards-percona-monitoring-management/
I’m sorry, the reply was delayed…
thank you for the good answer .
I will use it as a reference!!