
MySQL stored procedures, functions and triggers, are tempting constructs for application developers. However, as I discovered, there can be an impact on database performance when using MySQL stored routines. Not being entirely sure of what I was seeing during a customer visit, I set out to create some simple tests to measure the impact of triggers on database performance. The outcome might surprise you.
Recently, I worked with a customer to profile the performance of triggers and stored routines. What I’ve learned about stored routines: “dead” code (the code in a branch which will never run) can still significantly slow down the response time of a function/procedure/trigger. We will need to be careful to clean up what we do not need.
Let’s compare these four simple stored functions (in MySQL 5.7):
Function 1:
|
1 2 3 4 5 |
CREATE DEFINER=`root`@`localhost` FUNCTION `func1`() RETURNS int(11) BEGIN declare r int default 0; RETURN r; END |
This function simply declares a variable and returns it. It is a dummy function
Function 2:
|
1 2 3 4 5 6 7 8 9 10 |
CREATE DEFINER=`root`@`localhost` FUNCTION `func2`() RETURNS int(11) BEGIN declare r int default 0; IF 1=2 THEN select levenshtein_limit_n('test finc', 'test func', 1000) into r; END IF; RETURN r; END |
This function calls another function, levenshtein_limit_n (calculates levenshtein distance). But wait: this code will never run – the condition IF 1=2 will never be true. So that is the same as function 1.
Function 3:
|
1 2 3 4 5 6 7 8 9 10 11 12 13 14 15 16 17 |
CREATE DEFINER=`root`@`localhost` FUNCTION `func3`() RETURNS int(11) BEGIN declare r int default 0; IF 1=2 THEN select levenshtein_limit_n('test finc', 'test func', 1) into r; END IF; IF 2=3 THEN select levenshtein_limit_n('test finc', 'test func', 10) into r; END IF; IF 3=4 THEN select levenshtein_limit_n('test finc', 'test func', 100) into r; END IF; IF 4=5 THEN select levenshtein_limit_n('test finc', 'test func', 1000) into r; END IF; RETURN r; END |
Here there are four conditions and none of these conditions will be true: there are 4 calls of “dead” code. The result of the function call for function 3 will be the same as function 2 and function 1.
Function 4:
|
1 2 3 4 5 6 7 8 9 10 11 12 13 14 15 16 17 |
CREATE DEFINER=`root`@`localhost` FUNCTION `func3_nope`() RETURNS int(11) BEGIN declare r int default 0; IF 1=2 THEN select does_not_exit('test finc', 'test func', 1) into r; END IF; IF 2=3 THEN select does_not_exit('test finc', 'test func', 10) into r; END IF; IF 3=4 THEN select does_not_exit('test finc', 'test func', 100) into r; END IF; IF 4=5 THEN select does_not_exit('test finc', 'test func', 1000) into r; END IF; RETURN r; END |
This is the same as function 3 but the function we are running does not exist. Well, it does not matter as the select does_not_exit will never run.
So all the functions will always return 0. We expect that the performance of these functions will be the same or very similar. Surprisingly it is not the case! To measure the performance I used the “benchmark” function to run the same function 1M times. Here are the results:
|
1 2 3 4 5 6 7 8 9 10 11 12 13 14 15 16 17 18 19 20 21 22 23 24 25 26 27 |
+-----------------------------+ | benchmark(1000000, func1()) | +-----------------------------+ | 0 | +-----------------------------+ 1 row in set (1.75 sec) +-----------------------------+ | benchmark(1000000, func2()) | +-----------------------------+ | 0 | +-----------------------------+ 1 row in set (2.45 sec) +-----------------------------+ | benchmark(1000000, func3()) | +-----------------------------+ | 0 | +-----------------------------+ 1 row in set (3.85 sec) +----------------------------------+ | benchmark(1000000, func3_nope()) | +----------------------------------+ | 0 | +----------------------------------+ 1 row in set (3.85 sec) |
As we can see func3 (with four dead code calls which will never be executed, otherwise identical to func1) runs almost 3x slower compared to func1(); func3_nope() is identical in terms of response time to func3().
To figure out what is happening inside the function calls I used performance_schema / sys schema to create a trace with ps_trace_thread() procedure
|
1 2 3 4 5 6 7 |
mysql> select THREAD_ID from performance_schema.threads where processlist_id = connection_id(); +-----------+ | THREAD_ID | +-----------+ | 49 | +-----------+ 1 row in set (0.00 sec) |
|
1 2 3 4 5 6 7 8 9 10 11 12 13 14 |
mysql> CALL sys.ps_trace_thread(49, concat('/var/lib/mysql-files/stack-func1-run1.dot'), 10, 0, TRUE, TRUE, TRUE); +--------------------+ | summary | +--------------------+ | Disabled 0 threads | +--------------------+ 1 row in set (0.00 sec) +---------------------------------------------+ | Info | +---------------------------------------------+ | Data collection starting for THREAD_ID = 49 | +---------------------------------------------+ 1 row in set (0.00 sec) |
|
1 2 3 4 5 6 7 |
mysql> select func1(); +---------+ | func1() | +---------+ | 0 | +---------+ 1 row in set (0.00 sec) |
|
1 2 3 4 5 6 7 8 9 10 11 12 13 14 15 16 17 18 19 20 21 22 |
+-----------------------------------------------------------------------+ | Info | +-----------------------------------------------------------------------+ | Stack trace written to /var/lib/mysql-files/stack-func3nope-new12.dot | +-----------------------------------------------------------------------+ 1 row in set (9.21 sec) +-------------------------------------------------------------------------------+ | Convert to PDF | +-------------------------------------------------------------------------------+ | dot -Tpdf -o /tmp/stack_49.pdf /var/lib/mysql-files/stack-func3nope-new12.dot | +-------------------------------------------------------------------------------+ 1 row in set (9.21 sec) +-------------------------------------------------------------------------------+ | Convert to PNG | +-------------------------------------------------------------------------------+ | dot -Tpng -o /tmp/stack_49.png /var/lib/mysql-files/stack-func3nope-new12.dot | +-------------------------------------------------------------------------------+ 1 row in set (9.21 sec) Query OK, 0 rows affected (9.45 sec) |
I repeated these steps for all the functions above and then created charts of the commands.
Here are the results:
Func1()
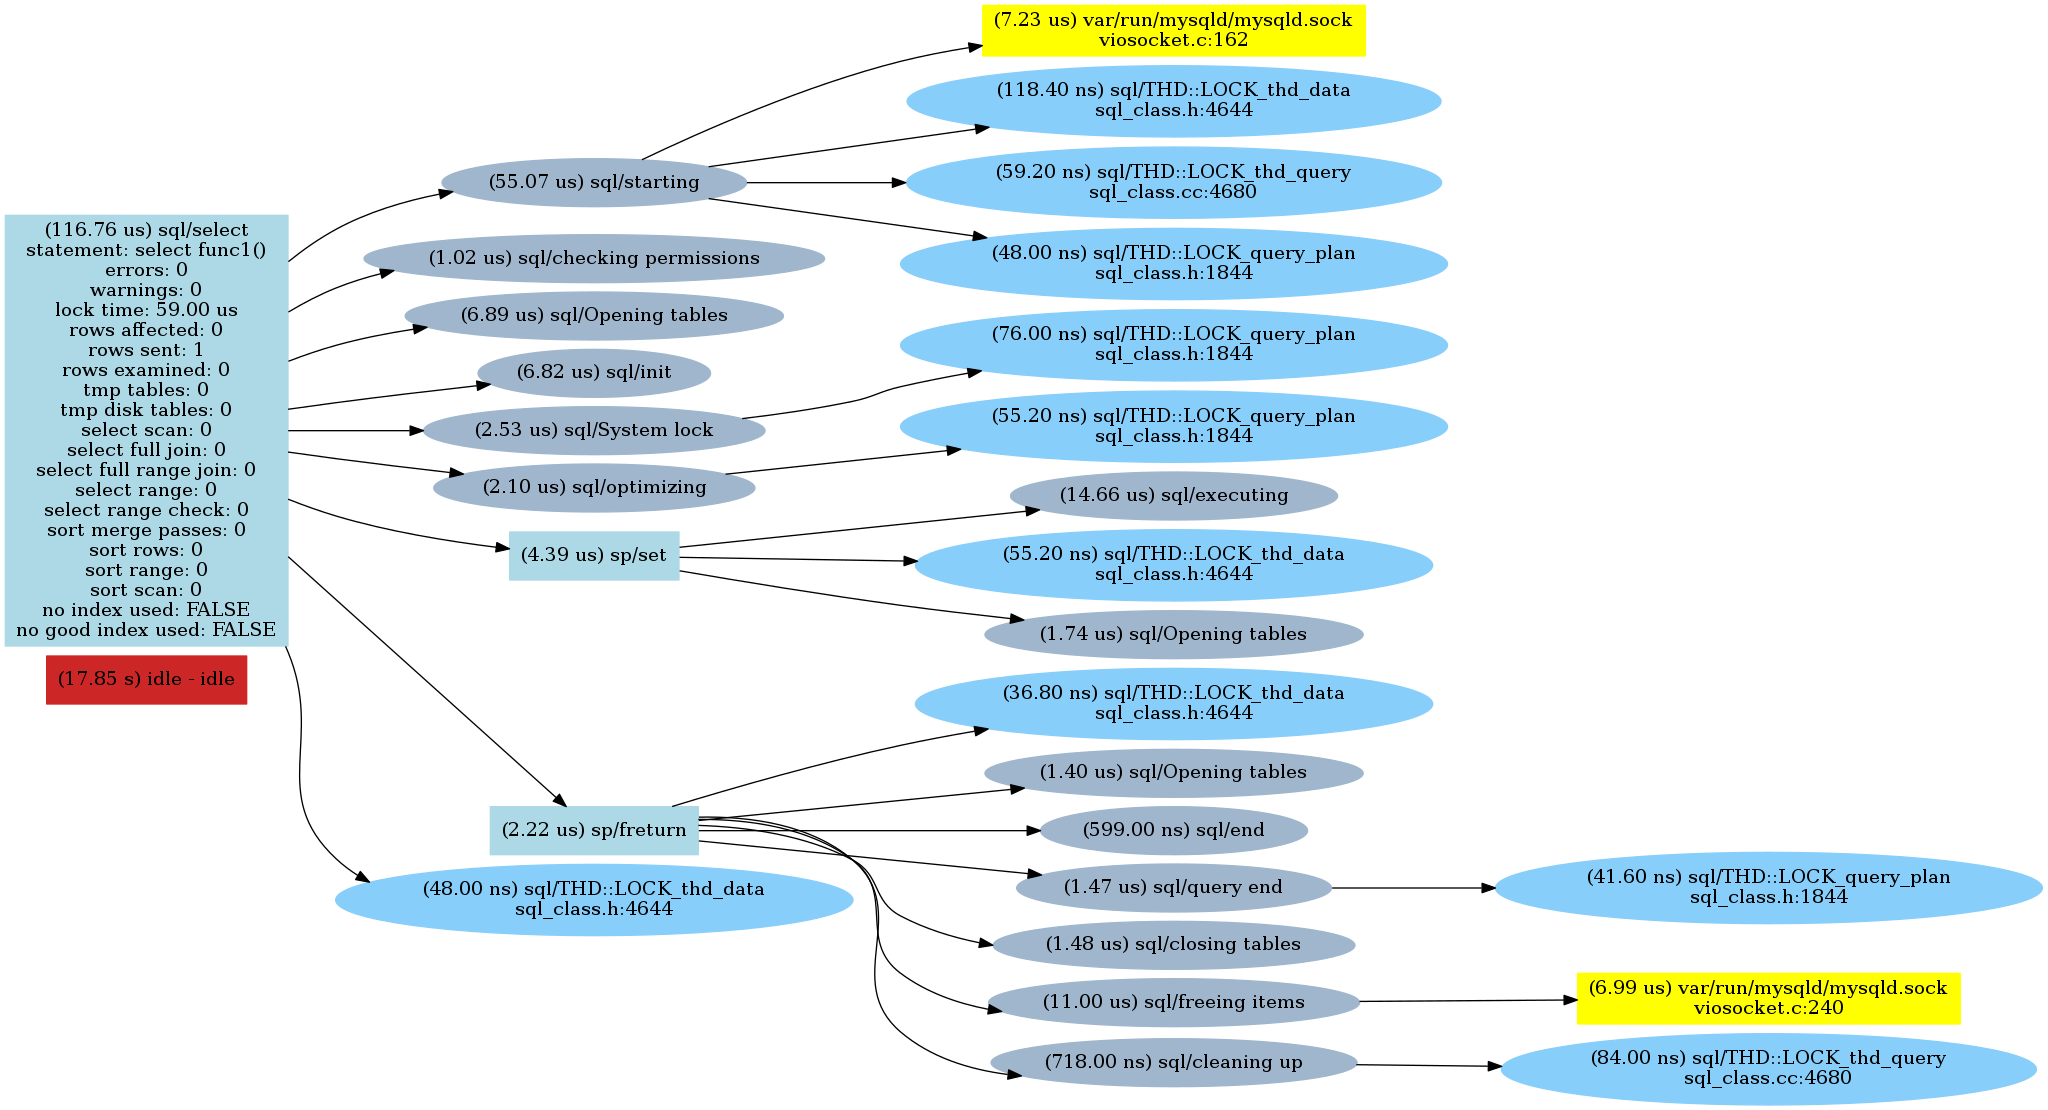
Func2()
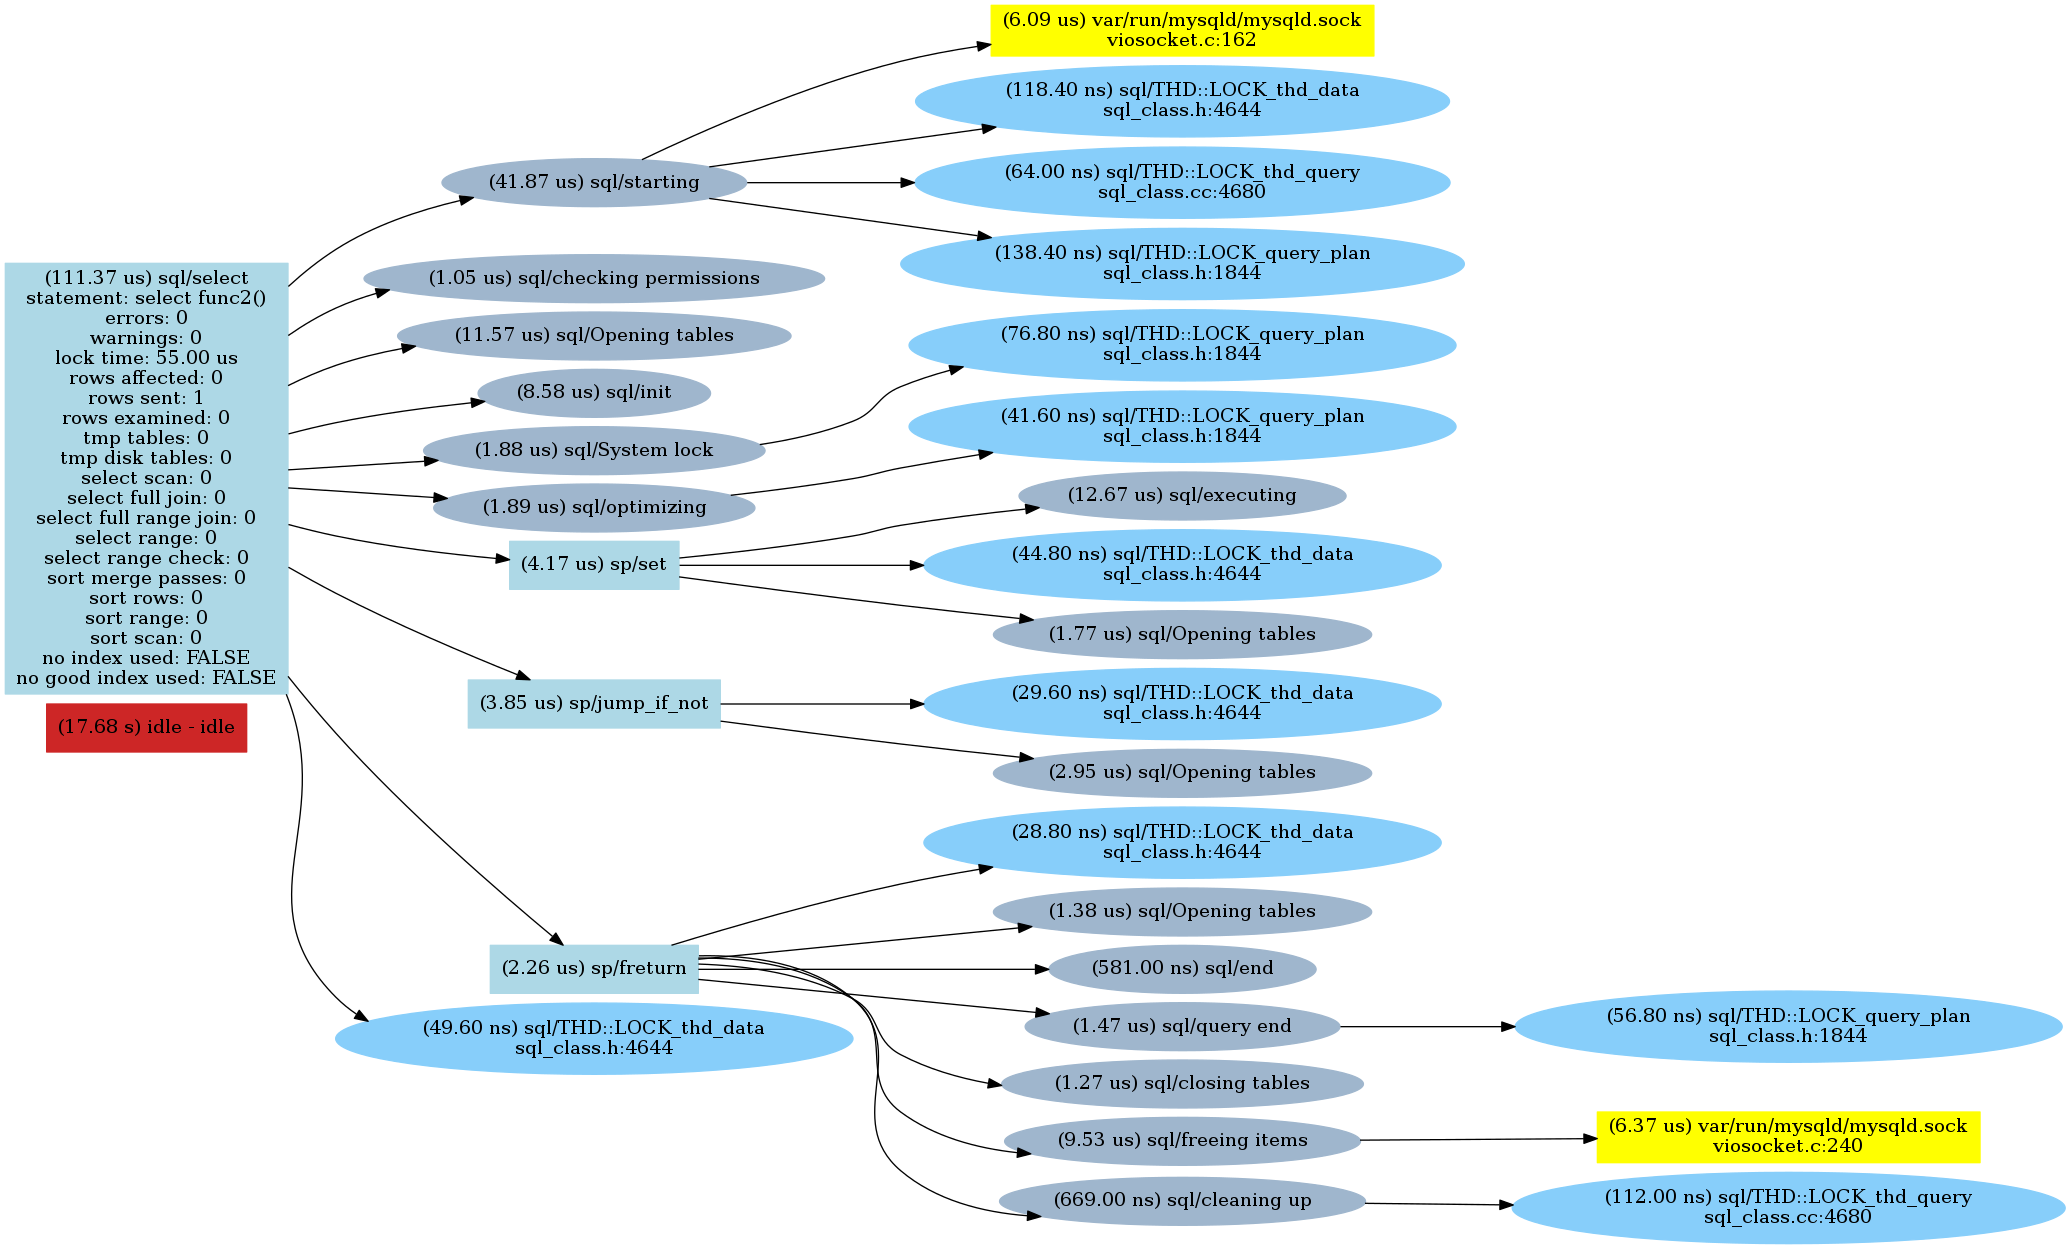
Func3()
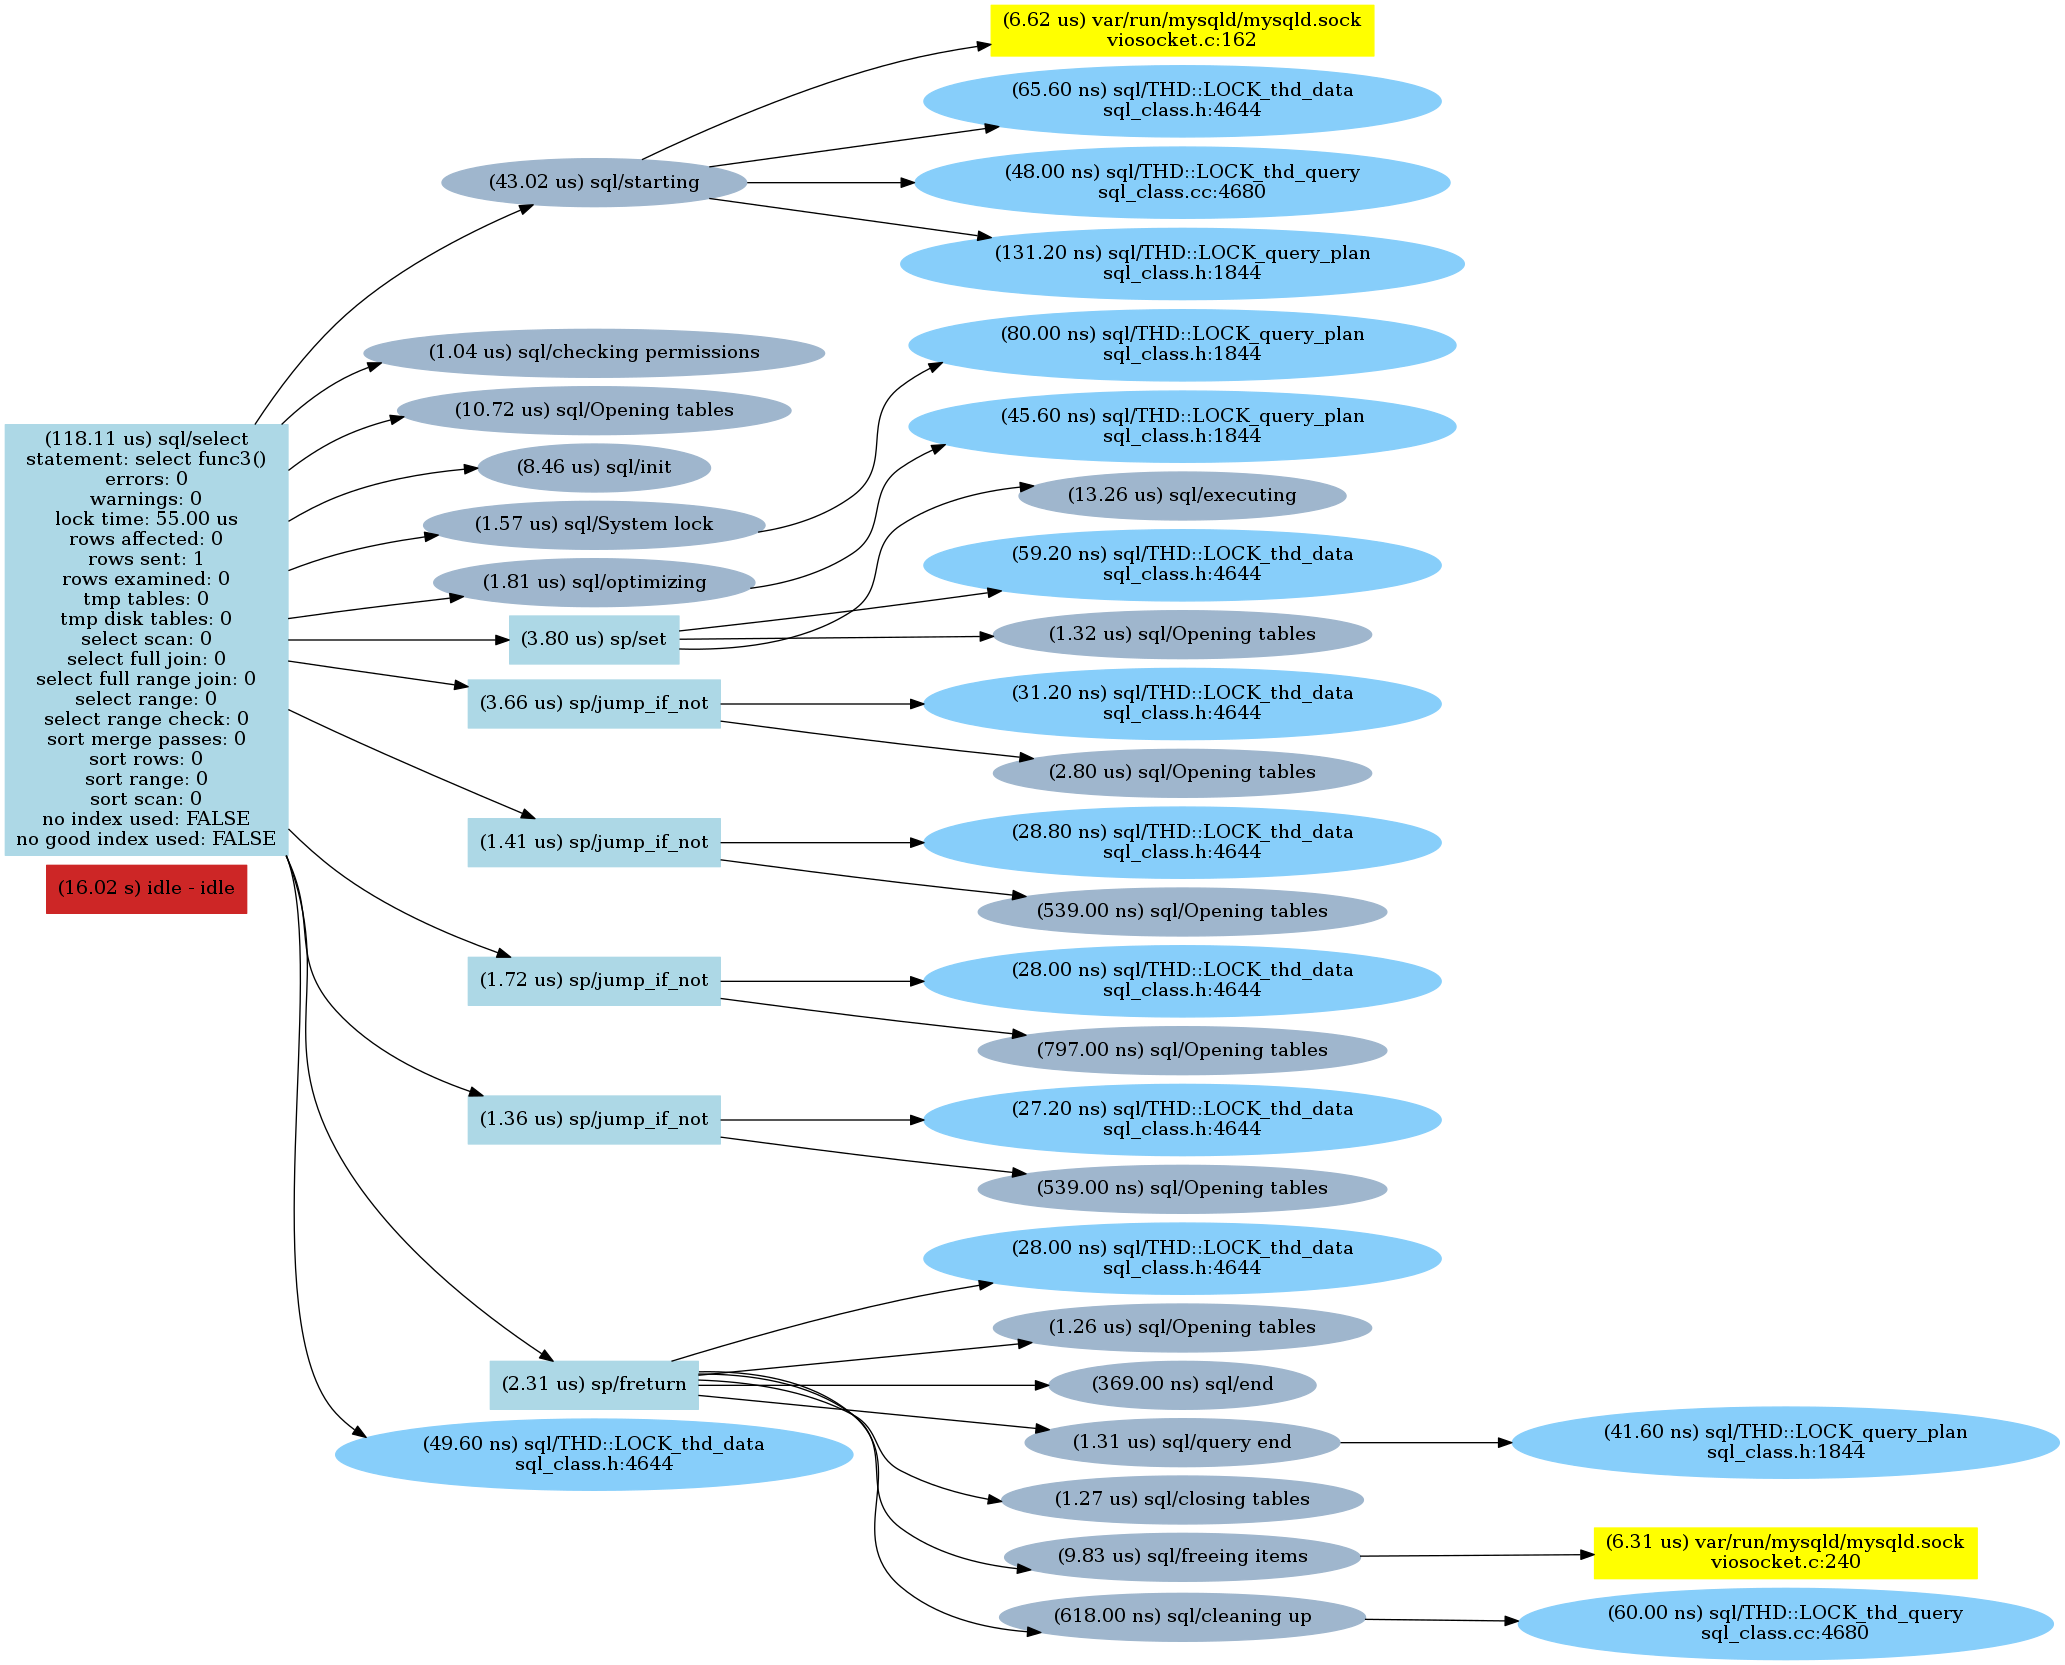
As we can see there is a sp/jump_if_not call for every “if” check followed by an opening tables statement (which is quite interesting). So parsing the “IF” condition made a difference.
For MySQL 8.0 we can also see MySQL source code documentation for stored routines which documents how it is implemented. It reads:
Flow Analysis Optimizations
After code is generated, the low level sp_instr instructions are optimized. The optimization focuses on two areas:Dead code removal,
Jump shortcut resolution.
These two optimizations are performed together, as they both are a problem involving flow analysis in the graph that represents the generated code.The code that implements these optimizations is sp_head::optimize().
However, this does not explain why it executes “opening tables”. I have filed a bug.
Well, if we do not plan to run one million of those stored functions we will never even notice the difference. However, where it will make a difference is … inside a trigger. Let’s say that we have a trigger on a table: every time we update that table it executes a trigger to update another field. Here is an example: let’s say we have a table called “form” and we simply need to update its creation date:
|
1 2 3 |
mysql> update form set form_created_date = NOW() where form_id > 5000; Query OK, 65536 rows affected (0.31 sec) Rows matched: 65536 Changed: 65536 Warnings: 0 |
That is good and fast. Now we create a trigger which will call our dummy func1():
|
1 2 3 4 5 6 7 |
CREATE DEFINER=`root`@`localhost` TRIGGER `test`.`form_AFTER_UPDATE` AFTER UPDATE ON `form` FOR EACH ROW BEGIN declare r int default 0; select func1() into r; END |
Now repeat the update. Remember: it does not change the result of the update as we do not really do anything inside the trigger.
|
1 2 3 |
mysql> update form set form_created_date = NOW() where form_id > 5000; Query OK, 65536 rows affected (0.90 sec) Rows matched: 65536 Changed: 65536 Warnings: 0 |
Just adding a dummy trigger will add 2x overhead: the next trigger, which does not even run a function, introduces a slowdown:
|
1 2 3 4 5 6 7 8 9 10 |
CREATE DEFINER=`root`@`localhost` TRIGGER `test`.`form_AFTER_UPDATE` AFTER UPDATE ON `form` FOR EACH ROW BEGIN declare r int default 0; END mysql> update form set form_created_date = NOW() where form_id > 5000; Query OK, 65536 rows affected (0.52 sec) Rows matched: 65536 Changed: 65536 Warnings: 0 |
Now, lets use func3 (which has “dead” code and is equivalent to func1):
|
1 2 3 4 5 6 7 8 9 10 11 |
CREATE DEFINER=`root`@`localhost` TRIGGER `test`.`form_AFTER_UPDATE` AFTER UPDATE ON `form` FOR EACH ROW BEGIN declare r int default 0; select func3() into r; END mysql> update form set form_created_date = NOW() where form_id > 5000; Query OK, 65536 rows affected (1.06 sec) Rows matched: 65536 Changed: 65536 Warnings: 0 |
However, running the code from the func3 inside the trigger (instead of calling a function) will speed up the update:
|
1 2 3 4 5 6 7 8 9 10 11 12 13 14 15 16 17 18 19 20 21 22 |
CREATE DEFINER=`root`@`localhost` TRIGGER `test`.`form_AFTER_UPDATE` AFTER UPDATE ON `form` FOR EACH ROW BEGIN declare r int default 0; IF 1=2 THEN select levenshtein_limit_n('test finc', 'test func', 1) into r; END IF; IF 2=3 THEN select levenshtein_limit_n('test finc', 'test func', 10) into r; END IF; IF 3=4 THEN select levenshtein_limit_n('test finc', 'test func', 100) into r; END IF; IF 4=5 THEN select levenshtein_limit_n('test finc', 'test func', 1000) into r; END IF; END mysql> update form set form_created_date = NOW() where form_id > 5000; Query OK, 65536 rows affected (0.66 sec) Rows matched: 65536 Changed: 65536 Warnings: 0 |
Potentially, even if the code will never run, MySQL will still need to parse the stored routine—or trigger—code for every execution, which can potentially lead to a memory leak, as described in this bug.
Stored routines and trigger events are parsed when they are executed. Even “dead” code that will never run can significantly affect the performance of bulk operations (e.g. when running this inside the trigger). That also means that disabling a trigger by setting a “flag” (e.g. if @trigger_disable = 0 then ... ) can still affect the performance of bulk operations.
Principal Architect Yves Trudeau provides a rundown on ZFS performance and how it compares to XFS and EXT4. Read his blog, About ZFS Performance, to learn more.
Percona CEO Peter Zaitsev reviews the newest features in MySQL 8 and how they can help your mission-critical applications in his webinar, MySQL 8 for Developers. Click here to watch the webinar by the Percona co-founder.


Nice article, Very well explained and thanks fro drawing the full picture
Interesting findings! I tried declaring the functions with the DETERMINISTIC characteristic, but it made no difference.
I also tried reproducing your results with MariaDB 10.3 and got similar results for func1 vs func2, but func3 performed somewhat better, relatively speaking: func1 x 1M: 1.739 sec, func2 x 1M: 2.249 sec, func3 x 1M: 3.054 sec.
I also tried reproducing the issue with actual stored procedures. The benchmark function doesn’t support calling stored procedures, so I wrote my own benchmark stored procedure. This appears to introduce some overhead compared to the built-in benchmark function, so the results are not directly comparable, but there appears to be a similar effect with stored procedures, i.e. that func2 is slower than func1, and that func3 is slower than func2.
Assuming Oracle (or Percona) fixes the bug (feature?) of MySQL opening tables unnecessarily, then it sounds like there would be no performance impact in using the functions (even with never-executed branches). Right?
Second question: What tables is it even trying to open? You’re doing a select on a function… I’m confused.
nice article,thank you
I was trying to find out how this works and found this comment in sql/sql_class.h
(https://github.com/mysql/mysql-server/blob/4f1d7cf5fcb11a3f84cff27e37100d7295e7d5ca/sql/sql_class.h)
/*
Enum enum_locked_tables_mode and locked_tables_mode member are
used to indicate whether the so-called “locked tables mode” is on,
and what kind of mode is active.
Locked tables mode is used when it’s necessary to open and
lock many tables at once, for usage across multiple
(sub-)statements.
This may be necessary either for queries that use stored functions
and triggers, in which case the statements inside functions and
triggers may be executed many times, or for implementation of
LOCK TABLES, in which case the opened tables are reused by all
subsequent statements until a call to UNLOCK TABLES.
The kind of locked tables mode employed for stored functions and
triggers is also called “prelocked mode”.
In this mode, first open_tables() call to open the tables used
in a statement analyses all functions used by the statement
and adds all indirectly used tables to the list of tables to
open and lock.
It also marks the parse tree of the statement as requiring
prelocking. After that, lock_tables() locks the entire list
of tables and changes THD::locked_tables_modeto LTM_PRELOCKED.
All statements executed inside functions or triggers
use the prelocked tables, instead of opening their own ones.
Prelocked mode is turned off automatically once close_thread_tables()
of the main statement is called.
*/
Though the article is helpful, I don’t like the subject because it seems to discourage stored procedures, functions and triggers. Triggers intrinsically impact performance. I have no doubt. Stored procedures, functions are there for good reasons. The subject should be like Tips that prevent stored procedures, triggers and functions from slowing down performance.
Hello Alexander, thanks for writing this, and while it it is helpful to understand how dead code can impact performance, 95% of all stored procedures don’t contain dead code. I would be much more interested in some real world benchmarks (select, insert, delete, update, complex joins, etc…) compare in performance between stored procedures and inline sql (I come from a MSSQL Server background, where the stored procs are compiled / query plans are cached and give you a significant performance boost. I understand this may not be the case with MySQL, but I would not want to ditch the logic abstraction layer of stored procedures unless there is a significant, real world performance hit. Thanks! ( I may run a few benchmarks myself, if I do I will post here )