
In this blog post, I will discuss the solutions for monitoring databases (which includes alerting) I have worked with and recommended in the past to my clients. This survey will mostly focus on MySQL solutions.
One of the most common issues I come across when working with clients is monitoring and alerting. Many times, companies will fall into one of these categories:
With my clients, I like to talk about what monitoring they need and what will work for them.
Before we get started, I do want to point out that I have borrowed some text and/or graphics from the websites and promotional material of some of the products I’m discussing.
Percona provides a Nagios plugin for database alerts: https://www.percona.com/downloads/percona-monitoring-plugins/.
I also like to point out to clients what metrics are important to monitor long term to make sure there are no performance issues. I prefer the following approach:
| PMM | MonYOG | Severalnines | VividCortex | SelectStar | |
| Databases Supported | MySQL, MongoDB and others with custom addons | MySQL | MySQL, MongoDB, PostgreSQL | MySQL, MongoDB, PostgreSQL, Redis | MySQL, MongoDB, PostgreSQL, Hadoop, Cassandra, Amazon Dynamo, IBM DB2, SQL Server, Oracle |
| Open Source | x | ||||
| Cost | Free | Subscription per node | Subscription per node and free Community Edition | Subscription per instance | Subscription per instance |
| Cloud or On Premises |
On premises | On premises | On premises | Cloud with on premises collector | Cloud with on premises collector |
| Has Agents | x | x | |||
| Monitoring | x | x | x | x | x |
| Alerting | Yes, but requires custom setup | x | x | x | x |
| Replication Topology Management | x | x | |||
| Query Analytics | x | x | x | x | |
| Configuration Management | x | x | |||
| Backup Management | x | ||||
| OS Metrics | x | x | x | x | x |
| Configuration Advisors | x | x | x | ||
| Failover Management | x | x | |||
| ProxySQL and HA Proxy Support |
Monitors ProxySQL | x |
https://www.percona.com/blog/2016/04/18/percona-monitoring-and-management/
https://www.percona.com/doc/percona-monitoring-and-management/index.html
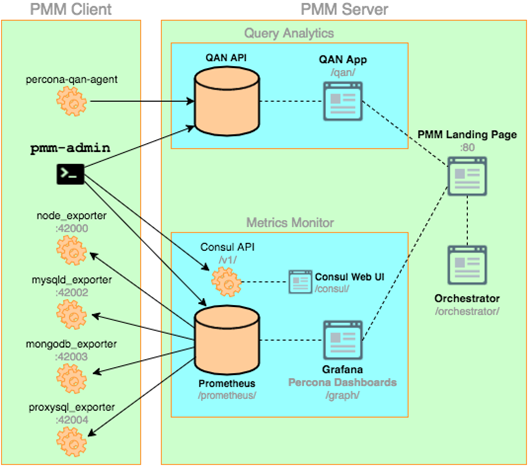
Percona Monitoring and Management (PMM) is a fully open source solution for managing MySQL platform performance and tuning query performance. It allows DBAs and application developers to optimize the performance of the database layer. PMM is an on-premises solution that keeps all of your performance and query data inside the confines of your environment, with no requirement for data to cross the Internet.
Assembled from a supported package of “best-of-breed” open source tools such as Prometheus, Grafana and Percona’s Query Analytics, PMM delivers results right out of the box.
With PMM, anyone with database maintenance responsibilities can get more visibility for actionable enhancements, realize faster issue resolution times, increase performance through focused optimization and better manage resources. More information allows you to concentrate efforts on the areas that yield the highest value, rather than hunting and pecking for speed.
PMM monitors and provides performance data for Oracle’s MySQL Community and Enterprise Servers, as well as Percona Server for MySQL and MariaDB.
In the current version of PMM, custom alerting can be set up. Percona has a guide here: https://www.percona.com/blog/2017/01/23/mysql-and-mongodb-alerting-with-pmm-and-grafana/.
The PMM platform is based on a simple client-server model that enables efficient scalability. It includes the following modules:
Percona recommends certain settings to get the most out of PMM. You can get more information and a guide here: https://www.percona.com/doc/percona-monitoring-and-management/conf-mysql.html.
Severalnines ClusterControl provides access to 100+ key database and host metrics that matter to your operational performance. You can visualize historical performance in custom dashboards to establish operational baselines and capacity planning. It lets you proactively monitor and receive advice to address immediate and potential database and server issues, and ships with over 100 built-in advisors or easily-writeable custom advisors for your specific needs. It is very scriptable and customizable with some effort.
Severalnines has a free community version as well as a commercial offering. The free version includes deployment, monitoring and advisors with a Developer Studio (with which users can create their own advisors).
Severalnines is definitely more sysadmin focused. The best part about it is its ability to deploy and manage deployments of your database with almost no command line work.
The community edition of ClusterControl is “free forever”.
ClusterControl is an agentless management and automation software for database clusters. It helps deploy, monitor, manage and scale your database server/cluster directly from ClusterControl user interface.
ClusterControl consists of four components:
| Component | Package Naming | Role |
| ClusterControl controller (cmon) | clustercontrol- controller | The brain of ClusterControl. A backend service performing automation, management, monitoring and scheduling tasks. All the collected data will be stored directly inside CMON database |
| ClusterControl REST API | clustercontrol-cmonapi | Interprets request and response data between ClusterControl UI and CMON database |
| ClusterControl UI | clustercontrol | A modern web user interface to visualize and manage the cluster. It interacts with CMON controller via remote procedure call (RPC) or REST API interface |
| ClusterControl NodeJS | clustercontrol-nodejs | This optional package is introduced in ClusterControl version 1.2.12 to provide an interface for notification services and integration with 3rd party tools |
https://www.webyog.com/product/monyog
MONyog MySQL Monitor and Advisor is a “MySQL DBA in a box” that helps MySQL DBAs manage more MySQL servers, tune their current MySQL servers and find and fix problems with their MySQL database applications before they can become serious problems or costly outages.
MONyog proactively monitors enterprise database environments and provides expert advice on how even those new to MySQL can tighten security, optimize performance and reduce downtime of their MySQL powered systems.
MONyog is more DBA focused and focuses on the MySQL configuration and queries.
MONyog web server runs on Linux, monitoring MySQL on all platforms and also monitoring OS-data on Linux servers. To retrieve OS metrics, MONyog uses SSH. However, with this scenario (MONyog installed on a Linux machine) MONyog web-server/agent cannot collect Windows OS metrics.
Of course, the client where the MONyog output is viewed can be any browser supporting AJAX on any platform. MONyog can be installed on a remote PC as well as the server. It does not require processing, and with agentless monitoring it can collect and retrieve data from the server.
VividCortex is a good cloud-based tool to see what your production databases are doing. It is a modern SaaS database performance monitoring platform that significantly eases the pain of database performance at scale, on distributed and polyglot systems, for the entire engineering team. It’s hosted for you with industry-leading security, and is continuously improved and maintained. VividCortex measures and analyzes the system’s work and resource consumption. The result is an immediate insight into query performance, better performance and quality, faster time-to-market and reduced cost and effort.
VividCortex is the combination of agent programs, APIs and a web application. You install the agents on your servers, they send data to their APIs, and you access the results through the web application at https://app.vividcortex.com. VividCortex has a diagram on their site showing how it works:
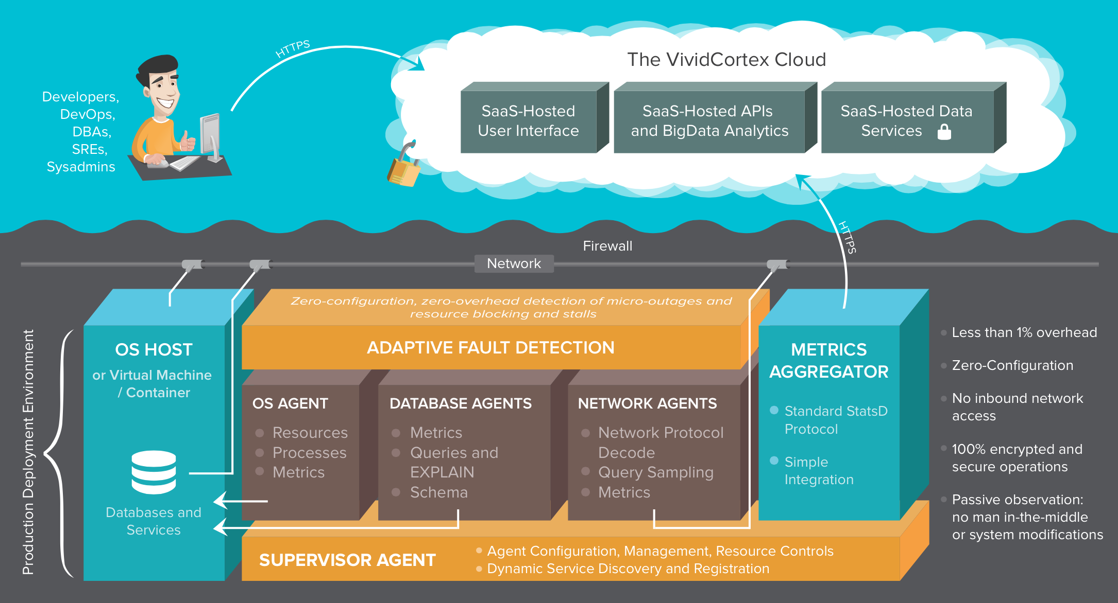
The agents are self-supervising, managed by an agent called vc-agent-007. You can read more about the agents in the agent-specific documentation. They send primarily time-series metrics to the APIs, at one-second granularity. It sometimes sends additional metadata as well. For example, query digests are required to show what query is responsible for specific query-related metrics.
On the backend, a distributed, fully multi-tenant service stores your data separately from all other customers. VividCortex servers are currently hosted in the Amazon AWS public cloud.
SelectStar monitors key metrics for many different database types, and has a comprehensive alerts and recommendations system. SelectStar supports monitoring and alerts on:
The alerts and recommendations are designed to ensure you have an immediate understanding of key issues — and where they are coming from. You can pinpoint the exact database instance that may be causing the issue, or go further up the chain and see if it’s an issue impacting several database instances at the host level.
Recommendations are often tied to alerts — if you have a red alert, there’s going to be a recommendation tied to it on how you can improve. However, the recommendations pop up even if your database is completely healthy — ensuring that you have visibility into how you can improve your configuration before you actually have an issue impacting performance.
Using agentless collectors, SelectStar gathers data from both your on-premises and AWS platforms so that you can have insight into all of your database instances.
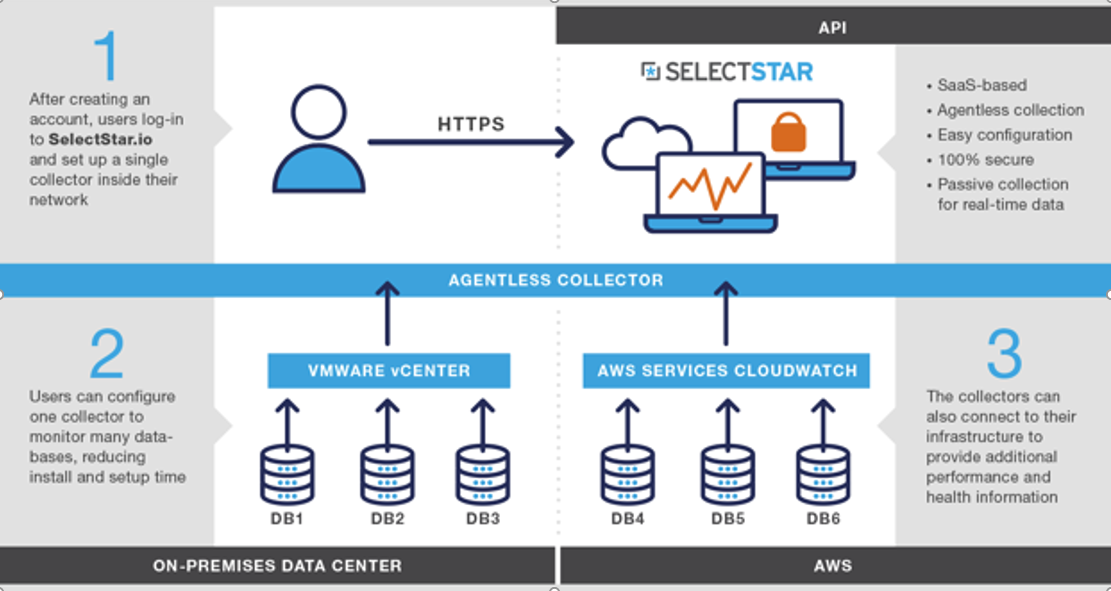
The collector is an independent machine within your infrastructure that pulls data from your database. It is low impact in order to not impact performance. This is a different approach from all of the other monitoring tools I have looked at.
“It depends.” – Peter Z., CEO Percona
As always, I recommend whatever works best for your workload, in your environment, and within the standards of your company’s practices!
Resources
RELATED POSTS


MONyog runs on both Linux and Windows. But not on “non.Linux Unix’es” (OS-X, BSDs. Solaris etc.)
— regards
— Peter Laursen
— Webyog
Also this “Subscription per node” is not quite true for MONyog. The license is perpetual. But access to upgrades requires an active subscription (when purchased directly from us. When purchased through one of our partners, license may depend on an active subscription to partner’s solution)
This comparison forgot the best monitoring tool available for MySQL?
Oracle MySQL Monitoring dashboard is the most complete monitoring solution I have seen and used.
It’s also commercial solution but so are some of the others in the list.
I was looking for a tool that can monitor both MySQL and MariaDB. I’ve tried out some of the above tools and found that Navicat Monitor supports both MySQL and MariaDB and equips all the features mentioned in the comparison table. You may check out details at: https://www.navicat.com/discover-navicat-monitor