
I’ve been running a benchmark today on my old test box with conventional hard drives (no raid with BBU) and noticed something unusual in the CPU utilization statistics being reported.
The benchmark was run like this:
|
1 |
sysbench --num-threads=64 --max-requests=0 --max-time=600000 --report-interval=10 --test=oltp --db-driver=mysql --oltp-dist-type=special --oltp-table-size=1000000 --mysql-user=root --mysql-password=password run |
Which means: create 64 threads and hammer the database with queries as quickly as possible. As the test was run on the localhost I would expect the benchmark to completely saturate the system – being either using CPU or being blocked on IO nature of this benchmark so it does not spend a lot on database locks, especially as this system has just 2 cores.
Looking at VMSTAT however I noticed this:
|
1 2 3 4 5 6 7 8 9 10 11 12 13 14 |
[root@smt1 mysql]# vmstat 10 procs -----------memory---------- ---swap-- -----io---- --system-- -----cpu----- r b swpd free buff cache si so bi bo in cs us sy id wa st 13 0 0 880156 40060 2140824 0 0 12 750 895 1045 32 8 54 6 0 0 0 0 877116 40060 2141312 0 0 0 1783 2185 23112 44 10 41 5 0 15 0 0 872648 40068 2141960 0 0 0 1747 2204 25743 41 11 46 2 0 0 0 0 868056 40068 2142604 0 0 0 1803 2164 26224 40 11 44 5 0 17 1 0 863216 40068 2143160 0 0 0 1875 1948 23020 36 9 50 5 0 0 0 0 858384 40168 2143656 0 0 0 1063 1855 21116 32 9 45 14 0 23 0 0 855848 40176 2144232 0 0 0 1755 2036 23181 36 10 48 6 0 49 0 0 851248 40184 2144648 0 0 0 1679 2313 22832 45 10 40 5 0 10 0 0 846292 40192 2145248 0 0 0 1911 1980 23185 36 9 50 4 0 0 0 0 844260 40196 2145868 0 0 0 1757 2152 26387 39 11 45 5 0 0 3 0 839296 40196 2146520 0 0 0 1439 2104 25096 38 10 50 1 0 |
Looking at last few columns we have IO wait typically being in single digit percents where the “idle” CPU floats in 40-50% range. You can also see it visually in the graph from Percona Cloud Tools
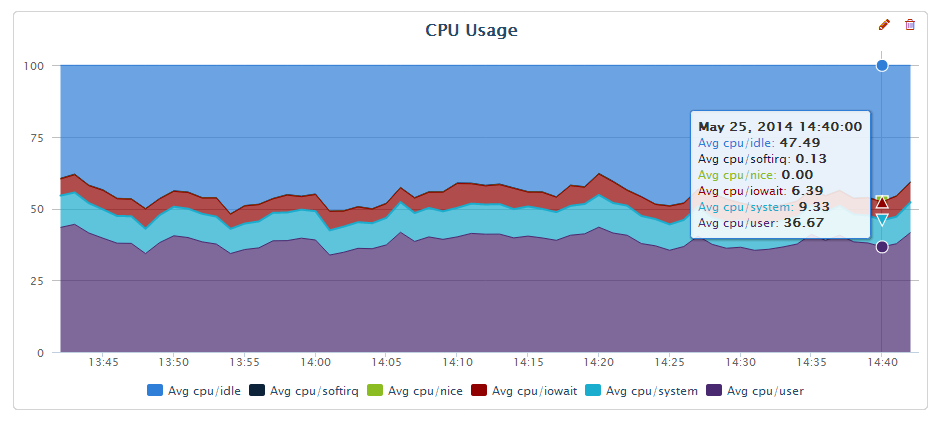
So the system should be completely saturated with the load but instead we have 50% of CPU idle and iowait is typically in single digits?
Running SHOW PROCESSLIST can give us some good idea in this case:
|
1 2 3 4 5 6 7 8 9 10 11 12 13 14 15 16 17 18 19 20 21 |
mysql> show processlist; +-----+---------------+-----------------+--------+---------+------+----------------+--------------------------------------------------------------------+-----------+---------------+-----------+ | Id | User | Host | db | Command | Time | State | Info | Rows_sent | Rows_examined | Rows_read | +-----+---------------+-----------------+--------+---------+------+----------------+--------------------------------------------------------------------+-----------+---------------+-----------+ | 1 | root | localhost:39624 | NULL | Sleep | 0 | | NULL | 0 | 0 | 0 | | ... | 32 | root | localhost | sbtest | Execute | 0 | NULL | COMMIT | 0 | 0 | 0 | | 33 | root | localhost | sbtest | Execute | 0 | NULL | COMMIT | 0 | 0 | 0 | | 34 | root | localhost | sbtest | Execute | 0 | Sorting result | SELECT c from sbtest where id between 365260 and 365359 order by c | 0 | 0 | 0 | | 35 | root | localhost | sbtest | Execute | 0 | NULL | COMMIT | 0 | 0 | 0 | | 36 | root | localhost | sbtest | Execute | 0 | NULL | COMMIT | 0 | 0 | 0 | | 37 | root | localhost | sbtest | Execute | 0 | NULL | COMMIT | 0 | 0 | 0 | | 38 | root | localhost | sbtest | Execute | 0 | Writing to net | DELETE from sbtest where id=496460 | 0 | 1 | 1 | | 39 | root | localhost | sbtest | Execute | 0 | NULL | COMMIT | 0 | 0 | 0 | ... | 89 | root | localhost | sbtest | Execute | 0 | NULL | COMMIT | 0 | 0 | 0 | | 90 | root | localhost | sbtest | Execute | 0 | NULL | COMMIT | 0 | 0 | 0 | | 91 | root | localhost | sbtest | Execute | 0 | NULL | COMMIT | 0 | 0 | 0 | | 268 | root | localhost | NULL | Query | 0 | NULL | show processlist | 0 | 0 | 0 | +-----+---------------+-----------------+--------+---------+------+----------------+--------------------------------------------------------------------+-----------+---------------+-----------+ 68 rows in set (0.00 sec) |
So most of the queries are stalling in COMMIT stage. Checking setting we can see:
|
1 2 3 4 5 6 7 |
mysql> select @@innodb_flush_log_at_trx_commit; +----------------------------------+ | @@innodb_flush_log_at_trx_commit | +----------------------------------+ | 1 | +----------------------------------+ 1 row in set (0.00 sec) |
Which means Percona Server is running in the fully ACID mode, which with slow hard drives without BBU means commit is causing syncing data to the disk which is very expensive.
So we figured out what is really happening… yet if we’re really waiting on disk a lot why iowait does not show that?
To answer that lets see how IOwait is really computed.
IOwait is type of Idle time (and in earlier Linux versions it wasincluded in Idle) – when we have the process/thread which would be runable if it would not be waiting on IO we consider this iowait, if it is not runable because of something else (waiting on mutex, network etc) it is considered idle.
Writes to Innodb log file are serialized – so only one process will be doing log write (and sync) while all others waiting to be able to commit will be waiting on some form of synchronization mechanism to be notified when the commit is complete as part of group commit.
What is the take away? Take iowait% numbers from vmstat/iostat with grain of salt. It is possible there is much more to gain than faster IO subsystem (or proper configuration) than iowait numbers show. Consider the iowait%+idle% of the CPU as “cpu available” which could be potentially put to the good use with improving IO subsystem and minimizing contention
To illustrate that lets take a look at the CPU graph again – now as I’ve set innodb_flush_log_at_trx_commit=2
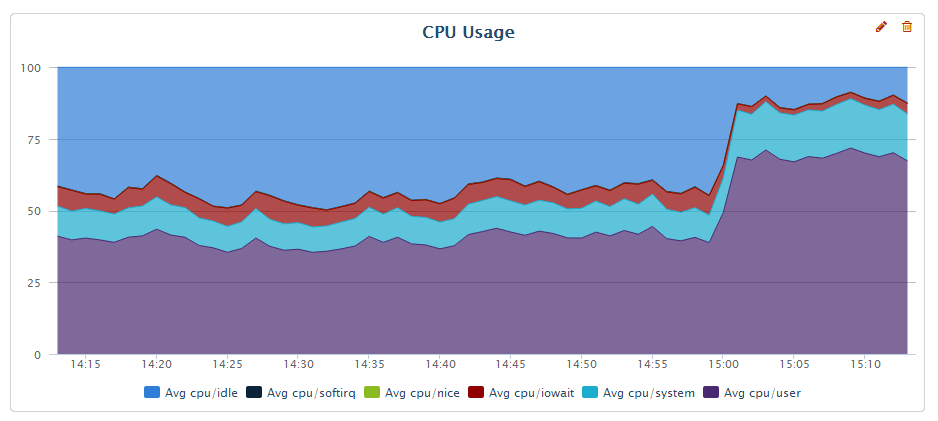
As we can see from the graph we have reclaimed much more than 6-7% of idle time we had – the user CPU usage increased to 70% and idle+iowait is now 10-15%; the throughput of the system has increased about 60% – much more than “eliminating iowait” would allow.


Hi Peter,
it’s exactly for all these reasons the “iowait” was replaced by zero (constant) in Solaris since Solaris 10 😉
but many people ares still continuing to take care about (whatever UNIX platform, probably just by habbit)..
while in fact it’s very easy to demonstrate the useless of this stat value:
– so, you’re running a workload and observing an iowait..
– now in parallel just start few CPU-bound tasks in goal to reach near 100% CPU usage..
– this will greatly reduce your iowait%..
– but the initial workload will still keep the same TPS throughput ;-))
– then question to the user: do you really think your storage became faster since then?? ;-))
Rgds,
-Dimitri
I think you’re looking for %util in iostat -kx 10
That should give you the portion of time that each disk has an outstanding I/O request.
Maybe the title should be do not expect vmstat things that should be explained by MySQL monitoring. Debugging this from a distance, my guess is that in the first case one thread was doing the InnoDB redo log write and the other threads were blocked on a synchronization object for the redo log. That would explain high %idle. Do you have mutex wait stats in your binary to explain where threads are waiting?
Dimitri… yeah this is very good illustration indeed.
Anthony,
I’m not sure if iostat util% is much better. Similar to Dimitri’s illustration I can run single thread workload to get 100% utilization and certain throughput of device. I when can add more IO load and I will see same utilization% and much more throughput. Perhaps I should write the separate blog post on that 🙂
What I really like to look at in terms of IO perforformance is latency for reads and writes; When storage is overloaded the queueing will happen and the latency can go much higher compared to what storage can deliver under normal circumstances.
Mark,
My point is as follows – I see people looking at iowait as the figure to tell us whenever workload is disk IO bound or not. So 5% iowait means it is very little disk bound and getting faster disk would not help which is wrong way to look at this.
You’re right in your analyses one thread will be waiting on flush to complete directly while bunch of others are waiting on synchronization object.
so is this article saying that percona cloud tools charting is inaccurate?
I thought that io % accuracy issue was clarified in the docs. Shouldnt we be charting wait and service times from iostat instead ?
“Percentage of CPU time during which I/O requests were issued to the device (bandwidth utilization for the device). Device saturation occurs when this value is close to 100% for devices serving requests serially. But for devices serving requests in parallel, such as RAID arrays and modern SSDs, this number does not reflect their performance limits.”
http://sebastien.godard.pagesperso-orange.fr/man_iostat.html
Alexis,
I provide both information from VMSTAT and Percona Cloud Tools – the information is the same providing data as reporting the kernel 🙂 The point is how information should be used with care.
About the manual note you provided you can translate it as follow – For any device you should be running your high volume production database on (such as RAID or SSD) the utilization number from iostat is useless. Completely agree with that 🙂
If there is an I/O bottleneck I usually run ‘iostat -x’ and look at the last column(% util) to determine if things are saturated. Though my own cpu graphs still graph io wait from sar (though I think the data is the same as vmstat). Also useful to get data from the storage devices directly if possible, in my case 3PAR storage which has a crap ton of metrics that it collects and it’s really easy to understand for me anyway.
Might the I/O wait show low in this case because a single thread is bottlenecked on I/O (buffer flush?) and the rest of the threads are bottle necked on that one thread? I routinely see I/O backups on systems under heavy load but that doesn’t correspond to bottlenecks on the back end from what I can tell(single digit millisecond response times for spinning rust for the most part), so perhaps file system limitations or thread contention or something.
I used to indirectly support HPUX systems running Oracle about 10 years ago where their I/O wait was consistently above 75% 24×7. CPU user was usually 5% or something. Really crappy application, 50TB+ OLTP instance (at the time almost an order of magnitude larger than the next biggest single OLTP instance for Oracle in the world according to Oracle anyway).
Though there are certain types of MySQL queries that can absolutely blow out the cache on my storage systems, those are isolated to a few servers and we have pt query killer running there to nail them before they impact everyone else on the shared storage.
We have an instance of MySQL slave @ AWS which is acting very weird, very much like this example. Looking at iostat %util section shows 54% usage and top shows 7.1%us, 2.7%sy, 39.3%id, 50.3%wa of CPU usage, yet server still has replication lag / can’t keep up with master. I would say even %util is misleading. In my case disk was problematic… Even though %util showed 50% utilization, when I upgraded disk to io optimized, it catched replication in no-time.
AWS is just terrible all around, can’t trust any of the numbers, 2-3 years of working with their cloud was by far the worst experience in my professional career, couldn’t pay me enough to go back(people try constantly).
Just one example, I remember this specific event we even had a call with some tech person over at Amazon and they said “WOW that is awesome you got 4,000 IOPS”.
http://elreg.nateamsden.com/rds-cloudwatch.png (from early 2012 I think, about the time we moved out)
Too many others to cite, I try to block them from my mind.
do the math and the numbers are laughable.
Hello,
Do the same set of steps and run vmstat like this and see what it shows
vmstat 3 10
Above command shall run for every 3 seconds and you will get 10 values.
The command which you have run gives the default value of system start up values.
Your being somewhat misleading. the IO-wait stat is measuring exactly what it’s supposed to in all the cases being discussed – the amount of time a CPU core has spent waiting for IO. That the application being ran – MySQL – is only using a single thread (and therefore CPU core) to perform IO, and that other threads are waiting for the IO thread doesn’t invalidate the measurement – you’re just mistaken about it’s usefulness in this case and probably need a different measurement.
The first graph is correct – your CPUs are 50% idle, and you could use that 50% CPU for something else (as long as it does no IO) without impacting your MySQL performance at all.
My brother suggested I would possibly like this blog.
He was totally right. This publish truly made my day. You cann’t
imagine simply how so much time I had spent for this info!
Thank you!