
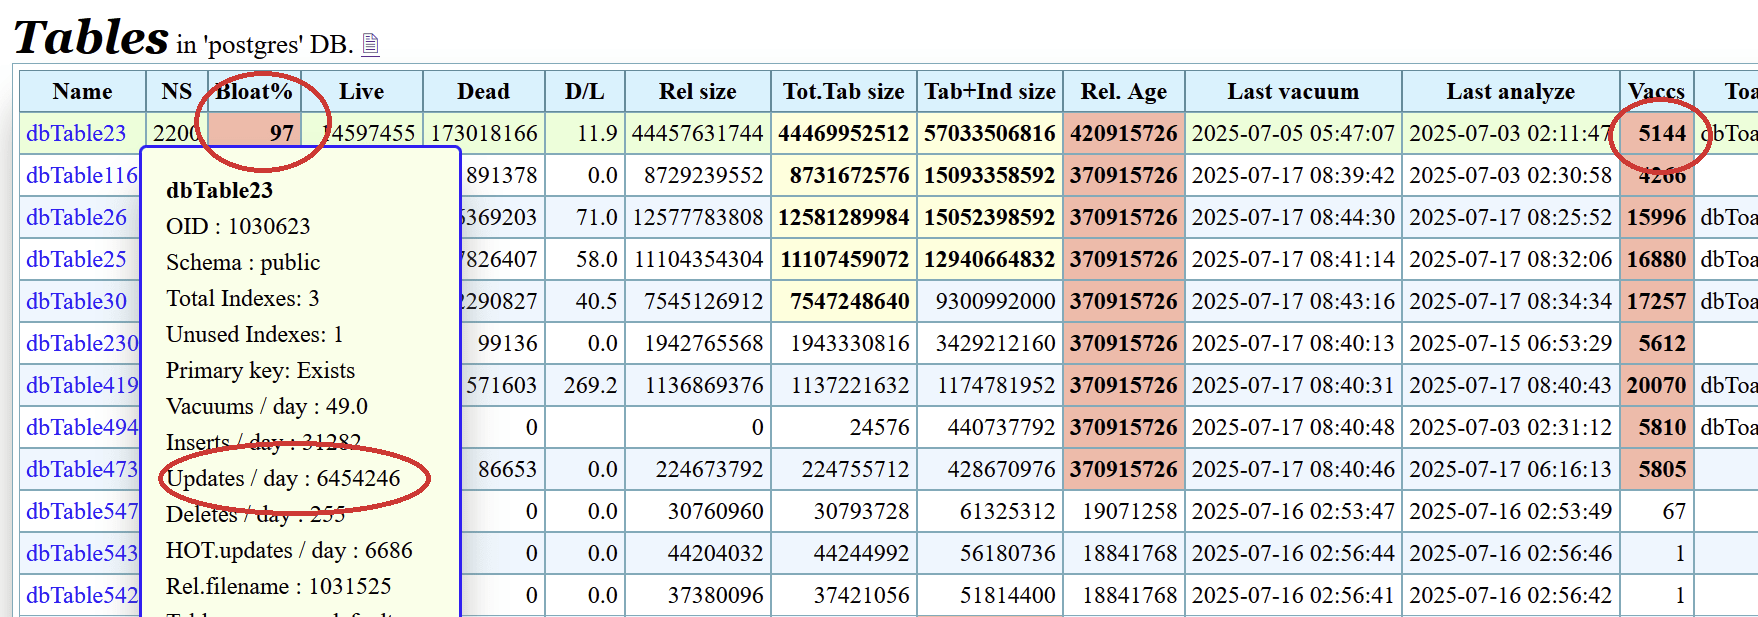
In many real production databases, we often see some tables receiving high-frequency updates (millions per day) and autovacuum running repeatedly (hundreds of times per day). Additionally, those tables can sometimes become heavily bloated. The end effect is poor performance, poor concurrency, and an unmanageable database.
In case we are using methods pg_gather for diagnosis, such anomalies are easy to spot by clicking on the table header to sort.
Very often, a closer look at these tables reveals that status-update workloads are driving these heavy updates. Many times, even the table names reveal their purpose through words like “task”, “queue”, or “bucket”. A discussion with application architects often reveals that these tables are used for specific workflows, with status fields tracking what is completed and what remains pending for further processing. There can also be multiple workflow stages. Sounds like use case for Kafka, right? Yes, Kafka is widely used to manage such workflows.
While this is happening on the database side, the buzz around “Just use PostgreSQL” is becoming increasingly popular. System designers and architects want to reduce the complexity of maintaining multiple components and dealing with operational issues. More complexity implies more potential failures. Recently, Chandan Shukla wrote a blog post titled PostgreSQL as a Workflow Engine: Building Reliable Long-Running AI Jobs Without Kafka, detailing trade-offs and considerations for building a simple yet reliable workflow engine using simple methods.
Yet, critical questions remain:
Yes, we can. Furthermore, when building modern enterprise applications where data arrives as events that trigger subsequent workflows, I strongly recommend modeling the architecture around those events from the very beginning. . This concept is not new in the PostgreSQL ecosystem, However it is important to periodically highlight wonderful community tools, especially since PostgreSQL projects lack a centralized marketing framework. The original PgQ was created by Marko Kreen as part of Skytools. Largely forgotten for over 20 years—perhaps due to limited documentation—it was brought back into the spotlight by community members like Alexander Kukushkin through talks at various PostgreSQL conferences, such as PostgreSQL queues done right with PgQ – POSETTE 2026.
Later, Nikolay Samokhvalov took on the effort to refresh the framework by modernizing the codebase as PgQue, providing better documentation, and delivering informative talks. PgQue does not require any binary extensions to be installed or added to the system.
A generic queue implementation in PostgreSQL using native SQL features like FOR UPDATE SKIP LOCKED can lead to massive table bloat, concurrency bottlenecks, and performance degradation over a time. In contrast, a queue implementation leveraging PostgreSQL-specific features—such as storing snapshot information and identifying transactions completed between two snapshots—avoids these pitfalls entirely. Instead of updating event status flags in place, events are simply inserted into an append-only log (a partitioned table). This approach transfers the responsibility of tracking the position of consumption to the consumer, which is far cheaper to maintain and resolves the issues mentioned above. No more updates, bloat, or concurrency issues on the queue log! An additional advantage of this approach is that there can be multiple consumers working on the same event log/Queue.
PgQue provides all above mentioned advantages as a ready to use framework, such that noone need to spend time in reinventing all those good learnings and intricacies of PostgreSQL snapshots.
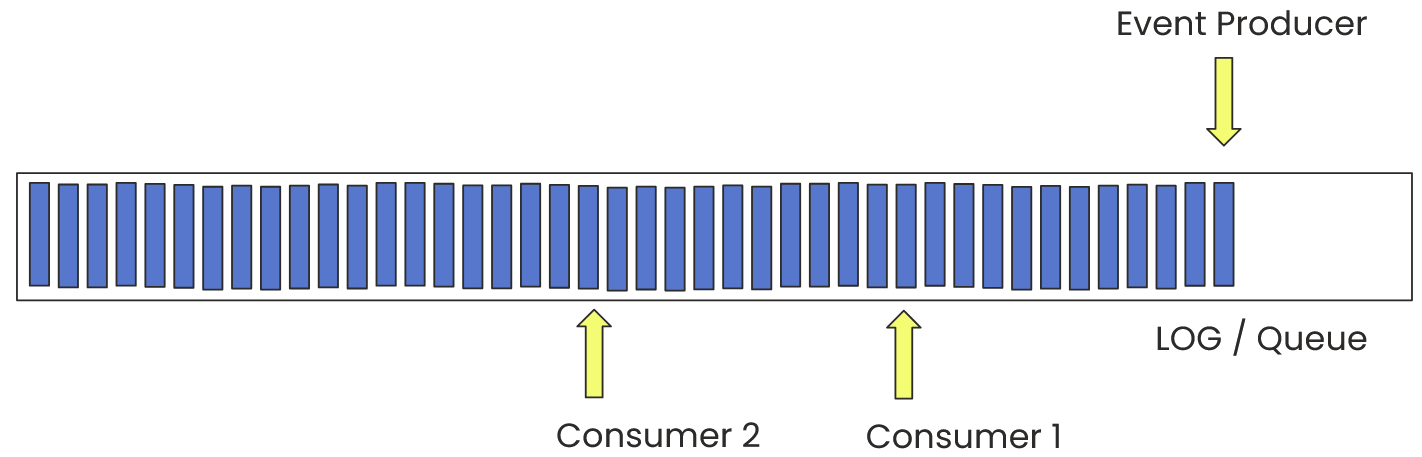
Despite the name, PgQue is not a queue in the usual sense: events are not removed when consumed. Ack simply advances that consumer’s cursor. The model is a shared, append-only log — closer to a Kafka topic, and closest of all to Pulsar, whose subscription model is almost the same. Every registered consumer keeps its own position over the same events and independently sees all of them; the events are stored once, with no copy per subscriber.
Two things Kafka has, PgQue does not. There are no partitions — so no per-key ordering guarantee. And the cursor is not an offset: it points at a tick (a time slice), not at a message, so a consumer commits “through tick 900”, never “through event 4712”. Retention differs too — space is reclaimed by rotating and truncating tables, but only once the slowest consumer has moved past them. The guaranteed rewind window is one rotation period 2 hours by default, and a stalled consumer blocks reclamation rather than losing data. But the PgQue offers queue semantics Kafka leaves to the application: per-consumer redelivery – a failed event is re-appended as a private copy visible only to the consumer that “nack”ed it, a built-in dead-letter queue (DLQ), and competing consumers via the cooperative-consumer API — Pulsar’s Shared subscription, and marked experimental as of writing this blog.
Events are batched, which means that a single fetch request by a consumer can return a list of events in a batch. This significantly reduces back-and-forth network interactions with the server. Once the consumer finishes processing those events, it sends an acknowledgment to the server, which increments the pointer to the next batch. Yes, Please note that acknowledgement is per batch, not per message. So if the processing of a specific message fails, that message needs to be negatively acknowledged, before the batch is acknowledged.
Batch boundaries are marked by a ticker (a clock ticker), which ticks at scheduled intervals—such as every 1/10th of a second or every second. Only transactions completed between the previous batch and the current batch are visible to consumers.
PgQ’s core mechanics—snapshot-based batching, tick generation, TRUNCATE-based table rotation, and per-consumer cursors—are carried over entirely rather than cherry-picked.
What PgQue changes is everything that previously made the engine difficult to deploy: C extensions, external daemons, overly permissive default roles, and the requirement for users to explicitly manage ticks.
pgque.ticker_loop() is a procedure, allowing it to commit between iterations. pg_cron triggers it once per second, and within that second, it ticks at the specified interval. The configuration parameter pgque.config.tick_period_ms sets this rate—100 ms by default, tunable to any exact divisor of 1000 ms.
Some of the main features include:
An application client can use raw SQL APIs provided by PgQue or leverage official client libraries. As of writing this article, client libraries exist for Python, Go, TypeScript, and Ruby under the “client” directory of the repository. If you are using a programming language other than these four, the existing client libraries can serve as a reference implementation.
I am going to mention only how to use it. But if you are interested in how internally it works, I would recommend this blog and concepts
In case, you want to test producers and consumers from a psql commandline prompt, the necessary steps are covered with detailed explanations in the tutorial.
The producer simply needs to publish events to the queue using PL/pgSQL functions provided by the PgQue as follows:
|
1 |
select pgque.send('orders', '{"order_id": 43, "total": 10.00}'::jsonb); |
where “orders” is the queue name and the JSONB string represents the message payload.
If this is an active queue, no additional steps are needed. However, on lower-activity queues (default 500 events since the last tick), you can manually trigger a tick using the pgque.force_next_tick() function as follows, because ticking is throttled to avoid wastages.
|
1 |
select pgque.force_next_tick('orders'); |
The background ticker will then assign this event to the next batch.
On the consumer side, call the pgque.receive() function:
|
1 |
select * from pgque.receive('orders', 'processor', 100); |
following is a sample output:
|
1 2 3 4 5 6 7 |
postgres=> select * from pgque.receive('orders', 'processor', 100); msg_id | batch_id | type | payload | retry_count | created_at | extra1 | extra2 | extra3 | extra4 --------+----------+---------------+-----------------+-------------+-------------------------------+--------+--------+--------+-------- 2003 | 8 | order.created | {"order_id": 1} | | 2026-09-04 14:08:57.472283-04 | | | | 2004 | 8 | order.created | {"order_id": 2} | | 2026-09-04 14:08:57.472283-04 | | | | 2005 | 8 | order.created | {"order_id": 3} | | 2026-09-04 14:08:57.472283-04 | | | | (3 rows) |
In lower-activity queues, consumers may encounter empty batches (batches containing no events). Empty batches require no acknowledgment; calling receive() automatically completes them and advances the consumer cursor. Conversely, non-empty batches must be acknowledged via ack(); otherwise, subsequent calls will repeatedly return the same unacknowledged batch. The standard consumer processing loop follows this pattern:
following SQL snippet demonstrates this logic when testing from a psql session:
|
1 2 3 4 5 6 7 8 9 10 11 12 13 14 15 16 17 18 19 20 21 22 23 24 25 26 27 28 29 30 31 32 33 34 35 36 37 38 39 40 41 42 |
do $$ declare v_head bigint; v_msgs pgque.message[]; m pgque.message; v_prev bigint; v_now bigint; v_pass int := 0; begin select last_tick_id into v_head from pgque.get_queue_info('orders'); loop v_pass := v_pass + 1; select last_tick into v_prev from pgque.get_consumer_info('orders', 'processor'); select coalesce(array_agg(r), '{}') into v_msgs from pgque.receive('orders', 'processor', 1000) as r; if array_length(v_msgs, 1) > 0 then foreach m in array v_msgs loop raise notice 'msg_id=% type=% payload=%', m.msg_id, m.type, m.payload; end loop; perform pgque.ack(v_msgs[1].batch_id); raise notice 'batch % acked, % messages, pass %', v_msgs[1].batch_id, array_length(v_msgs, 1), v_pass; exit; -- drop this line to drain everything end if; commit; -- one batch per transaction select last_tick into v_now from pgque.get_consumer_info('orders', 'processor'); exit when v_now >= v_head; -- caught up to where we started exit when v_now = v_prev; -- cursor stalled: no further tick exit when v_pass > 2000; -- safety guard end loop; raise notice 'passes=% last_tick=%', v_pass, v_now; end $$ |
Now, consider a common scenario: a consumer receives a batch of events, but while some events process successfully, others fail. How should this be handled?
This is where negative acknowledgments (nack) apply. Any events that fail processing must be negative-acknowledged before acknowledging the entire batch. Here is an example statement to nack message ID 2004 within batch ID 8:
|
1 2 3 |
select pgque.nack(8, m, '30 seconds', 'downstream 503') from pgque.receive('orders', 'processor', 100) as m where m.msg_id = 2004; |
Once all failed messages in a batch have been negative-acknowledged, the consumer can safely acknowledge the batch:
|
1 |
select pgque.ack(8); |
Execution order is critical here because calling ack() advances the consumer cursor past the batch window. Negative-acknowledged messages are moved to a retry queue and re-enqueued into the main queue after the specified delay (30 seconds in this example).
If a consumer repeatedly fails to process an event, will it retry indefinitely? No. Similar to Kafka, PgQue implements a Dead Letter Queue (DLQ). Once the configured retry threshold is exceeded, the event moves to the DLQ. You can configure the maximum retry count using:
|
1 |
select pgque.set_queue_config('orders', 'max_retries', '2'); |
The zero-bloat behavior pioneered by PgQ has proven effective in production since 2007. PgQue inherits these benefits along with its core architectural strengths: snapshot-based batching, tick generation, TRUNCATE-based table rotation, and consumer cursor tracking. System performance, stability, and scalability heavily depend on solid design. PgQue offers a simple, well-architected framework to implement workflow management entirely inside PostgreSQL, eliminating the need for external tools like Kafka.
To see performance and efficiency comparisons with other approaches, check out https://pgque.dev/images/death_spiral.gif.
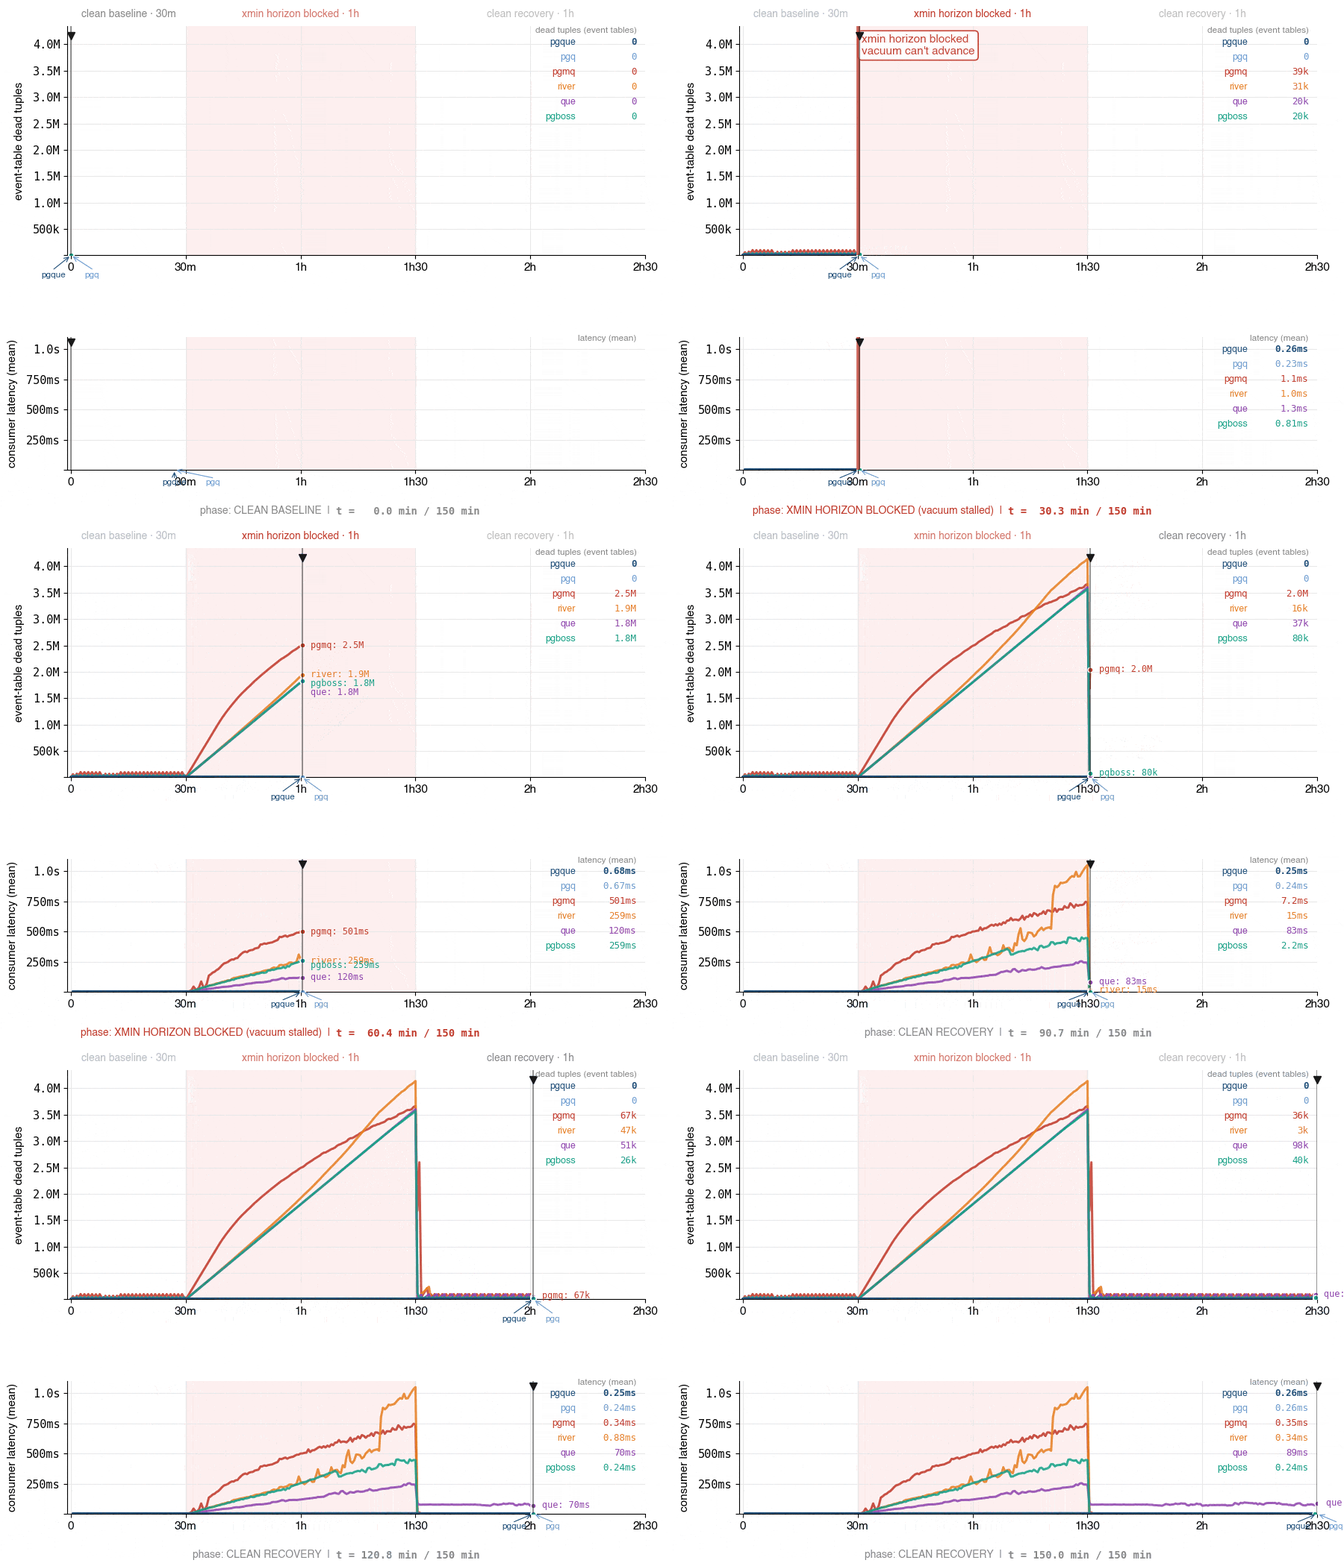
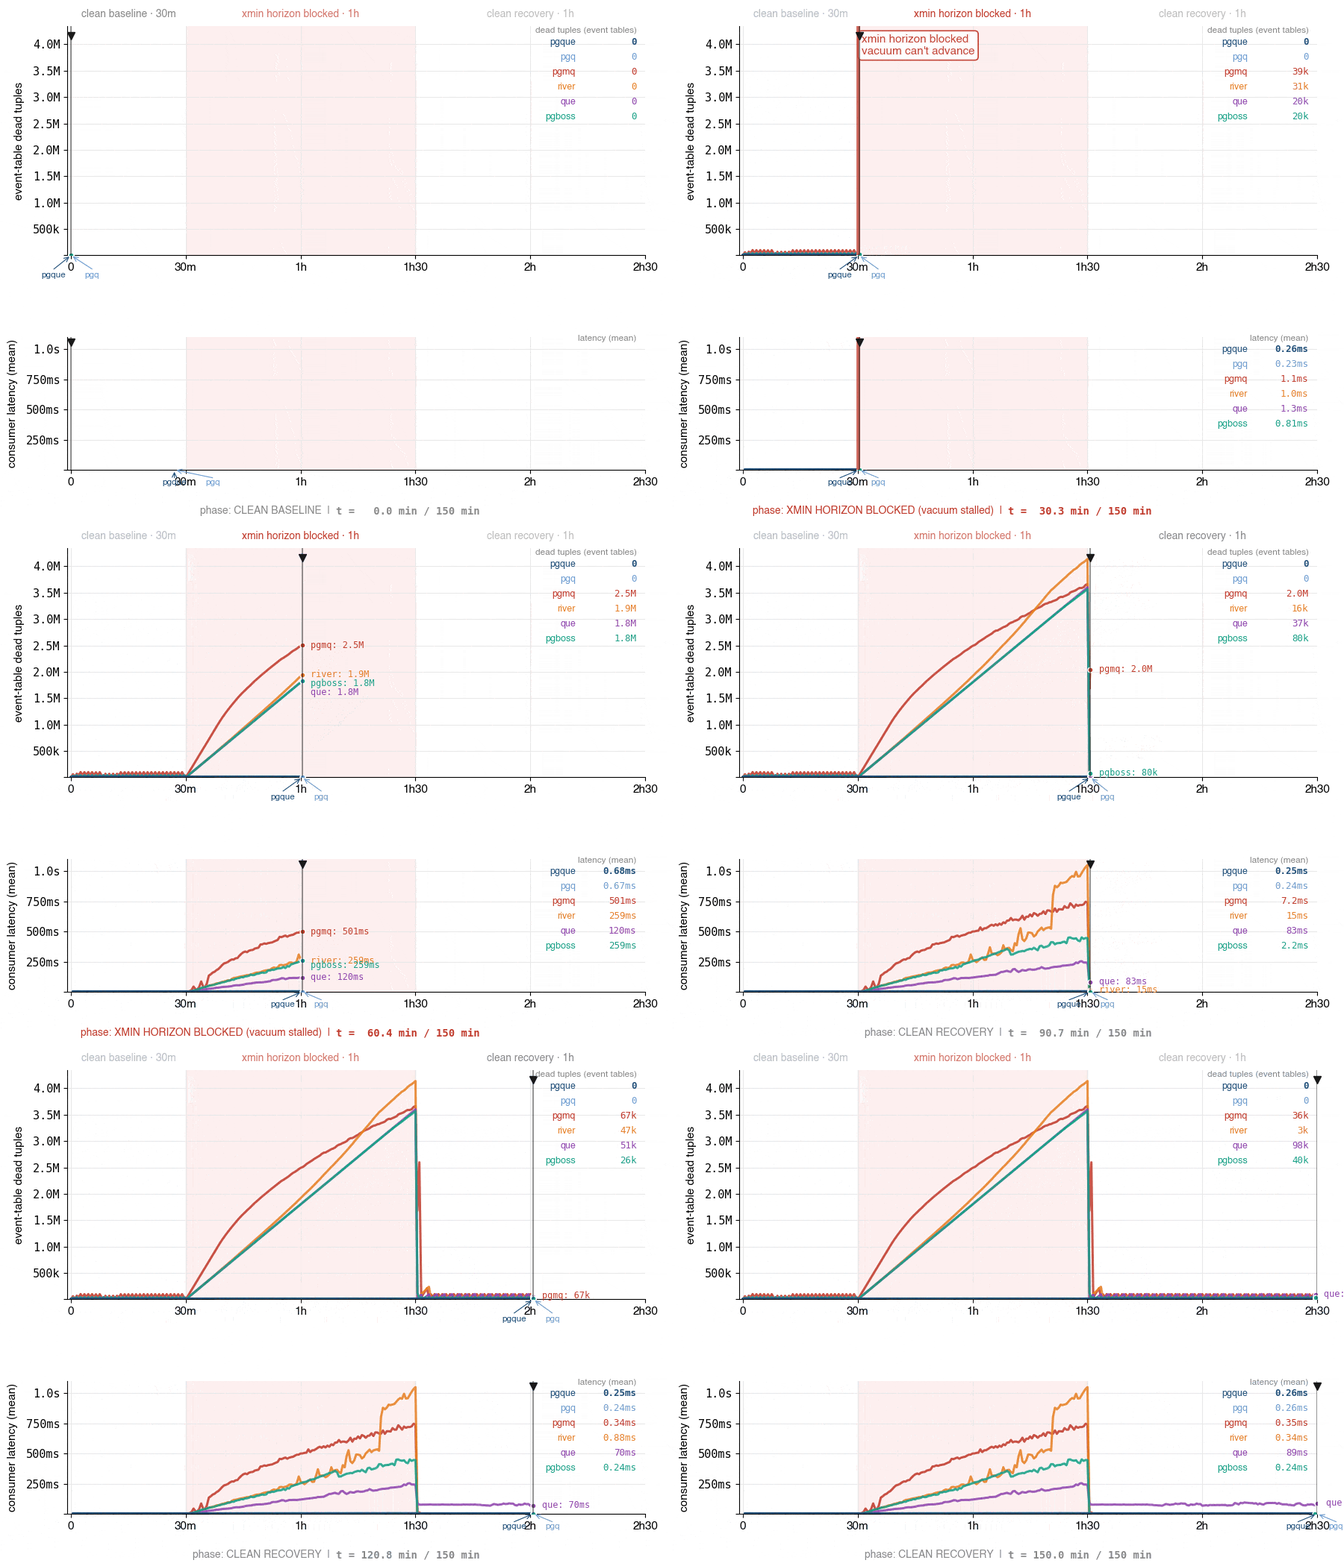
As shown in the graph, there are no spikes in the XID horizon or consumer latency. Metric lines for both PgQue and PgQ remain consistently low and near-flat during testing.
Resources
RELATED POSTS