

In this blog post, we’ll compare pgBackRest’s compression algorithms and levels to find where spending more CPU stops buying a meaningfully smaller backup. The short version of the answer, which we’ll build up to with real numbers, is that Zstandard at a low level is the sweet spot, and its default (zst(3)) already sits right on the shoulder of the curve.
To make the inflection points (or “knees”) in the curves more visible, we sampled each algorithm at closely spaced levels across its whole range. Everything here was measured on PostgreSQL 18.4, more precisely Percona Distribution for PostgreSQL 18.4, with pgBackRest 2.59.0.
There are two options: compress-type picks the algorithm (none, gz, lz4, zst, or bz2), and compress-level picks how hard that algorithm works. The catch is that both the valid range and the default level depend on the algorithm you chose, so a “level 9” means different things in gz versus zst. Here is how they look like:
|
1 2 3 4 5 |
compress-type level range default gz [-1, 9] 6 lz4 [-5, 12] 1 zst [-7, 22] 3 bz2 [1, 9] 9 |
Note that zst runs all the way to 22 and that the negative levels are the “fast” modes, trading ratio for speed. The default algorithm in pgBackRest is gz, so if you never touch these settings you’re running gz(6).
You can set both on a per-backup basis on the command line:
|
1 |
shell> pgbackrest --stanza=db --type=full --compress-type=zst --compress-level=3 backup |
We kept pgBackRest stock. The configuration file is simple, using only the minimal options it needs to work:
|
1 2 3 4 5 6 7 |
[global] repo1-path=/var/lib/pgbackrest repo1-retention-full=2 [db] pg1-path=/var/lib/pgsql/18/data pg1-port=5432 |
The repository is a local filesystem, not S3 or object storage. There’s also no encryption, no bundling, and no block incremental, so everything is the stock repository format. Compression was the only thing we varied, and we varied it per run on the command line. We also used --process-max=8 (the default is 1) purely to cut wall-clock time. That doesn’t distort the comparison, because our cost metric is CPU-seconds summed across all the worker children, which is independent of how many workers split the job. Only wall-clock changes with parallelism. Every backup was a fresh --type=full so each run is independent and directly comparable. The Postgres side was stock too, with archive_mode=on and wal_level=replica.
Note: One option worth a mention is block incremental (repo-block, off by default), which splits files into blocks so that incremental backups store only the blocks that changed, saving repository space and speeding up delta restores. Fully testing with it is out of the scope of this blog, but do know it exists and it can affect your results. In a quick check, turning it on left zst(3) almost unchanged but made a zst(22) backup about 22% larger, with savings falling from 74% to 68%. If you run with block incremental, the case against using the ultra high compression levels only gets stronger.
To exercise the algorithms on realistic, heterogeneous data rather than one synthetic table, we loaded the public Stack Exchange data dump for askubuntu.com, about 4 GiB once in PostgreSQL. It mixes large text bodies (post and comment HTML) with integer-and-timestamp-heavy tables like votes and badges, and it’s fully reproducible from a public source.
The cost metric throughout is CPU-seconds (user + system), not wall-clock, precisely because it’s stable regardless of how many cores you throw at the job or what else the host is doing. And these are numbers from our hardware. Treat the shape of the curves as the takeaway, not the absolute seconds, and measure on a representative backup of your own data before you commit to a setting.
Each backup was a fresh full backup wrapped in /usr/bin/time -v, and we took the median of three runs per setting. The zst(3) run, for example, looks like this:
|
1 2 3 4 5 6 7 |
shell> /usr/bin/time -v pgbackrest --stanza=db --type=full \ --compress-type=zst --compress-level=3 --process-max=8 backup ... User time (seconds): 56.57 System time (seconds): 2.61 Percent of CPU this job got: 421% Elapsed (wall clock) time (h:mm:ss or m:ss): 0:14.05 |
The two numbers we care about are user and system seconds. Adding them gives the CPU-seconds figure we compare across settings (here, about 59), while the elapsed time shows what parallelism bought us on wall-clock (about 14 seconds in total with eight running workers).
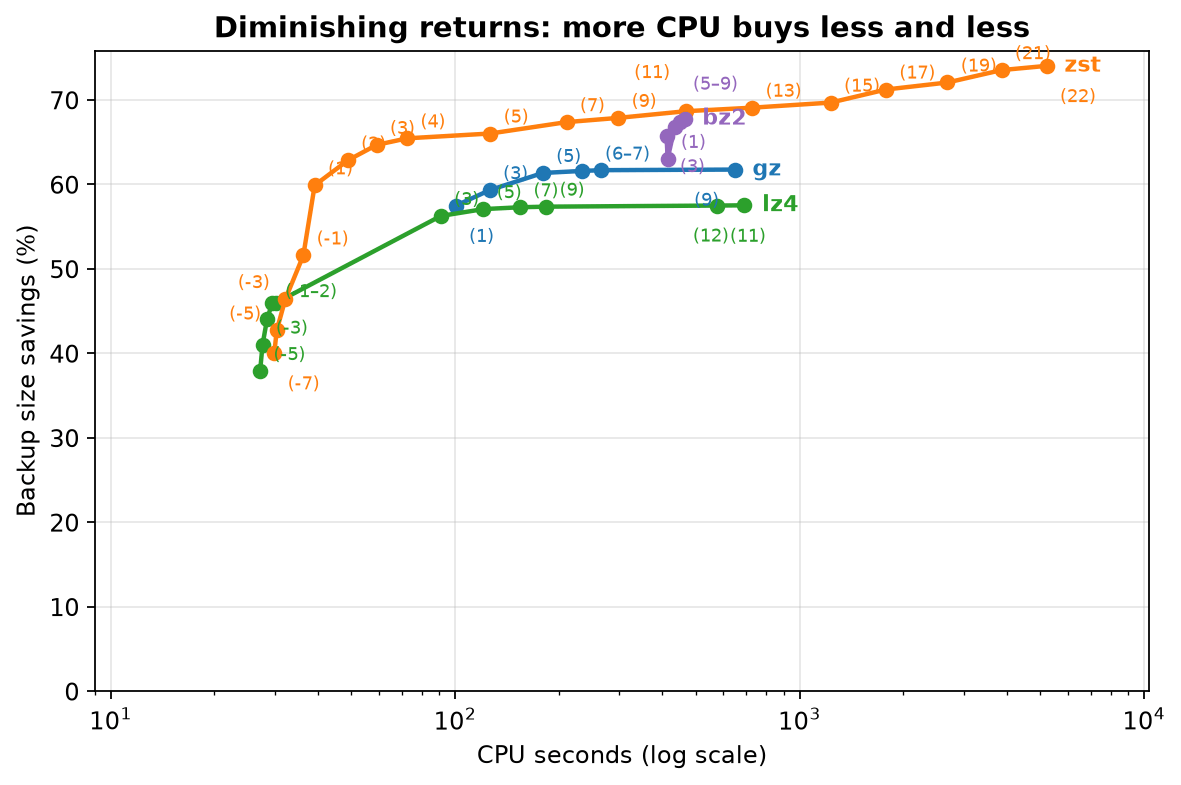
The full picture is easiest to see as a chart. Each line is one algorithm and its levels, with savings on one axis and CPU cost on the other:
Check the Appendix at the bottom for a table with the full results.
Zstandard has its knee between levels 1 and 5. Efficiency declines gently across the low levels, then drops at level 5, and collapses beyond it. That gentle-then-steep shape is exactly why the default, zst(3), is so well placed! It sits on the middle, delivering 64.7% savings for 59 CPU-seconds. Push on to zst(22) and you get the smallest file in the whole test (74.0%), but it costs 5217 CPU-seconds, roughly 88 times the CPU of zst(3), for nine more points (reducing the size of the backup file by roughly one quarter). The ultra levels (19 to 22) are even worse: on the order of 45 to 90 times the cost of zst(3) for single-digit gains.
LZ4 is only useful at level 1 or below. lz4(1) and lz4(2) are identical in practice, then there’s a cliff at lz4(3): savings increase but CPU triples. From there it stays flat while the cost keeps climbing, all the way to 692 CPU-seconds at lz4(12) for basically the same gains. Above its default, LZ4 is dominated by zst. It shines on the cheap, fast end, and also uses a sane default.
gzip flattens out early, around level 5. gz(6), the pgBackRest default, is another reasonable choice, since there’s almost nothing left to gain above it: gz(9) costs 2.8 times the CPU for two-tenths of a point more. On ratio-per-CPU it’s dominated by zst at every level, so there’s no level of gz that zst doesn’t beat at the same cost.
bzip2 never makes it onto the frontier. It’s flat, sitting between 63% and 68% savings while burning 411 to 464 CPU-seconds regardless of level. zst(9) matches bz2(9)‘s 67.8% for less CPU, so there’s no case where you’d reach for it. You are already paying a high price at any level, and the cost barely grows with them, so using the max level as default is not such a bad choice.
Putting all of the data together in one graph, the efficient frontier (nothing is both smaller and cheaper) is easy to see:
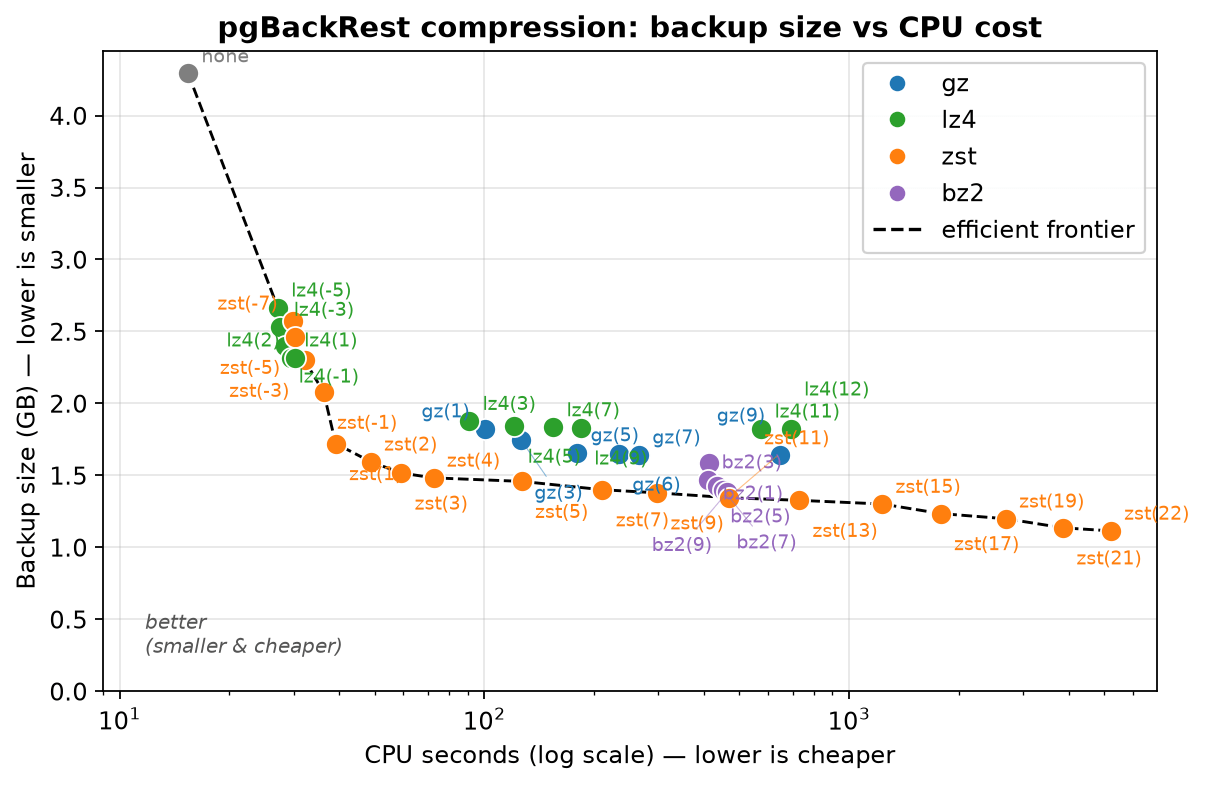
LZ4 owns the cheap end (its fast, negative levels), and zst owns everything from about 46% savings on up. The one thing to avoid is zst‘s own negative levels, which are worse than lz4 at the same cost, so if you want cheap-and-fast reach for lz4 instead of fast zst.
pgBackRest compresses the physical files on disk, and different tables hold very different bytes, so the ratio you get depends heavily on your schema. For example, here’s what each relation compressed to at zst(3). We measured this by compressing each relation’s on-disk files directly (heap and TOAST main forks) with zstd(3), the same bytes pgBackRest reads:
|
1 2 3 4 5 6 7 |
relation data type zst(3) ratio votes numeric 5.2x badges numeric 5.1x posthistory text 3.0x posts (heap) text 2.6x comments text 2.5x posts (TOAST) text 1.4x |
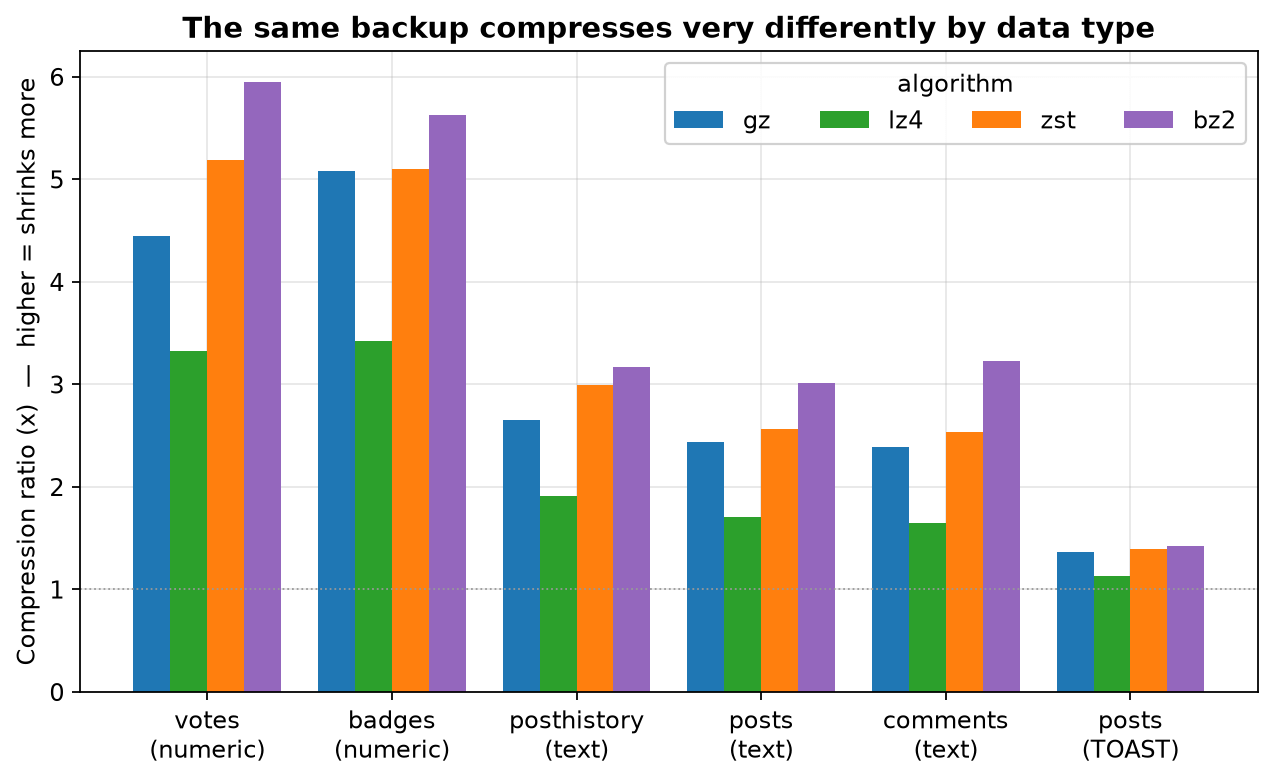
The numeric tables like votes and badges squeeze down more than 5x, while the big text bodies land around 2.5 to 3x. The interesting one is posts TOAST at only 1.4x, and there’s a reason for it: PostgreSQL already compresses them, so by the time the data reaches pgBackRest there’s little left to be done. You can see it in the stored sizes for the same 361 MB of raw text under different TOAST strategies. We took the same 100k large post bodies and stored them three ways, changing only the column’s TOAST compression, and measured the resulting TOAST size:
|
1 2 3 4 5 6 |
variant | stored size -------------------------+------------- raw text (sum length) | 361 MB pglz (PG default) | 94 MB lz4 | 117 MB external (uncompressed) | 406 MB |
CPU-seconds tell you what a setting costs, but they don’t tell you how long the backup takes. Here is the same data seen as a rate: how many megabytes each setting works through per second.
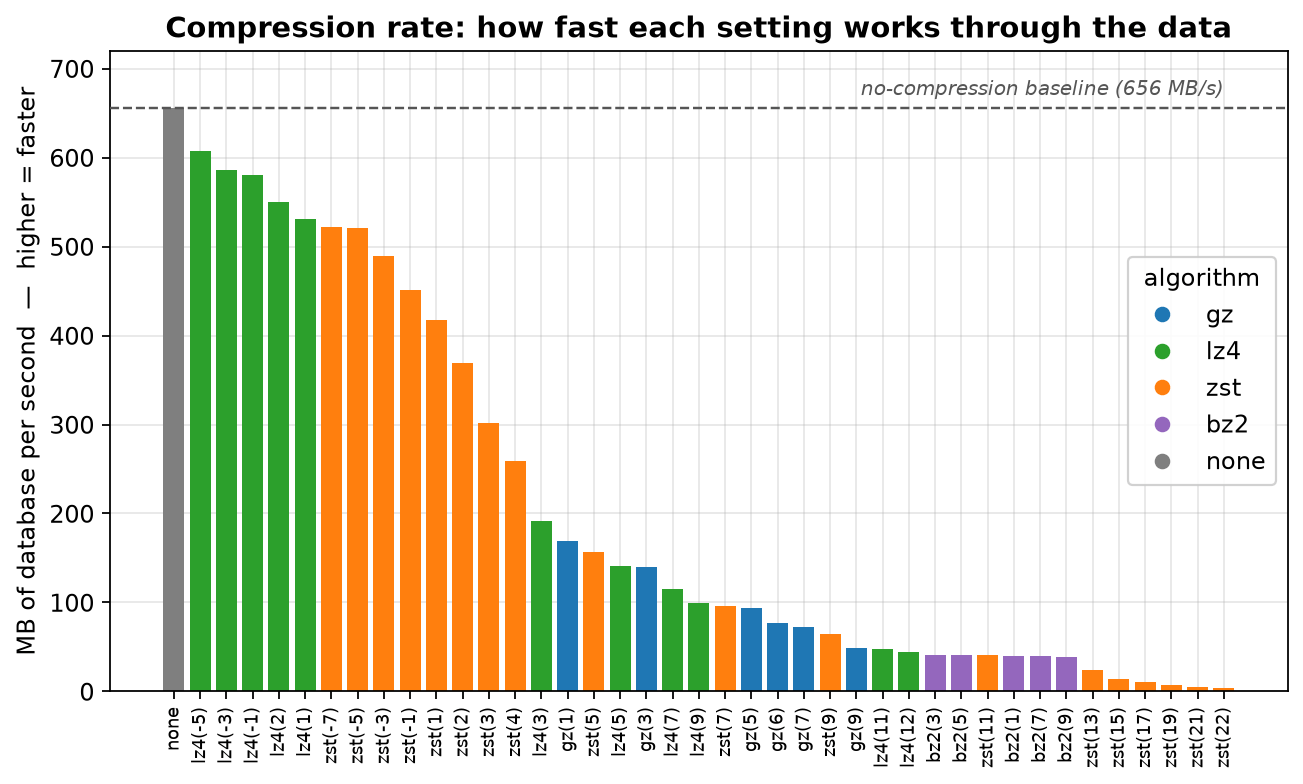
Here is a slice of the same numbers, with the per-GB CPU cost next to the rate:
|
1 2 3 4 5 6 7 8 9 10 11 |
setting MB/s CPU-s/GB saved% none 656.3 3.6 -0.0% lz4(-5) 607.9 6.3 37.9% lz4(1) 531.2 6.9 46.0% zst(1) 417.9 9.1 59.9% zst(3) 302.3 13.8 64.7% zst(5) 157.3 29.5 66.0% gz(6) 76.6 54.5 61.6% zst(9) 64.3 69.4 67.9% bz2(9) 38.8 108.0 67.8% zst(22) 3.5 1215.6 74.0% |
Those are two different numbers answering two different questions. MB/s is what we measured on this host with eight workers, so it tells you how fast it went here. CPU-s/GB is the one that travels, because it’s a property of the algorithm and the data rather than of how many cores you own. Multiply it by the size of your database and you have the CPU bill for one full backup, whatever you set --process-max to. The rate curve bends where the cost curve bends, so the settings that are cheap on CPU are also the ones that finish quickly. There’s no separate trade-off to reason about for your backup window.
Note: the fast end of the chart isn’t only measuring the compressor. For instance, lz4(-5) runs at 93% of the no-compression baseline, which means it’s mostly bound by reading and writing the data. On storage that can’t sustain that throughput, the tall bars would flatten out to whatever your disks do, while zst(5) and the slower settings would barely move, so take this into account when reviewing your results. These are also rates for a single 4 GiB dataset held warm in RAM on one host, with eight workers that bought us about 4x, not 8x. Use them to compare settings against each other, then measure your own database before you plan a maintenance window around a number.
Ranking all 40 compression settings by efficiency presents the data in yet another way:
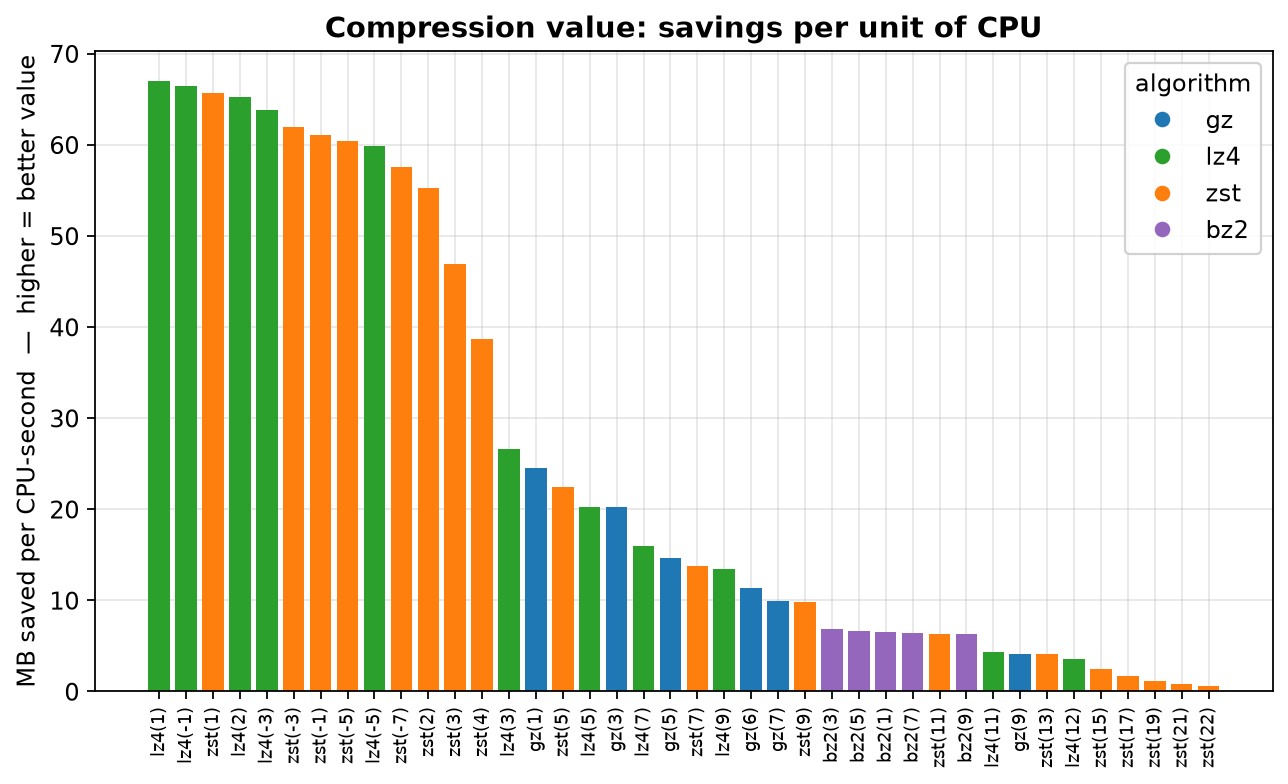
So what should you actually set? A few recommendations:
As mentioned above, measure on a representative backup of your own data before changing a production setting. Your schema and your data mix will decide where your knee falls.
The trade-off between backup size and CPU is non-linear, and sampling closely across each range is what makes the knees visible (if you only sample a few levels per algorithm you may lose the real inflection points). zst(3) sits right where the curve bends, which is why it’s a good default. Throughput bends at the same levels, so a tight backup window doesn’t push you toward a different setting than a busy CPU does. This is a straightforward setting to get right: pick zst, keep the level low, and you’re most of the way there. Try it on your own data and let us know the numbers you get!
For completeness, here is every setting we measured (each value is the median of three full backups).
--process-max=8|
1 2 3 4 5 6 7 8 9 10 11 12 13 14 15 16 17 18 19 20 21 22 23 24 25 26 27 28 29 30 31 32 33 34 35 36 37 38 39 40 41 42 |
algo level size(GiB) saved% CPU-s wall-s MB/s CPU-s/GB savedMB/CPU-s none - 4.00 0.0% 15.4 6.5 656.3 3.6 - gz 1 1.70 57.5% 100.4 25.4 168.9 23.4 24.6 gz 3 1.63 59.3% 126.1 30.6 140.3 29.4 20.2 gz 5 1.54 61.4% 179.8 45.7 94.0 41.9 14.6 gz 6 1.53 61.6% 233.9 56.0 76.6 54.5 11.3 gz 7 1.53 61.7% 265.5 58.9 72.9 61.8 10.0 gz 9 1.53 61.8% 648.2 88.3 48.6 151.0 4.1 lz4 -5 2.48 37.9% 27.2 7.1 607.9 6.3 59.9 lz4 -3 2.36 41.0% 27.6 7.3 586.3 6.4 63.8 lz4 -1 2.23 44.1% 28.5 7.4 580.8 6.6 66.5 lz4 1 2.16 46.0% 29.5 8.1 531.2 6.9 67.0 lz4 2 2.16 46.0% 30.3 7.8 550.3 7.1 65.2 lz4 3 1.75 56.3% 90.9 22.4 191.7 21.2 26.6 lz4 5 1.72 57.1% 120.8 30.3 141.5 28.2 20.3 lz4 7 1.71 57.3% 154.5 37.4 114.7 36.0 15.9 lz4 9 1.70 57.4% 183.9 43.0 99.9 42.9 13.4 lz4 11 1.70 57.5% 574.4 89.5 48.0 133.8 4.3 lz4 12 1.70 57.5% 691.9 97.8 43.9 161.2 3.6 zst -7 2.40 40.0% 29.9 8.2 521.5 7.0 57.5 zst -5 2.29 42.7% 30.3 8.2 520.9 7.1 60.4 zst -3 2.14 46.4% 32.2 8.8 488.8 7.5 62.0 zst -1 1.93 51.6% 36.3 9.5 451.3 8.4 61.1 zst 1 1.60 59.9% 39.1 10.3 417.9 9.1 65.7 zst 2 1.48 62.9% 48.8 11.6 369.1 11.4 55.3 zst 3 1.41 64.7% 59.2 14.2 302.3 13.8 46.9 zst 4 1.38 65.5% 72.6 16.5 259.5 16.9 38.7 zst 5 1.36 66.0% 126.6 27.3 157.3 29.5 22.4 zst 7 1.30 67.4% 210.7 44.8 95.9 49.1 13.7 zst 9 1.28 67.9% 297.7 66.7 64.3 69.4 9.8 zst 11 1.25 68.7% 467.2 105.6 40.6 108.9 6.3 zst 13 1.24 69.1% 729.3 181.5 23.7 169.9 4.1 zst 15 1.21 69.7% 1231.8 310.4 13.8 287.0 2.4 zst 17 1.15 71.2% 1782.8 426.1 10.1 415.4 1.7 zst 19 1.12 72.1% 2688.7 627.2 6.8 626.4 1.2 zst 21 1.06 73.5% 3860.8 948.3 4.5 899.5 0.8 zst 22 1.04 74.0% 5217.4 1232.8 3.5 1215.6 0.6 bz2 1 1.48 63.0% 414.0 106.8 40.2 96.5 6.5 bz2 3 1.37 65.7% 411.2 104.0 41.3 95.8 6.9 bz2 5 1.33 66.7% 434.0 104.3 41.1 101.1 6.6 bz2 7 1.31 67.4% 451.3 108.4 39.6 105.1 6.4 bz2 9 1.29 67.8% 463.5 110.7 38.8 108.0 6.3 |