
We are excited to announce the release of Percona Monitoring and Management (PMM) V2.37, which includes a revamped Inventory view, new experimental dashboards for Kubernetes monitoring, as well as many other improvements and new features. See the full list of changes in the release notes.
To get started with PMM 2.37, check out the PMM Quickstart guide. Please consult the upgrade instructions if you’re upgrading from a previous version.
This release of PMM starts the series of enhancements that will improve how you work with Services and Nodes in PMM. With this first set of changes, we’re revamping the Inventory page to give you more context on your inventory objects and more actionable information for exploring and fixing possible issues.
Let’s review all of these changes separately.
The new Inventory page now provides a much clearer design and emphasizes useful information while downplaying reference details like service labels and IDs.
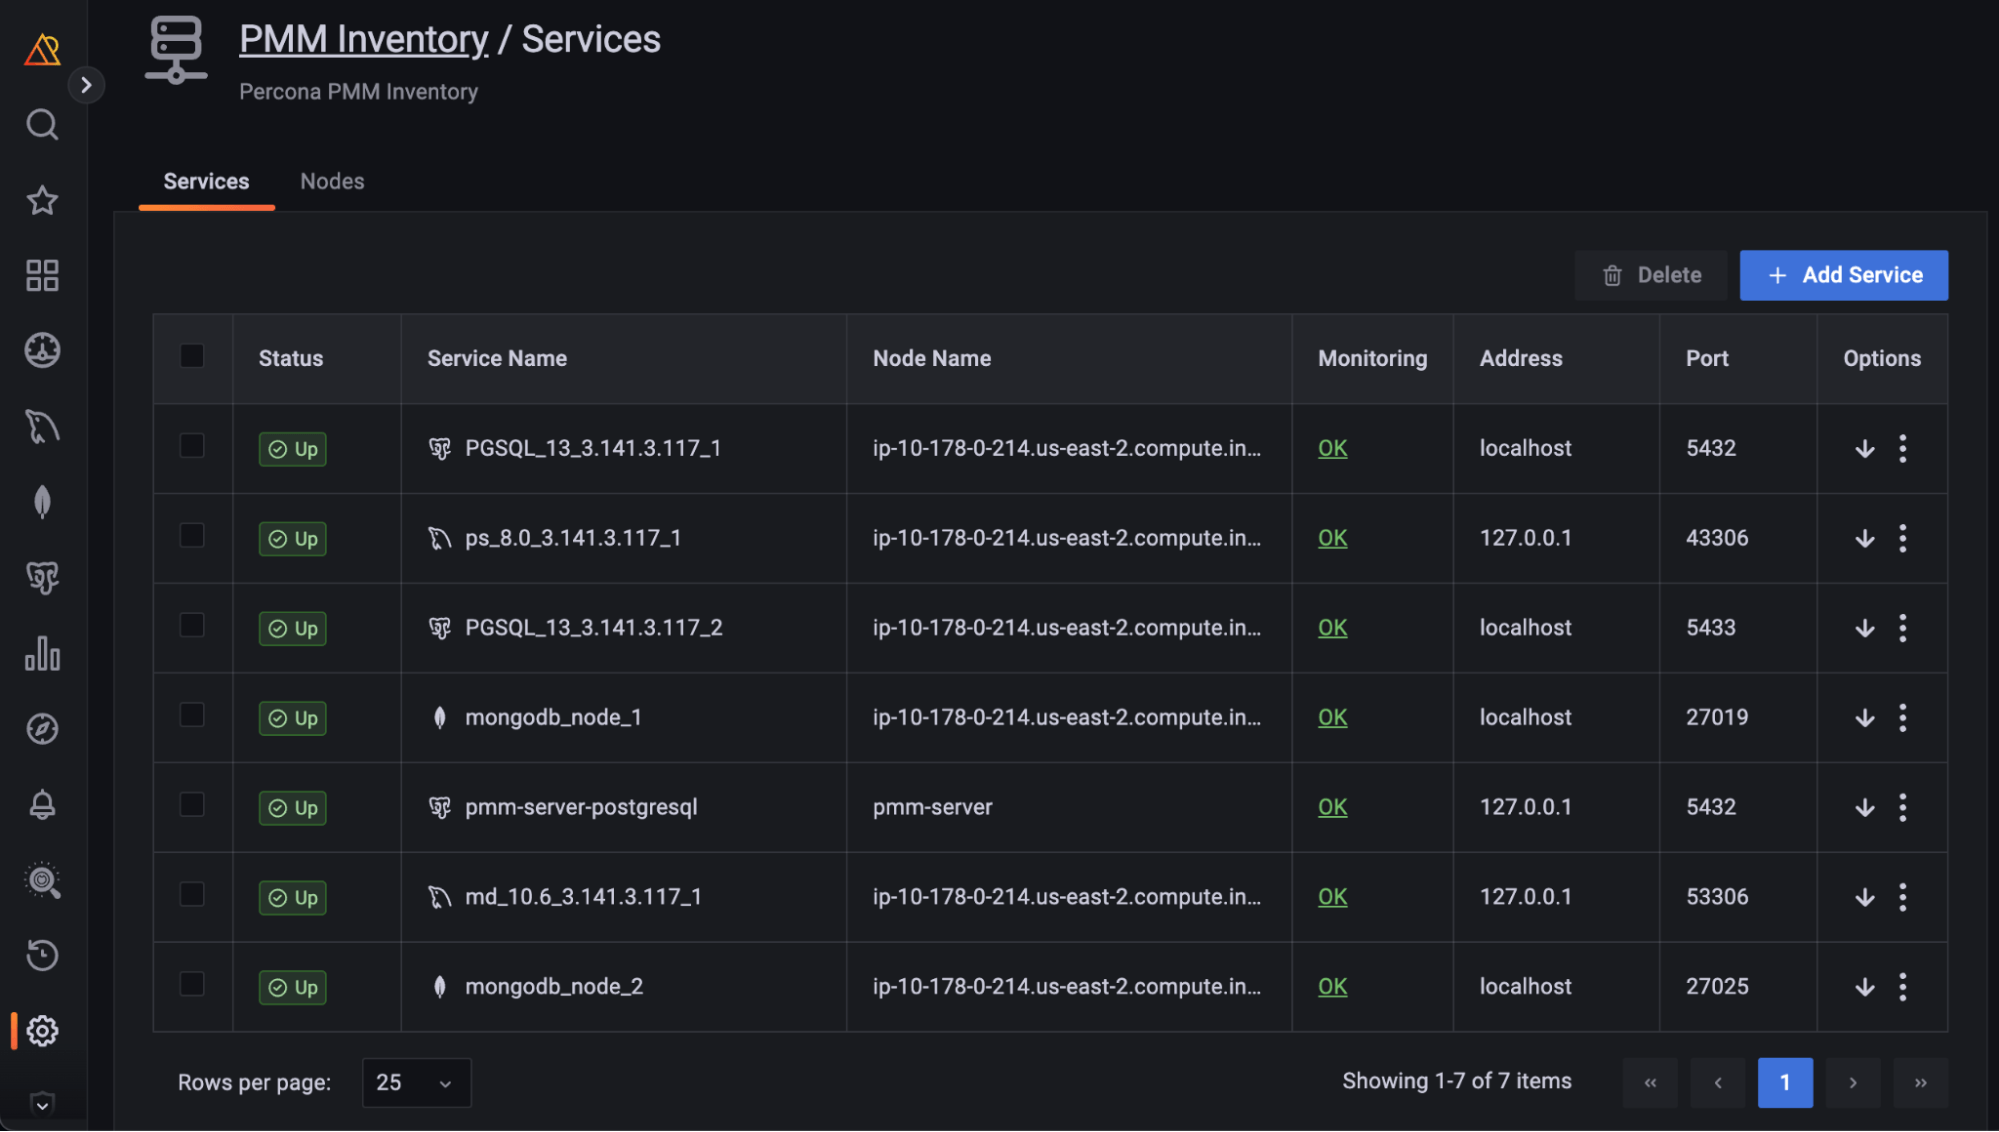
We also solved one of the most frequent questions from users: “On what Node is this service running?”
To answer this question, you would have had to search by ID in a few places and be familiar with PMM’s internal architecture. Now, we are showing this information in a dedicated Node Name column on this page.
At the heart of our redesign thinking process laid one important question: “How can our users assess the health of their database by just looking at their list of Services?“
To answer this, we’ve added some monitoring capabilities into the mix. The new Status column on the Inventory page shows the status of your databases based on metrics coming directly from them.
We’ve also tackled a trust question: How can you make sure that the Service status we’re exposing is accurate?
This is why we’ve added the Monitoring column. This summarizes the status of all the Agents related to a Service and also offers quick access to the list of Agents.
To simplify access to related sections under Monitoring, we’ve also added links to the Service Overview Dashboard and Query Analytics. You will find them in the Action section.
We’ve also moved all secondary information, like parameters and labels, to an expandable section available for each Service and Node.
We will continue to improve the presentation of PMM’s Inventory view with Node-monitoring status and Node Agents lists. We also plan to add more connection points from the Inventory to other important PMM features like Advisors, Alerting, and backups.
In addition, the new Inventory view will be even more helpful with the upcoming structure based on database clusters.
Stay tuned!
|
1 |
These experimental dashboards are subject to change. It is recommended to use these dashboards for testing purposes only. |
We are pleased to announce the release of PMM V2.37, which introduces three new experimental dashboards:
These dashboards are designed to provide valuable insights into the status and performance of your Kubernetes cluster, pods, and volumes, helping you to identify and troubleshoot issues quickly and easily.
We welcome your feedback as we continue to enhance PMM with these new dashboards. Please leave your comments/feedback on Percona Forum.
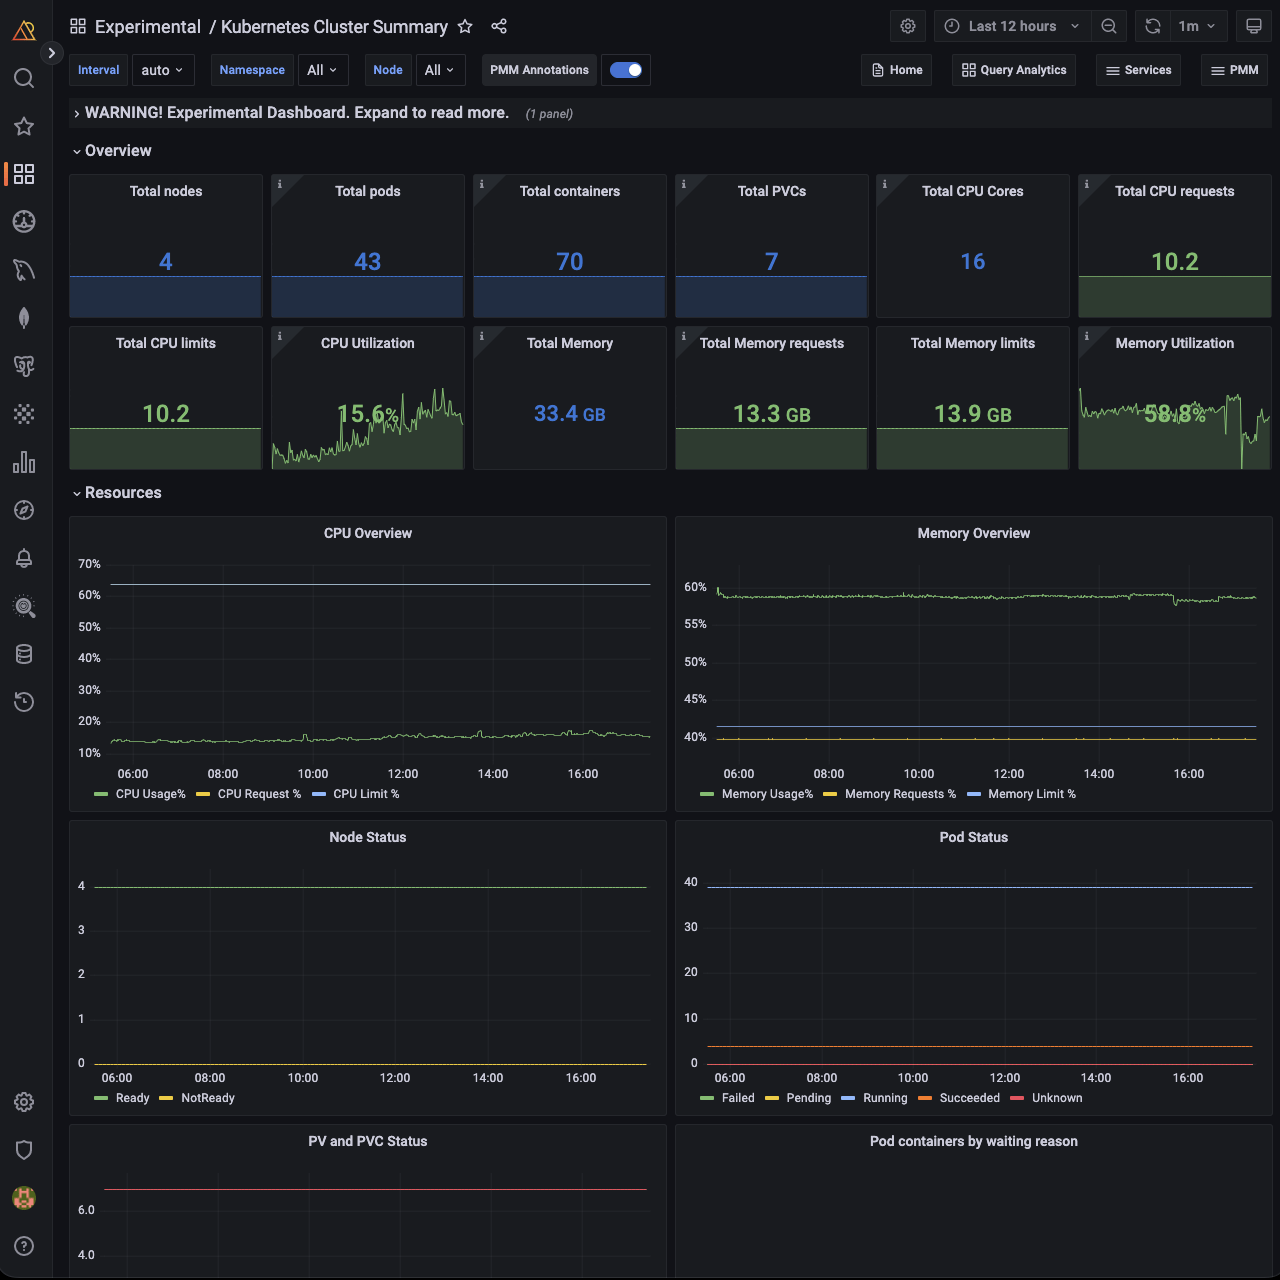
Kubernetes Cluster Summary provides a comprehensive overview of your Kubernetes cluster, including:
This dashboard displays all workloads running in the cluster, enabling you to take action and optimize its performance.
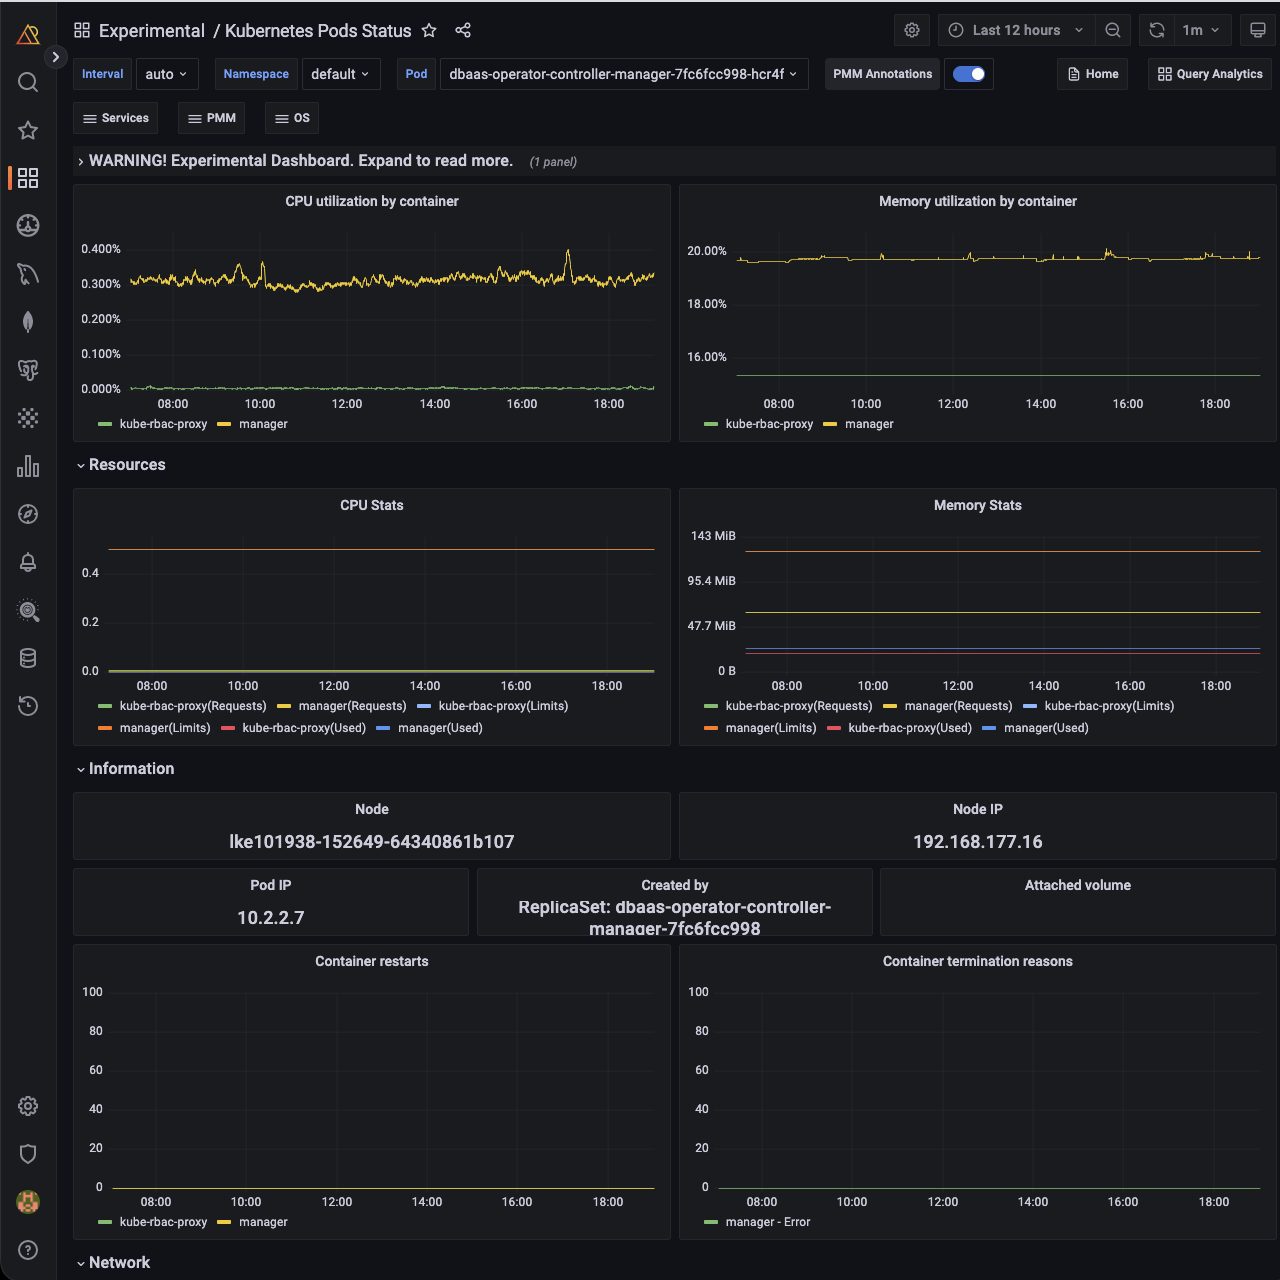
Kubernetes Pods Status dashboard provides detailed information about the state and performance of your pods, including CPU, Memory, and Network metrics.
This dashboard can help you quickly pinpoint any issues affecting your pods and ensure they continue to operate smoothly.
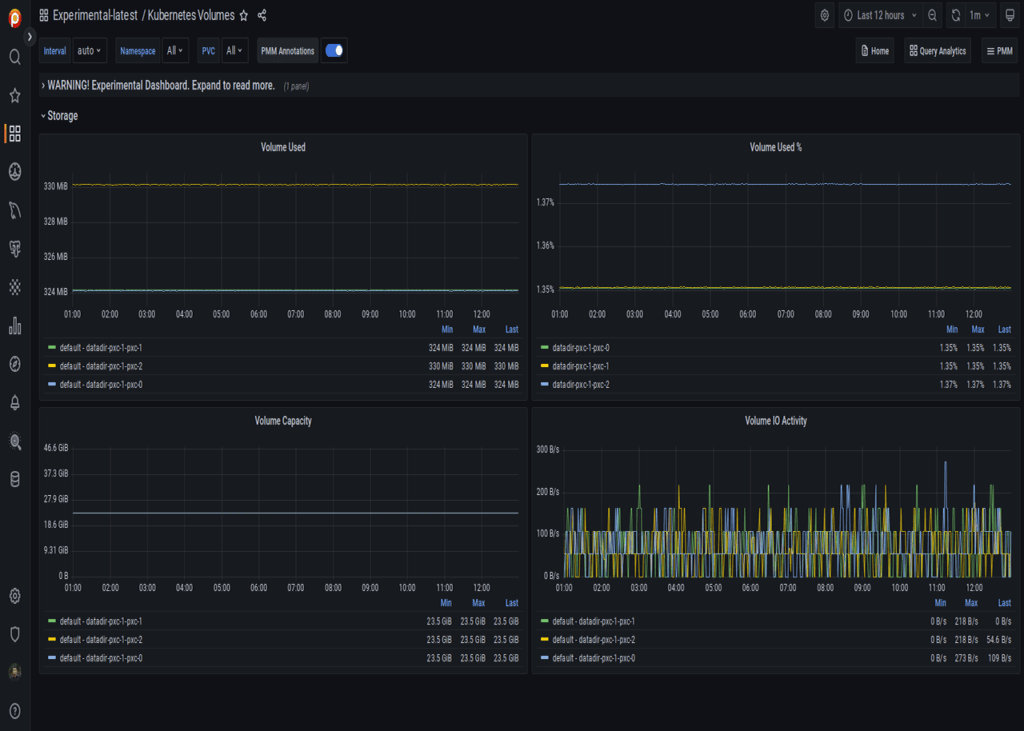
The Kubernetes Volumes dashboard provides insights into your Kubernetes volumes, including capacity and usage, in real time. With this dashboard, you can easily monitor the performance and usage of your volumes and take proactive measures to ensure their performance.
To learn more about these new experimental dashboards and how to use them, refer to the documentation.
Here are the steps to create a new folder and move all experimental dashboards to the new folder for quick access and internal use:
Note
You should have at least an Editor role to create a new folder and move all experimental dashboards.
What is next?
Experimental dashboards will be enhanced through UX improvements and the introduction of new metrics.
At Percona, we are grateful for our supportive community and dedicated team, who work together to shape the future of PMM. If you would like to be a part of this community, you can join us on our forums to request new features, share your feedback, and ask for support. We value the input of our community and welcome all members to participate in the ongoing development of PMM.
Resources
RELATED POSTS