
 Percona Monitoring and Management (PMM) is a free and open-source platform for managing and monitoring MySQL, MongoDB, and PostgreSQL databases, along with Load Balancing tools like ProxySQL. It is also ‘cloud ready’, meaning it has support for monitoring DBaaS (Amazon RDS, Aurora, and more). You can run PMM in your own environment for maximum security and reliability. The biggest strength of PMM is that it is highly customizable, which we will see later in this blog.
The PMM 2 release introduces a number of enhancements and additional features. Here are some improvements and features which I think are cool!
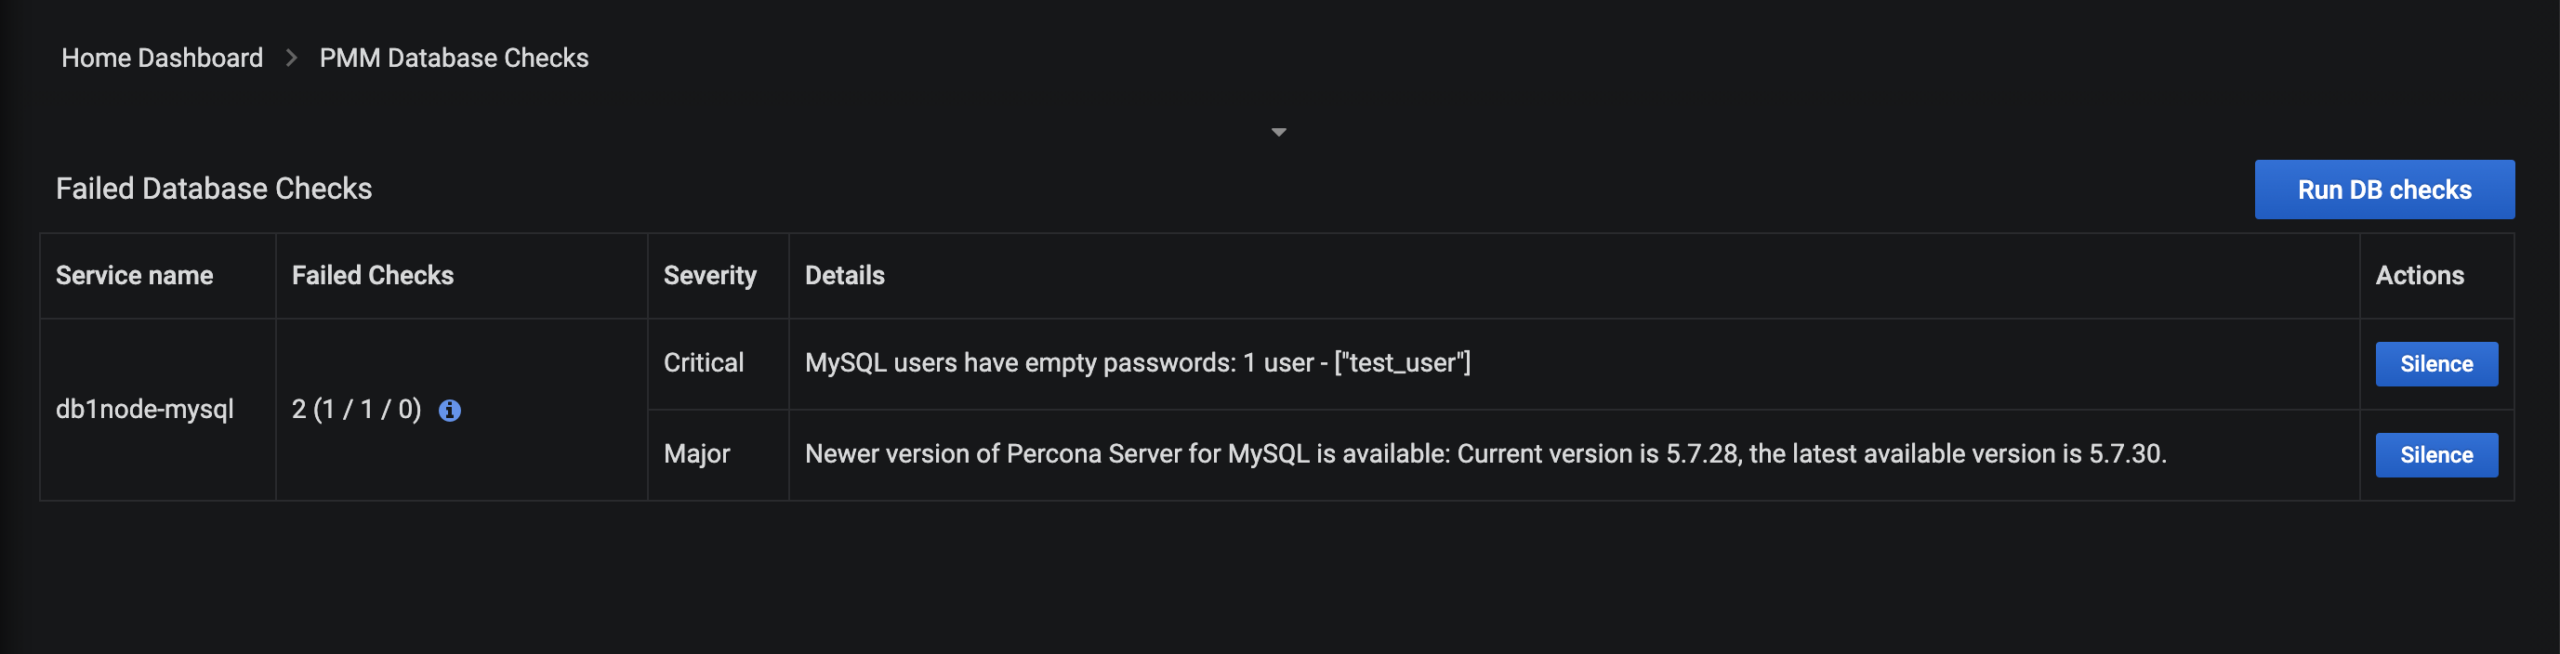
The new Security Threat tool has the goal to advise PMM users on security-related database problems they might have on their databases.
Failed security checks panel on PMM Homepage and click on Security Threat tool, enable it, and ‘Apply changes’.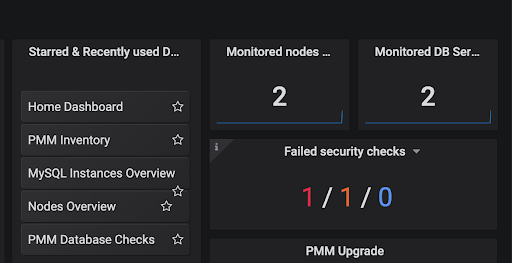
Labeling helps to easily group instances and review these groups together. You do this by tagging the servers with Standard or Custom labels.
--environment='',--cluster='', replication_set='' and so on.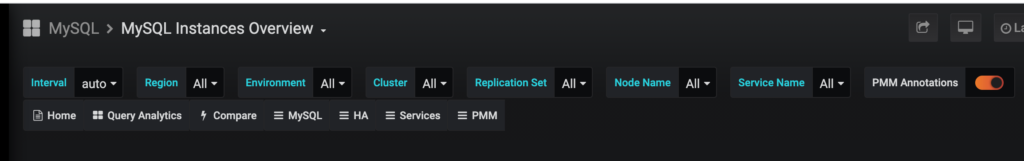
Annotations. Some events in the application like upgrades, patches, may impact the database. Annotations visualize these events on each dashboard of the PMM Server so that you can correlate any performance changes on the database with these events.pmm-admin annotate <--tags> command on PMM Client, and passing it text which explains what event the annotation should represent. Below is an example where we can see an event, ‘Upgrade to v1.2’ represented as a vertical dotted line on the graph.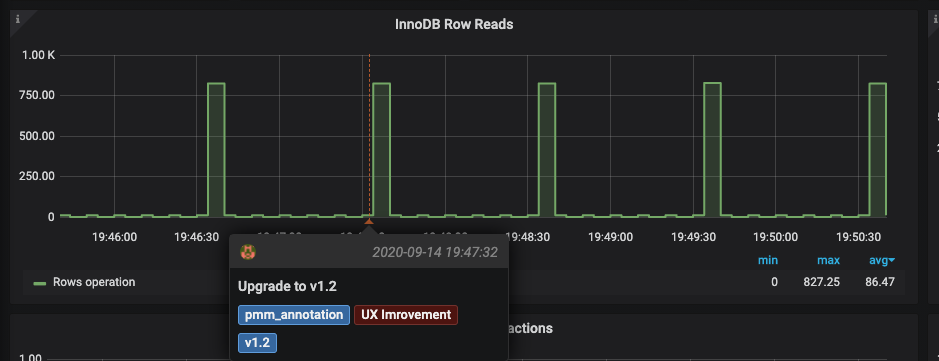
QAN helps to ensure database queries are executed as expected, in the shortest time possible. You can identify queries causing problems and review detailed metrics related to those queries here.
Add column button, which will also show you the list of columns available. These are tagged with Service names – MySQL, MongoDB, PostgreSQL. Columns can be sorted in ascending or descending order.
Search by bar beside the dimensions as seen in the above image. It gives you the flexibility to limit the view of queries containing only the specified keywords entered in the search bar. The Search by can be used for other dimensions as well, like database, username.
The new Filter Panel for the QAN dashboard allows you to see all your labels and gives the capability to select multiple items for filtering.
The PMM Inventory dashboard lists all Nodes, Agents, and Services that are registered against the PMM Server.
PMM Inventory under the PMM tab in the top right corner.db2node-mysql service monitoring. So, I just checked the relevant box and clicked Delete in the right corner and got the confirmation message, clicked on Force mode, and done!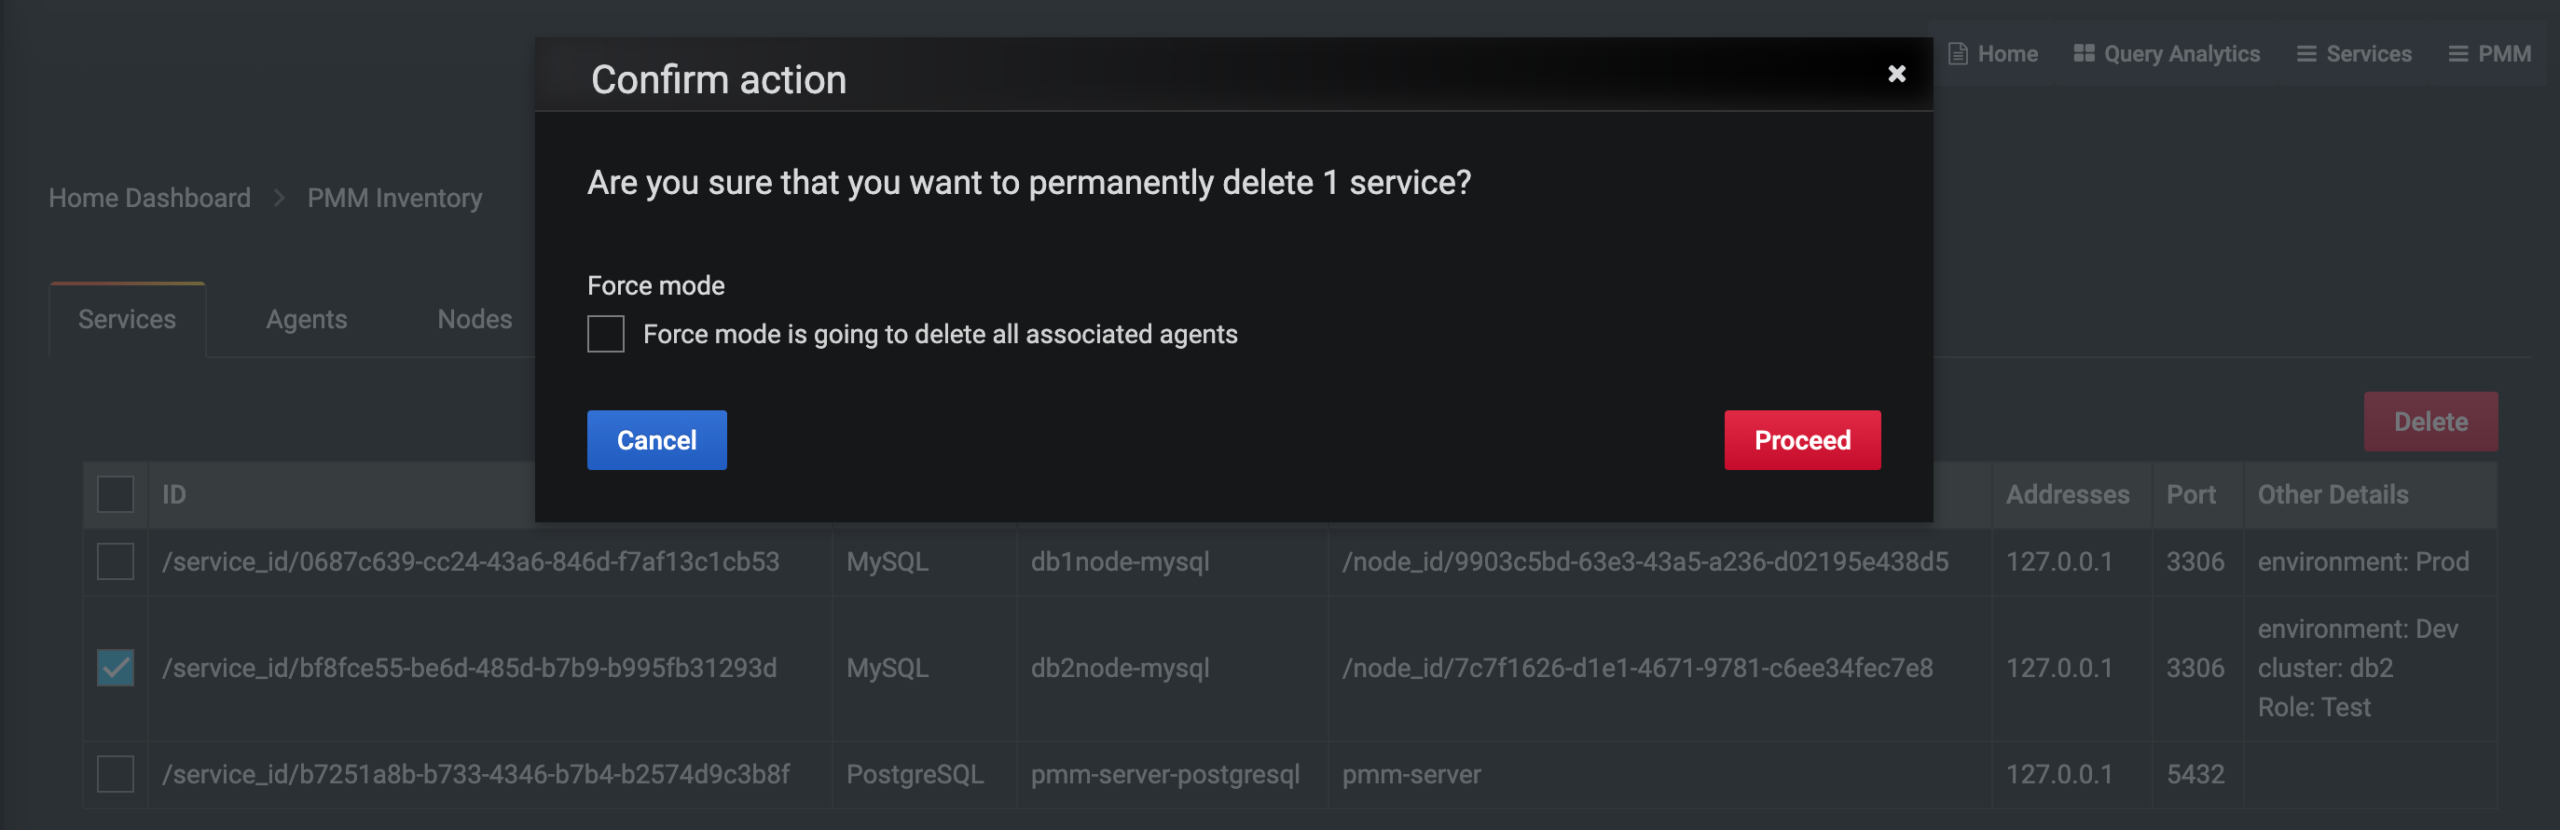
pmm-admin list. The mysqld_exporter process would no longer be running.Along with this, you can also customize your PMM and extend the list of available metrics. Check out below Percona blogs by Daniel Guzmán Burgos, Carlos Salguero, and Vadim Yalovets on these cool customizations!
Extend Metrics for PMM with textfile collectors
PMM’s Custom Queries in Action
Running Custom MySQL Queries in PMM2
Grafana Plugins and PMM
PMM is a best-of-breed open source database monitoring and management solution which helps you focus on optimizing database performance with better observability in a secure way.
For PMM install instructions, see Installing PMM Server and Installing PMM client.
For a full list of new features and bug fixes included in PMMv2, see our release notes and for more information on Percona Monitoring and Management, visit our PMM webpage.
Resources
RELATED POSTS