
In this blog post, I’ll look at MyRocks performance through some benchmark testing.
As the MyRocks storage engine (based on the RocksDB key-value store http://rocksdb.org ) is now available as part of Percona Server for MySQL 5.7, I wanted to take a look at how it performs on a relatively high-end server and SSD storage. I wanted to check how it performs for different amounts of available memory for the given database size. This is similar to the benchmark I published a while ago for InnoDB.
In this case, I plan to use a sysbench-tpcc benchmark and I will execute it for both MyRocks and InnoDB. We’ll use InnoDB as a baseline.
For the benchmark, I will use 100 TPC-C warehouses, with a set of 10 tables (to shift the bottleneck from row contention). This should give roughly 90GB of data size (when loaded into InnoDB) and is roughly equivalent to 1000 warehouses data size.
To vary the memory size, I will change innodb_buffer_pool_size from 5GB to 100GB for InnoDB, and rocksdb_block_cache_size for MyRocks.
For MyRocks we will use LZ4 as the default compression on disk. The data size in the MyRocks storage engine is 21GB. Interesting to note, that in MyRocks uncompressed size is 70GB on the storage.
For both engines, I did not use FOREIGN KEYS, as MyRocks does not support it at the moment.
MyRocks does not support SELECT .. FOR UPDATE statements in REPEATABLE-READ mode in the Percona Server for MySQL implementation. However, “SELECT .. FOR UPDATE” is used in this benchmark. So I had to use READ-COMMITTED mode, which is supported.
The most important setting I used was to enable binary logs, for the following reasons:
I used the following settings for binary logs:
While I am not a full expert in MyRocks tuning yet, I used recommendations from this page: https://github.com/facebook/mysql-5.6/wiki/my.cnf-tuning. The Facebook-MyRocks engineering team also provided me input on the best settings for MyRocks.
Let’s review the results for different memory sizes.
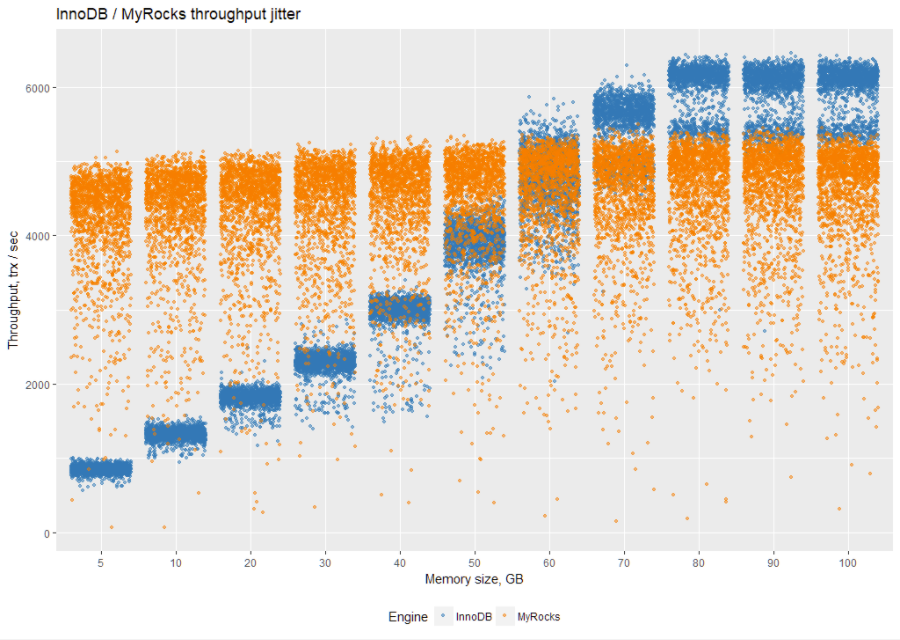
This first chart shows throughput jitter. This helps to understand the distribution of throughput results. Throughput is measured every 1 second, and on the chart, I show all measurements after 2000 seconds of a run (the total length of each run is 3600 seconds). So I show the last 1600 seconds of each run (to remove warm-up phases):
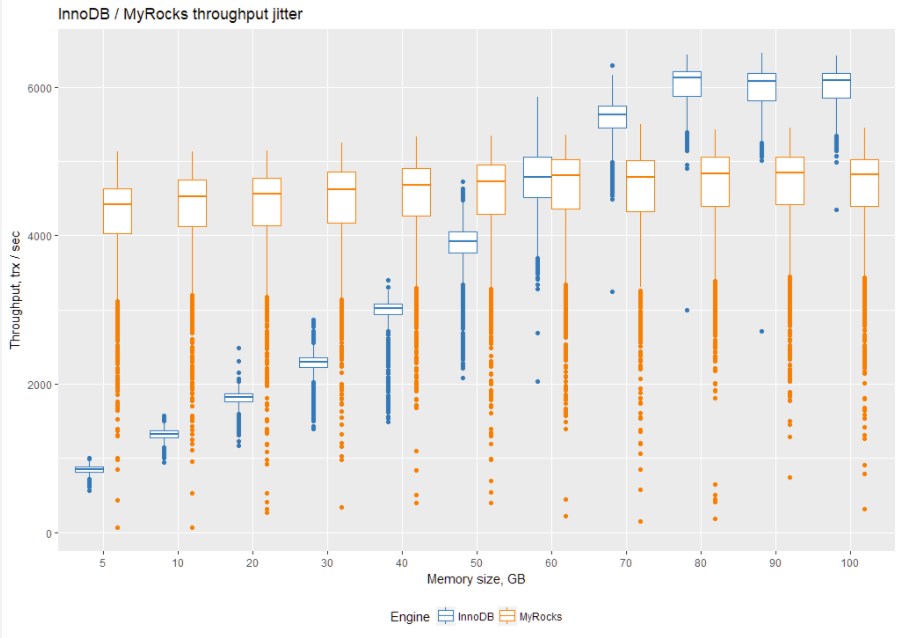
To better quantify results, let’s take a look at them on a boxplot. The quickest way to understand boxplots is to take a look at the middle line. It represents a median of measurements (see more here):
Before we jump to the summary of results, let’s take a look at a variation of the throughput for both InnoDB and MyRocks. We will zoom to a 1-second resolution chart for 100 GB of allocated memory:
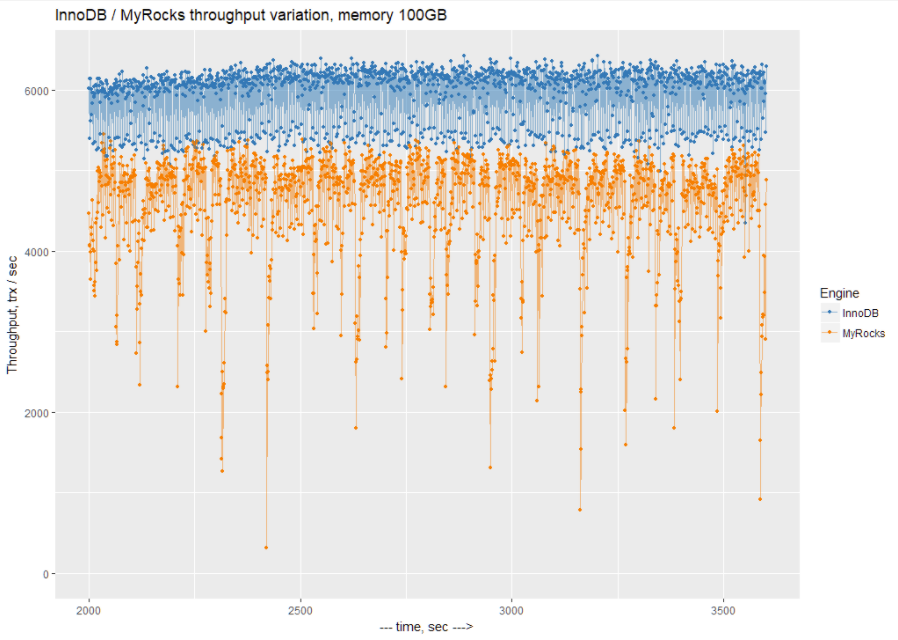
We can see that there is a lot of variation with periodical 1-second performance drops with MyRocks. At this moment, I do not know what causes these drops.
So let’s take a look at the average throughput for each engine for different memory settings (the results are in tps, and more is better):
| Memory, GB | InnoDB | MyRocks |
| 5 | 849.0664 | 4205.714 |
| 10 | 1321.9 | 4298.217 |
| 20 | 1808.236 | 4333.424 |
| 30 | 2275.403 | 4394.413 |
| 40 | 2968.101 | 4459.578 |
| 50 | 3867.625 | 4503.215 |
| 60 | 4756.551 | 4571.163 |
| 70 | 5527.853 | 4576.867 |
| 80 | 5984.642 | 4616.538 |
| 90 | 5949.249 | 4620.87 |
| 100 | 5961.2 | 4599.143 |
This is where MyRocks behaves differently from InnoDB. InnoDB benefits greatly from additional memory, up to the size of working dataset. After that, there is no reason to add more memory.
At the same time, interestingly MyRocks does not benefit much from additional memory.
Basically, MyRocks performs as expected for a write-optimized engine. You can refer to my article How Three Fundamental Data Structures Impact Storage and Retrieval for more details.
In conclusion, InnoDB performs better (compared to itself) when the working dataset fits (or almost fits) into available memory, while MyRocks can operate (and outperform InnoDB) on small memory sizes.
It is worth looking at resource utilization for each engine. I took vmstat measurements for each run so that we can analyze IO and CPU usage.
First, let’s review writes per second (in KB/sec). Please keep in mind that these writes include binary log writes too, not just writes from the storage engine.
| Memory, GB | InnoDB | MyRocks |
| 5 | 244754.4 | 87401.54 |
| 10 | 290602.5 | 89874.55 |
| 20 | 311726 | 93387.05 |
| 30 | 313851.7 | 93429.92 |
| 40 | 316890.6 | 94044.94 |
| 50 | 318404.5 | 96602.42 |
| 60 | 276341.5 | 94898.08 |
| 70 | 217726.9 | 97015.82 |
| 80 | 184805.3 | 96231.51 |
| 90 | 187185.1 | 96193.6 |
| 100 | 184867.5 | 97998.26 |
We can also calculate how many writes per transaction each storage engine performs:
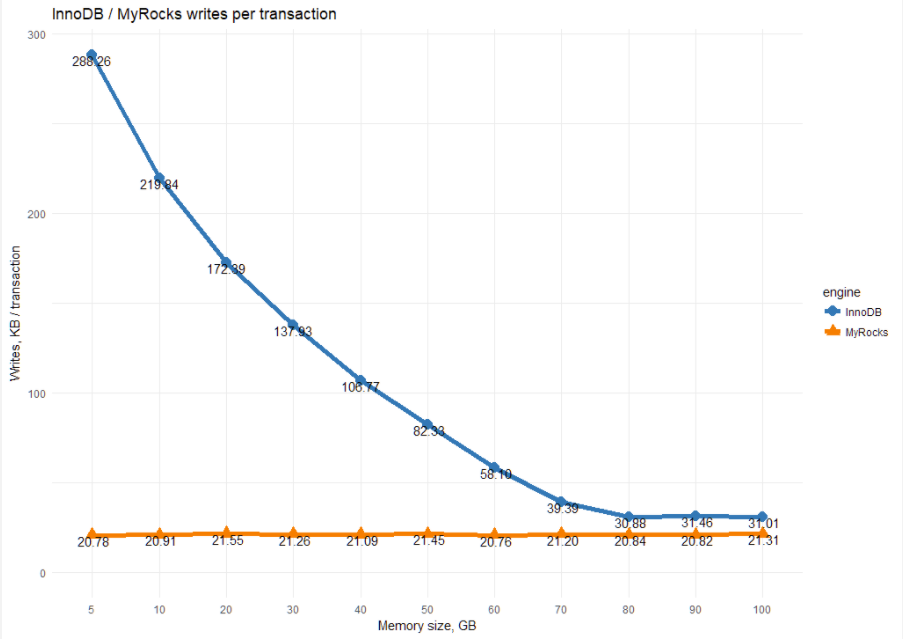
This chart shows the essential difference between InnoDB and MyRocks. MyRocks, being a write-optimized engine, uses a constant amount of writes per transaction.
For InnoDB, the amount of writes greatly depends on the memory size. The less memory we have, the more writes it has to perform.
The following table shows reads in KB per second.
| Memory, GB | InnoDB | MyRocks |
| 5 | 218343.1 | 171957.77 |
| 10 | 171634.7 | 146229.82 |
| 20 | 148395.3 | 125007.81 |
| 30 | 146829.1 | 110106.87 |
| 40 | 144707 | 97887.6 |
| 50 | 132858.1 | 87035.38 |
| 60 | 98371.2 | 77562.45 |
| 70 | 42532.15 | 71830.09 |
| 80 | 3479.852 | 66702.02 |
| 90 | 3811.371 | 64240.41 |
| 100 | 1998.137 | 62894.54 |
We can translate this to the number of reads per transaction:
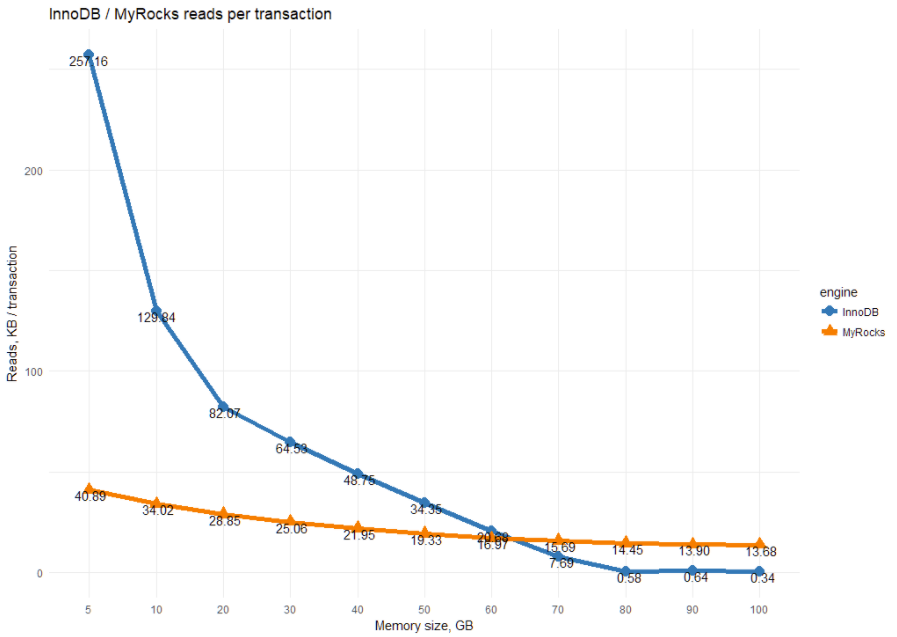
This shows MyRocks’ read-amplification. The allocation of more memory helps to decrease IO reads, but not as much as for InnoDB.
Let’s also review CPU usage for each storage engine. Let’s start with InnoDB:
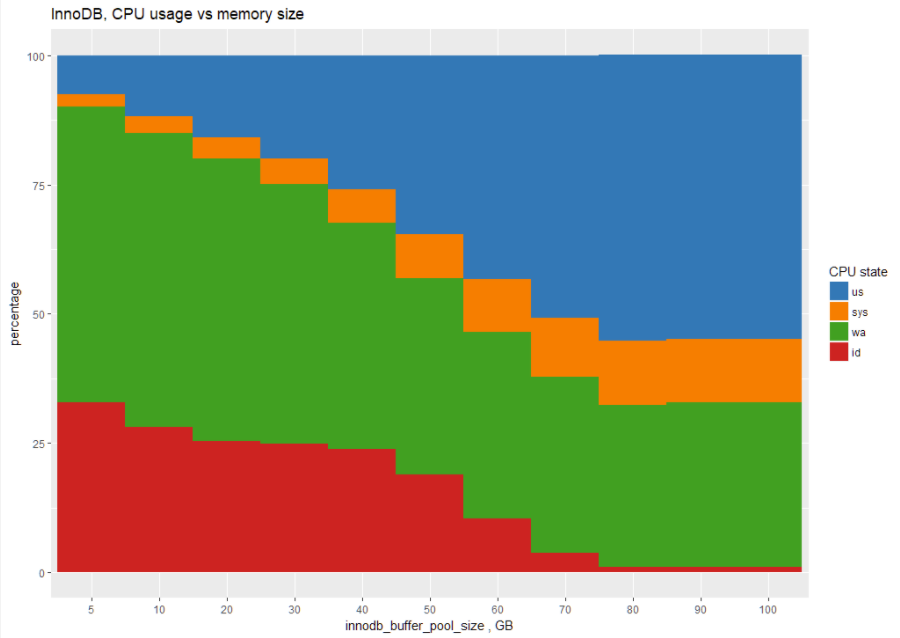
The chart shows that for 5GB memory size, InnoDB spends most of its time in IO waits (green area), and the CPU usage (blue area) increases with more memory.
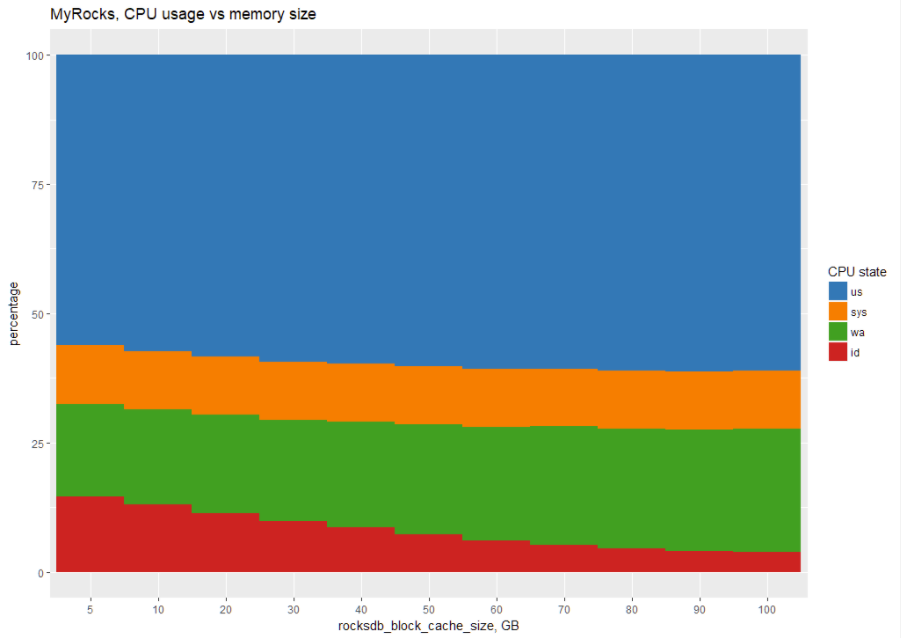
This is the same chart for MyRocks:
In tabular form:
| Memory, GB | engine | us | sys | wa | id |
| 5 | InnoDB | 8 | 2 | 57 | 33 |
| 5 | MyRocks | 56 | 11 | 18 | 15 |
| 10 | InnoDB | 12 | 3 | 57 | 28 |
| 10 | MyRocks | 57 | 11 | 18 | 13 |
| 20 | InnoDB | 16 | 4 | 55 | 25 |
| 20 | MyRocks | 58 | 11 | 19 | 11 |
| 30 | InnoDB | 20 | 5 | 50 | 25 |
| 30 | MyRocks | 59 | 11 | 19 | 10 |
| 40 | InnoDB | 26 | 7 | 44 | 24 |
| 40 | MyRocks | 60 | 11 | 20 | 9 |
| 50 | InnoDB | 35 | 8 | 38 | 19 |
| 50 | MyRocks | 60 | 11 | 21 | 7 |
| 60 | InnoDB | 43 | 10 | 36 | 10 |
| 60 | MyRocks | 61 | 11 | 22 | 6 |
| 70 | InnoDB | 51 | 12 | 34 | 4 |
| 70 | MyRocks | 61 | 11 | 23 | 5 |
| 80 | InnoDB | 55 | 12 | 31 | 1 |
| 80 | MyRocks | 61 | 11 | 23 | 5 |
| 90 | InnoDB | 55 | 12 | 32 | 1 |
| 90 | MyRocks | 61 | 11 | 23 | 4 |
| 100 | InnoDB | 55 | 12 | 32 | 1 |
| 100 | MyRocks | 61 | 11 | 24 | 4 |
We can see that MyRocks uses a lot of CPU (in us+sys state) no matter how much memory is allocated. This leads to the conclusion that MyRocks performance is limited more by CPU performance than by available memory.
As MyRocks writes all changes and compacts SST files down the road, it would be interesting to see how the data directory size changes during the benchmark so we can estimate our storage needs. Here is a chart of datadirectory size:
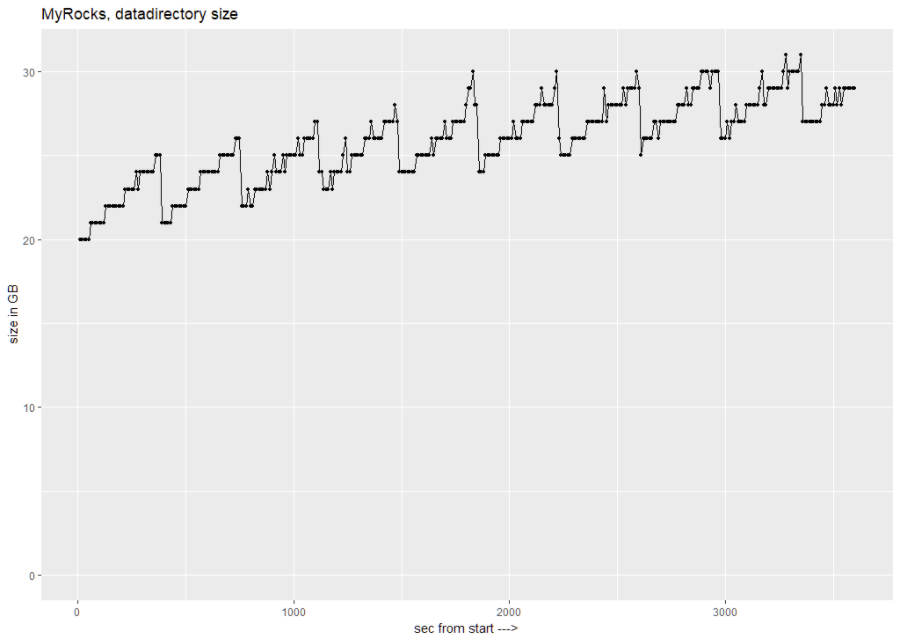
We can see that datadirectory goes from 20GB at the start, to 31GB during the benchmark. It is interesting to observe the data growing until compaction shrinks it.
In conclusion, I can say that MyRocks performance increases as the ratio of dataset size to memory increases, outperforming InnoDB by almost five times in the case of 5GB memory allocation. Throughput variation is something to be concerned about, but I hope this gets improved in the future.
MyRocks does not require a lot of memory and shows constant write IO while using most of the CPU resources.
I think this potentially makes MyRocks a great choice for cloud database instances, where both memory and IO can cost a lot. MyRocks deployments would make it cheaper to deploy in the cloud.
I will follow up with further cloud-oriented benchmarks.
My goal is to provide fully repeatable benchmarks. To this end, I’m sharing all the scripts and settings I used in the following GitHub repo:
https://github.com/Percona-Lab-results/201803-sysbench-tpcc-myrocks
|
1 2 3 4 5 6 7 8 9 10 11 12 13 14 15 16 17 18 19 20 21 |
rocksdb_max_open_files=-1 rocksdb_max_background_jobs=8 rocksdb_max_total_wal_size=4G rocksdb_block_size=16384 rocksdb_table_cache_numshardbits=6 # rate limiter rocksdb_bytes_per_sync=16777216 rocksdb_wal_bytes_per_sync=4194304 rocksdb_compaction_sequential_deletes_count_sd=1 rocksdb_compaction_sequential_deletes=199999 rocksdb_compaction_sequential_deletes_window=200000 rocksdb_default_cf_options="write_buffer_size=256m;target_file_size_base=32m;max_bytes_for_level_base=512m;max_write_buffer_number=4;level0_file_num_compaction_trigger=4;level0_slowdown_writes_trigger=20;level0_stop_writes_trigger=30;max_write_buffer_number=4;block_based_table_factory={cache_index_and_filter_blocks=1;filter_policy=bloomfilter:10:false;whole_key_filtering=0};level_compaction_dynamic_level_bytes=true;optimize_filters_for_hits=true;memtable_prefix_bloom_size_ratio=0.05;prefix_extractor=capped:12;compaction_pri=kMinOverlappingRatio;compression=kLZ4Compression;bottommost_compression=kLZ4Compression;compression_opts=-14:4:0" rocksdb_max_subcompactions=4 rocksdb_compaction_readahead_size=16m rocksdb_use_direct_reads=ON rocksdb_use_direct_io_for_flush_and_compaction=ON |
|
1 2 3 4 5 6 7 8 9 10 11 12 13 14 15 16 17 18 19 20 21 22 23 24 25 26 27 28 29 30 31 32 33 34 35 36 |
# files innodb_file_per_table innodb_log_file_size=15G innodb_log_files_in_group=2 innodb_open_files=4000 # buffers innodb_buffer_pool_size= 200G innodb_buffer_pool_instances=8 innodb_log_buffer_size=64M # tune innodb_doublewrite= 1 innodb_support_xa=0 innodb_thread_concurrency=0 innodb_flush_log_at_trx_commit= 1 innodb_flush_method=O_DIRECT_NO_FSYNC innodb_max_dirty_pages_pct=90 innodb_max_dirty_pages_pct_lwm=10 innodb_lru_scan_depth=1024 innodb_page_cleaners=4 join_buffer_size=256K sort_buffer_size=256K innodb_use_native_aio=1 innodb_stats_persistent = 1 #innodb_spin_wait_delay=96 # perf special innodb_adaptive_flushing = 1 innodb_flush_neighbors = 0 innodb_read_io_threads = 4 innodb_write_io_threads = 2 innodb_io_capacity=2000 innodb_io_capacity_max=4000 innodb_purge_threads=4 innodb_adaptive_hash_index=1 |
Supermicro server:
For a detailed look at how MyRocks stacks up against typical InnoDB deployments, read my blog MyRocks Engine: Things to Know Before You Start. We go over the differences, major and minor, in the storage engine and discuss its implementation with Percona Server. MyRocks could also be beneficial for your cloud deployment. Saving With MyRocks in The Cloud shows how the storage engine performed under heavy I-O workloads in the cloud and what that means for your storage costs.
Resources
RELATED POSTS


Your innodb_buffer_pool_size is twice the maximum amount of memory (100G) you used for your benchmark. Wouldn’t double the amount of ram for the buffer pool cause MySQL to go into swap?
Was that number static throughout the tests or did you tweak it based on the amount of memory available?
Brian,
I set innodb_buffer_pool_size in the script running benchmark,
you can find it here for example
https://github.com/Percona-Lab-results/201803-sysbench-tpcc-myrocks/blob/master/res-tpcc-inno-sync10000-minimal-2018-03-10-23-12/mysql57.BP100/thr56/run_tpcc_inno.sh#L15
Hi Vadim,
Your 2010 benchmark on RAM vs. fast SSD is my favourite benchmark ever 🙂 . Thank you for running it again in 2018 with variance included.
I would be curious to see 8.0 results for InnoDB… there were some redo log enhancements that made it in shortly before GA.
hi Vadim,
looks good. I was wondering which charting app you used to make your charts with?
thanks
lawrence
Lawrence,
Traditionally I use R with ggplot2.
You can find more about possible visualizations with this software here: https://www.percona.com/blog/2012/02/23/some-fun-with-r-visualization/
Thanks for the clarification
Great article. The throughput heatmap is very interesting and a good way to visualize the higher variance of rocksDB.
One hidden danger with LSM (rocksDB) is that you may not be catching all the more extreme edgecases of compactions with a test that only lasts for 1 hr.
As the data set on disk grows larger and data gets compacted to lower and lower levels, there can definitely be cases when a larger compaction can run after 6, 12 or even 24 hours of running the system, and it can introduce bigger variance in throughput, while those background compactions are running. In some cases the throughput drops can even last for many minutes, which can definitely cause some unexpected issues for a database that is serving live low latency traffic.
With fast storage 1 hour is probably long enough to see steady state behavior.
RocksDB supports leveled and tiered compaction but the default is leveled. While there might be long running compaction with tiered, that doesn’t happen with level as each compaction step consumes ~11 SST files which should be a few hundred MB of data.
Thanks for great benchmark. Is myrocks supported in percona cluster ?
Arda,
MyRocks in not supported in Percona XtraDB Cluster, and we have no current plans to support it.
Vadim, I would also suggest running the test which uses buffered-IO with MyRocks. Read-ahead in RocksDB is currently not supported when directIO is used and depending on the query plan that may be a big deal for some of the queries.
Ovais,
That correct and it might be beneficial for some workloads. In this particular test I tried buffered-IO and I saw better results with O_DIRECT than with buffered-IO .
Zviad,
This is where tuning may help. With the most default settings I saw stalls even during 1 hour runs.
With changes to settings (you can see the config in the post) I was able to mitigate compaction stalls
Morgan,
The results for 8.0 are indeed coming.
Could you compare with TokuDB ? I think it is the main contender to MyRocks
Thank you very much for the interesting comparison. I have a question regarding performance with low page buffer (Inno) and block cache size(MyRocks). For InnoDB, buffer pool is the main consumer of memory storing both data and indexes. However for RocksDB, additional memory is allocated for bloom filters and for index blocks.
How large was this memory area in your experiments?
We are using percona mysql-5.7 and have tables that are both RocksDB and InnoDB and during replication we are facing crashes for both RocksDB tables and InnoDB. Does Percona MySQL 5.7 support replication for both storage engines
Some limitations of Using MyRocks:
Transportable Tablespace, Foreign Key, Spatial Index, and Fulltext Index are not supported
Let’s look at some of the limitations of using the MyRocks engine…
MariaDB’s optimistic parallel replication may not be supported
MyRocks is not available for 32-bit platforms
MariaDB Cluster (Galera Cluster) doesn’t work with MyRocks (Only InnoDB or XtraDB storage engines)
The transaction must fit in memory
Requires special settings for loading data
SERIALIZABLE is not supported
Transportable Tablespace, Foreign Key, Spatial Index, and Fulltext Index are not supported
As people have mentioned before, RocksDB uses memory for several things: memtables, block cache, sstable indexes/bloom filters. RocksDB can easily write at the top speed supported by SSD because it is write optimized.
Don’t meant to be negative about your blog post, but I felt the need to comment because I think you did your first benchmark wrong.
“rocksdb_block_cache_size” controls the size of how much memory RocksDB is using to cache data on the read path. In particular, block cache stores uncompressed data/index/bloom filter blocks being read from sst files. Here you increased block cache size and discovered that it didn’t affect write performance because block cache is only used for read path.
The correct memory-related parameter to tune which would affect write performance is “rocksdb-db-write-buffer-size” which controls the size of memtables, i.e., how much data to accumulate in memory before writing to disk.