

 Taking our cue from Peter Zaitsev’s article on MySQL performance bottlenecks, I am going to talk about the PostgreSQL perspective of removing bottlenecks caused by high traffic.
Many stacks today are implemented by trusting the Object Relational Mapper, or ORM, to do the right thing with PostgreSQL while the critical business logic is created on the application server side. For the most part, this works well. Over time, however, the database server must be revisited as it scales. As reliable as PostgreSQL is, it can experience slowdowns as traffic increases.
There are many ways to address performance bottlenecks. For this discussion, we will look at the following areas:
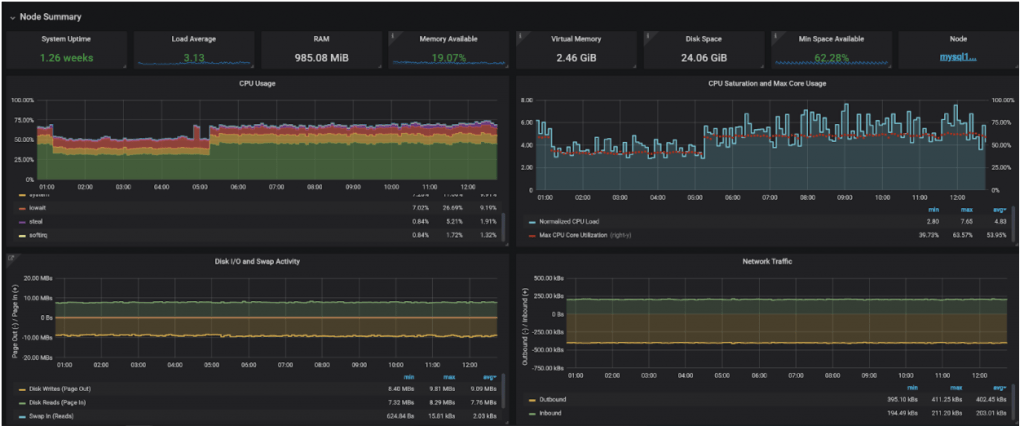
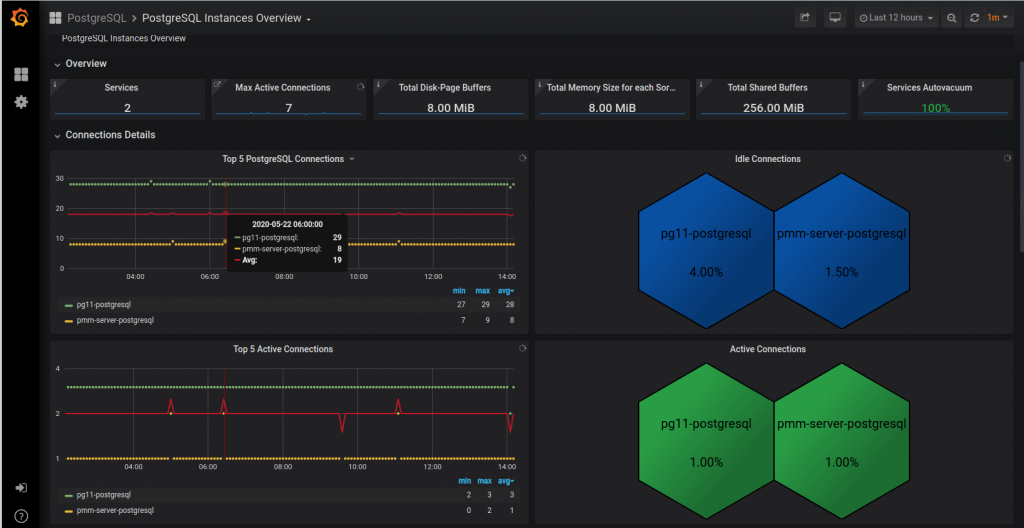
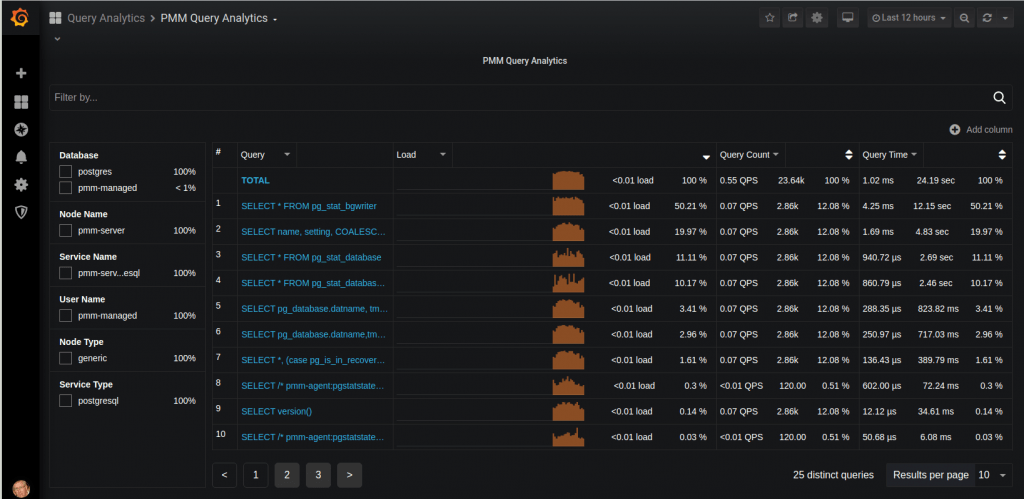
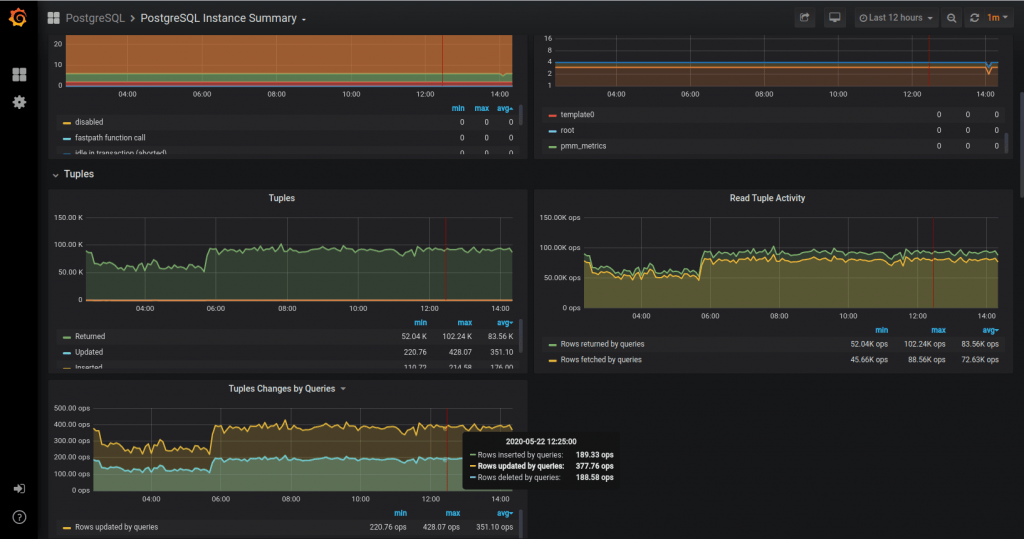
Before we get too deep into the weeds, a word about monitoring. Contrary to what some people may think, metrics, values, and observations are not pulled out of thin air. A rigorous approach to metrics monitoring is essential for identifying bottlenecks and their remedies. Good advice means little without context. To help with this process, we have introduced a new tool called pg_stat_monitor.
Think of it as pg_stat_statements on steroids. It offers more granularity and, most significantly, introduces the concept of buckets, otherwise known as moving averages.
A more detailed blog dedicated exclusively to this technology is forthcoming. In the meantime, here is an abridged set of instructions for installing this extension into your database.
|
1 2 3 4 5 6 7 8 9 |
apt update apt upgrade -y apt install -y wget gnupg2 lsb-release curl wget https://repo.percona.com/apt/percona-release_latest.generic_all.deb dpkg -i percona-release_latest.generic_all.deb percona-release setup ppg-12 apt install -y percona-postgresql-12 percona-pg-stat-monitor12 |
|
1 2 3 4 5 6 7 8 |
# The following assumes the community version of Postgres is already installed. apt install -y postgresql-server-dev-12 git make gcc git clone https://github.com/percona/pg_stat_monitor cd pg_stat_monitor make USE_PGXS=1 make USE_PGXS=1 install |
|
1 2 |
ALTER SYSTEM SET shared_preload_libraries = 'pg_stat_monitor'; CREATE EXTENSION pg_stat_monitor; |
|
1 |
systemctl restart postgresql |
Complexity refers to the level of difficulty involved in implementing a particular solution. Potential impact gives you an idea of the mitigation’s ideal impact on your system’s performance. Sometimes, because of a system’s age, type, technical debt, or other factors, accurately describing complexity and potential impact can be difficult. In highly complex environments, your judgment makes the final call.
Categories:
Complexity: Low
Potential Impact: High
There was a time, not too long ago, when a modern version of Postgres could still run on an i386. Although the default settings have since been updated, the parameters are still set to use the least amount of resources upon installation.
These settings are the easiest to update and are normally adjusted when the service is first installed. Not adjusting these values can result in high CPU and I/O:
Let’s talk about these variables.
The recommended value for effective_cache_size, although typical, can be set more precisely by referring to top, specifically free + cached RAM.
Setting shared_buffers is an interesting puzzle. There are two ways to look at this setting. If you have a small database, you can set shared buffers high enough that you essentially have a RAM-resident database system. Otherwise, you configure the tables and indexes used most often by the service to remain in RAM, following the old 80/20 rule. Setting shared buffers to 1/3 of system RAM used to be the recommended value, but over time it was reduced to 1/4 as machines acquired more RAM. There is such a thing as assigning too much to shared buffers. Too little RAM means more CPU work and higher I/O. You will know the shared buffer setting is too high when CPU load and I/O performance reach a plateau.
Another factor to consider is the OS cache. Given enough RAM, Linux will cache tables and indexes in RAM and can, depending on various settings, make PostgreSQL believe it is reading from disk rather than RAM. Performance improves at the expense of increased redundancy, often by copying the same pages found in shared buffers into the OS cache. This is another reason to avoid an overly large shared buffer cache. For the perfectionists among us, take a look at the pg_buffercache extension, which reads cache usage in real time. Tip: look at this table.
Setting work_mem too low guarantees poor performance because sorts are processed as temporary files on disk. On the other hand, setting it too high risks starving the server of RAM if too many connections are active at one time. A chunk of RAM equal to work_mem is used for each sort operation. You will need to do some arithmetic by counting the instances of RAM used by each query and session. Tip: use EXPLAIN ANALYZE to see where sort operations are carried out. By varying the value in a given session, you can see when it spills to disk.
You can learn quite a bit by benchmarking the system at discrete variable settings.
Complexity: Low
Potential Impact: Low-Medium-High
High traffic is often characterized by large numbers of connections made over short intervals. Too many connections block processes, delay query responses, and can even cause session errors. Without exception handling, root cause analysis may require digging into the Postgres logs.
An easy fix is increasing the number of connections:
|
1 2 |
# postgresql.conf: default is set to 100. max_connections |
Alternatively, a more sophisticated approach is connection pooling. There are numerous solutions, but the most commonly used technology is PgBouncer. Among its many capabilities, PgBouncer can regulate connection sessions using one of three modes:
Secure Socket Layer, or SSL, is another consideration. When configured to use SSL certificates, PostgreSQL’s default behavior encourages all connecting sessions to use SSL, which consumes more CPU processing power than an unencrypted session. You can configure host-based authentication rules in pg_hba.conf to force ordinary client sessions not to use SSL and reserve SSL for administrative tasks by the superuser or for streaming replication.
Complexity: Medium
Potential Impact: Low-Medium
Multi-Version Concurrency Control is one of the foundational principles that makes PostgreSQL a popular DBMS solution. However, one downside is that every updated or deleted record creates a dead tuple that must eventually be purged. An improperly tuned autovacuum process, which is the mechanism that handles dead tuples, reduces performance. The busier the server, the more significant the effect.
You manage the autovacuum daemon using these three parameters:
pg_stat_activity for wraparound activity.Beware of over-committing RAM and CPU. The higher the initial value, the greater the risk that consumed resources will be exhausted as system load increases. If values are set too high, you can experience a sudden drop in performance once load exceeds a certain point. Tip: similar to RAM allocation for work_mem, you can either perform some arithmetic or benchmark the environment to set the values optimally.
Complexity: High
Potential Impact: High
Because of the effort involved, consider this method when the database system risks pushing the host to its physical limits and excessive bloat has been identified as an issue.
Editing the autovacuum runtime parameters in postgresql.conf is the most common method used to control behavior for a data cluster. Unfortunately, this one-size-fits-all approach may not work well over the long term, especially as a system scales.
Table storage parameters: Often, some tables represent a significant amount of the total data cluster churn. Adjusting autovacuum parameters on a table-by-table basis is an excellent way to mitigate hyperactive relations without resorting to a manual invocation of VACUUM, which can significantly affect the system.
Tune individual tables using this SQL command.
|
1 |
ALTER TABLE ... SET STORAGE_PARAMETER |
Complexity: Low
Potential Impact: Medium-High
Over time, even with the best intentions, performance can degrade due to inadequate vacuuming policies that cause excessive bloat. In some cases, even tuning the autovacuum daemon and manually invoking VACUUM will not easily resolve the issue. For these cases, the pg_repack extension comes to the rescue.
pg_repack: rebuilds and reorganizes tables and indexes under production conditions.
Complexity: High
Potential Impact: Low-Medium-High
Similar to MySQL hotspots, the PostgreSQL experience, and the resolution of hotspots, relies on extensive knowledge of data flow. At its most extreme, mitigation can require refactoring the system’s architecture.
Here are a few popular mitigation techniques:
Complexity: Low
Potential Impact: High
PHP, Java, and Python applications: Avoid running applications and Postgres on the same host. In the past, a web service and RDBMS could often run on the same machine because their resource usage was complementary. Be careful with applications based on these languages because they can consume large amounts of RAM, especially during garbage collection. This competes with database systems and reduces overall performance.
Complexity: Low
Potential Impact: High
Async vs. sync: The most recent versions of Postgres support logical and streaming replication in both synchronous and asynchronous modes. Although the default replication mode is asynchronous, you must consider the implications of synchronous replication, especially over network connections with less-than-ideal latency.
Last but not least are the most basic considerations: make the host bigger and better. Let’s review what each of the following resources brings to PostgreSQL performance.
Our white paper, “Why Choose PostgreSQL?”, looks at the features and benefits of PostgreSQL and presents practical usage examples. We also examine how PostgreSQL can be useful for companies looking to migrate from Oracle.


