
While the PMM team works hard on our PMM 2.0 release, we have been working on a few things in the background which we’d like to show off ! In particular we have developed a new dashboard that displays metrics related to memory usage on Linux systems. The dashboard leverages information collected by node_exporter. The graphs take advantage of /proc filesystem files, specifically:
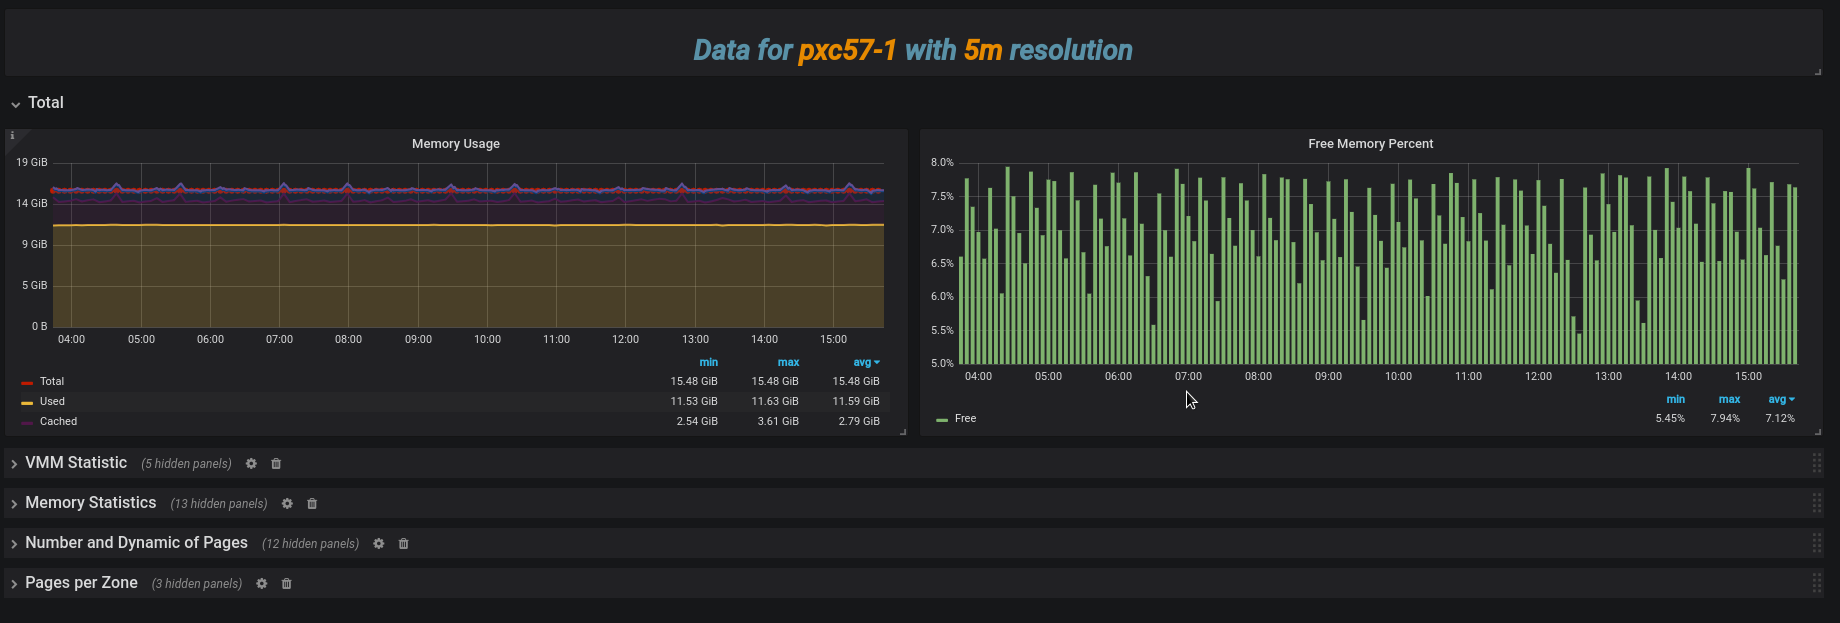
The information is split into five sections:
The dashboard will be included as part of the PMM 2.0 release. For you early adopters, you can get it from GrafanaLab and install it alongside your existing Dashboards – it won’t overwrite anything!
This dashboard works with all PMM Server versions starting with 1.7 (January 31, 2018).


