
 This blog post is another in the series on the Percona Server for MongoDB 3.4 bundle release. This post is meant to walk a prospective user through the benefits of Percona Monitoring and Management (PMM), how it’s architected and the simple install process. By the end of this post, you should have a good idea of what PMM is, where it can add value in your environment and how you can get PMM going quickly.
Percona Monitoring and Management (PMM) is Percona’s open-source tool for monitoring and alerting on database performance and the components that contribute to it. PMM monitors MySQL (Percona Server and MySQL CE), Amazon RDS/Aurora, MongoDB (Percona Server and MongoDB CE), Percona XtraDB/Galera Cluster, ProxySQL, and Linux.
Percona Monitoring and Management is an amalgamation of exciting, best in class, open-source tools and Percona “engineering wizardry,” designed to make it easier to monitor and manage your environment. The real value to our users is the amount of time we’ve spent integrating the tools, plus the pre-built dashboards we’ve constructed that leverage the ten years of performance optimization experience. What you get is a tool that is ready to go out of the box, and installs in minutes. If you’re still not convinced, like ALL Percona software it’s completely FREE!
Sound good? I can hear you nodding your head. Let’s take a quick look at the architecture.
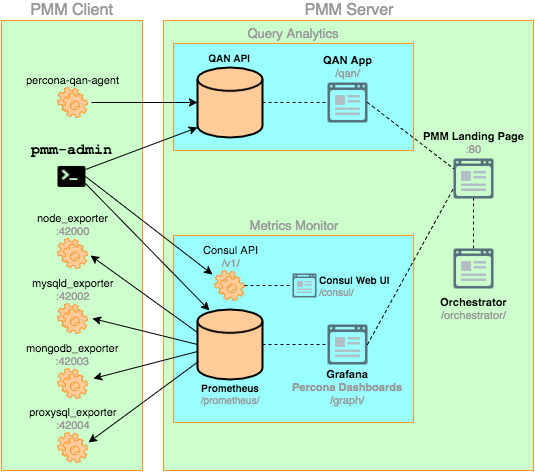
PMM, at a high-level, is made up of two basic components: the client and the server. The PMM Client is installed on the database servers themselves and is used to collect metrics. The client contains technology specific exporters (which collect and export data), and an “admin interface” (which makes the management of the PMM platform very simple). The PMM server is a “pre-integrated unit” (Docker, VM or AWS AMI) that contains four components that gather the metrics from the exporters on the PMM client(s). The PMM server contains Consul, Grafana, Prometheus and a Query Analytics Engine that Percona has developed. Here is a graphic from the architecture section of our documentation. In order to keep this post to a manageable length, please refer to that page if you’d like a more “in-depth” explanation.
PMM is very easy to access once it has been installed (more on the install process below). You will simply open up the web browser of your choice and connect to the PMM Landing Page by typing http://<ip_address_of _PMM_server>. That takes you to the PMM landing page, where you can access all of PMM’s tools. If you’d like to get a look into the user experience, we’ve set up a great demo site so you can easily test it out.
There’s a good chance that you already have a monitoring/alerting platform for your production workloads. If not, you should set one up immediately and start analyzing trends in your environment. If you’re confident in your production monitoring solution, there is still a use for PMM in an often overlooked area: development and testing.
When speaking with users, we often hear that their development and test environments run their most demanding workloads. This is often due to stress testing and benchmarking. The goal of these workloads is usually to break something. This allows you to set expectations for normal, and thus abnormal, behavior in your production environment. Once you have a good idea of what’s “normal” and the critical factors involved, you can alert around those parameters to identify “abnormal” patterns before they cause user issues in production. The reason that monitoring is critical in your dev/test environment(s) is that you want to easily spot inflection points in your workload, which signal impending disaster. Dashboards are the easiest way for humans to consume and analyze this data.
Are you sold? Let’s get to the easiest part: installation.
PMM is very easy to install and configure for two main reasons. The first is that the components (mentioned above) take some time to install, so we spent the time to integrate everything and ship it as a unit: one server install and a client install per host. The second is that we’re targeting customers looking to monitor MySQL and MongoDB installations for high-availability and performance. The fact that it’s a targeted solution makes pre-configuring it to monitor for best practices much easier. I believe we’ve all seen a particular solution that tries to do a little of everything, and thus actually does no particular thing well. This is the type of tool that we DO NOT want PMM to be. Now, onto the installation procedure.
There are four basic steps to get PMM monitoring your infrastructure. I do not want to recreate the Deployment Guide in order to maintain the future relevancy of this post. However, I’ll link to the relevant sections of the documentation so you can cut to the chase. Also, underneath each step, I’ll list some key takeaways that will save you time now and in the future.
That’s really up to you, and what makes sense for your needs. However, here are a few suggestions to get the most out of PMM.
Resources
RELATED POSTS


The demo site seems to be not reachable