
In this blog post, we will show you how to add external exporters to Percona Monitoring and Management (PMM) and monitor various services. Our focus will be on Valkey/Redis, but the principles apply to other technologies as well.
PMM uses VictoriaMetrics, which is compatible with Prometheus. Prometheus has numerous exporters that you can use.
When you install PMM Client on a server, the following exporters are also installed:
In addition to these, you can add any additional exporters, known as external exporters. The PMM Client will connect to these exporters and send the metrics to the PMM Server. Let’s see how we can add the Valkey/Redis exporter.
The Prometheus exporter for Valkey, which is also Redis-compatible, is available here. Follow the installation instructions for the exporter. For simplicity, we will download and set it up using systemd. Execute the following commands on your Valkey/Redis server:
|
1 2 3 4 5 |
> wget https://github.com/oliver006/redis_exporter/releases/download/v1.61.0/redis_exporter-v1.61.0.linux-amd64.tar.gz > tar xfv redis_exporter-v1.61.0.linux-amd64.tar.gz > sudo groupadd --system prometheus > sudo useradd -s /sbin/nologin --system -g prometheus prometheus > sudo cp redis_exporter-v1.61.0.linux-amd64/redis_exporter /usr/local/bin/ |
For security reasons, you can add the following user to your Redis/Valkey configuration file:
|
1 |
user monitor +client +ping +info +config|get +cluster|info +slowlog +latency +memory +select +get +scan +xinfo +type +pfcount +strlen +llen +scard +zcard +hlen +xlen +eval allkeys on >{{PASSWORD}} |
Of course, you have to change the password.
Create the /etc/systemd/system/valkey_exporter.service systemd file with the following content:
|
1 2 3 4 5 6 7 8 9 10 11 12 13 14 15 16 17 18 19 20 21 22 23 24 25 |
[Unit] Description=Valkey/Redis exporter Documentation=https://github.com/oliver006/redis_exporter Wants=network-online.target After=network-online.target [Service] Type=simple User=prometheus Group=prometheus ExecReload=/bin/kill -HUP $MAINPID ExecStart=/usr/local/bin/redis_exporter --log-format=txt --namespace=redis --web.listen-address=:9121 --web.telemetry-path=/metrics --redis.user=monitor --redis.password={{PASSWORD}} SyslogIdentifier=valkey_exporter Restart=always [Install] WantedBy=multi-user.target |
Then enable the daemon:
|
1 2 3 |
> sudo systemctl daemon-reload > sudo systemctl enable valkey_exporter > sudo systemctl start valkey_exporter |
At this point, the Valkey/Redis exporter is already running and exposing the metrics on port 9121.
Now, we have to tell the PMM Client to collect the metrics from that port.
|
1 |
> pmm-admin add external --service-name=valkey --listen-port=9121 |
With this simple command, PMM Client starts collecting metrics and sends them to PMM Server. If you do not have a PMM Server or Client configured yet please follow this link.
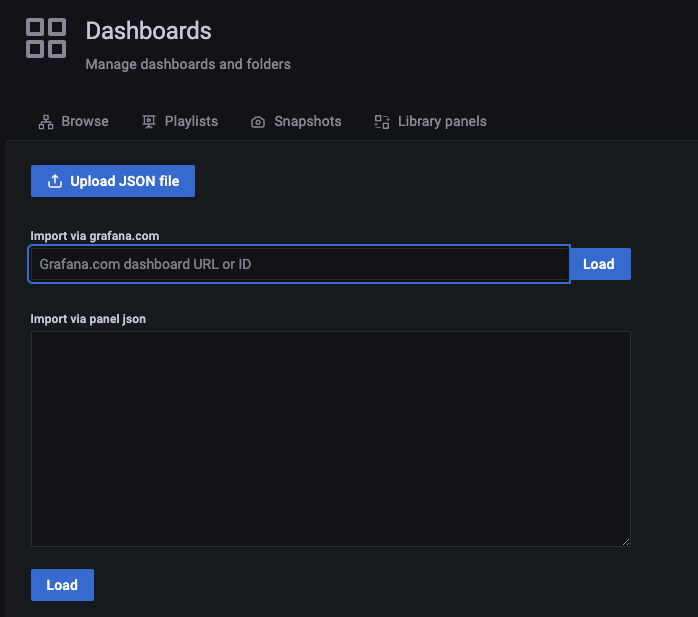
Now, let’s visualize the data we collect. PMM is based on Grafana, and Grafana has many publicly available dashboard templates. To find a Redis dashboard, visit the Grafana website and search for “Redis dashboard.” Choose your favorite template and load it into PMM. To do this, navigate to Dashboards -> Import and enter the Dashboard ID that you chose.
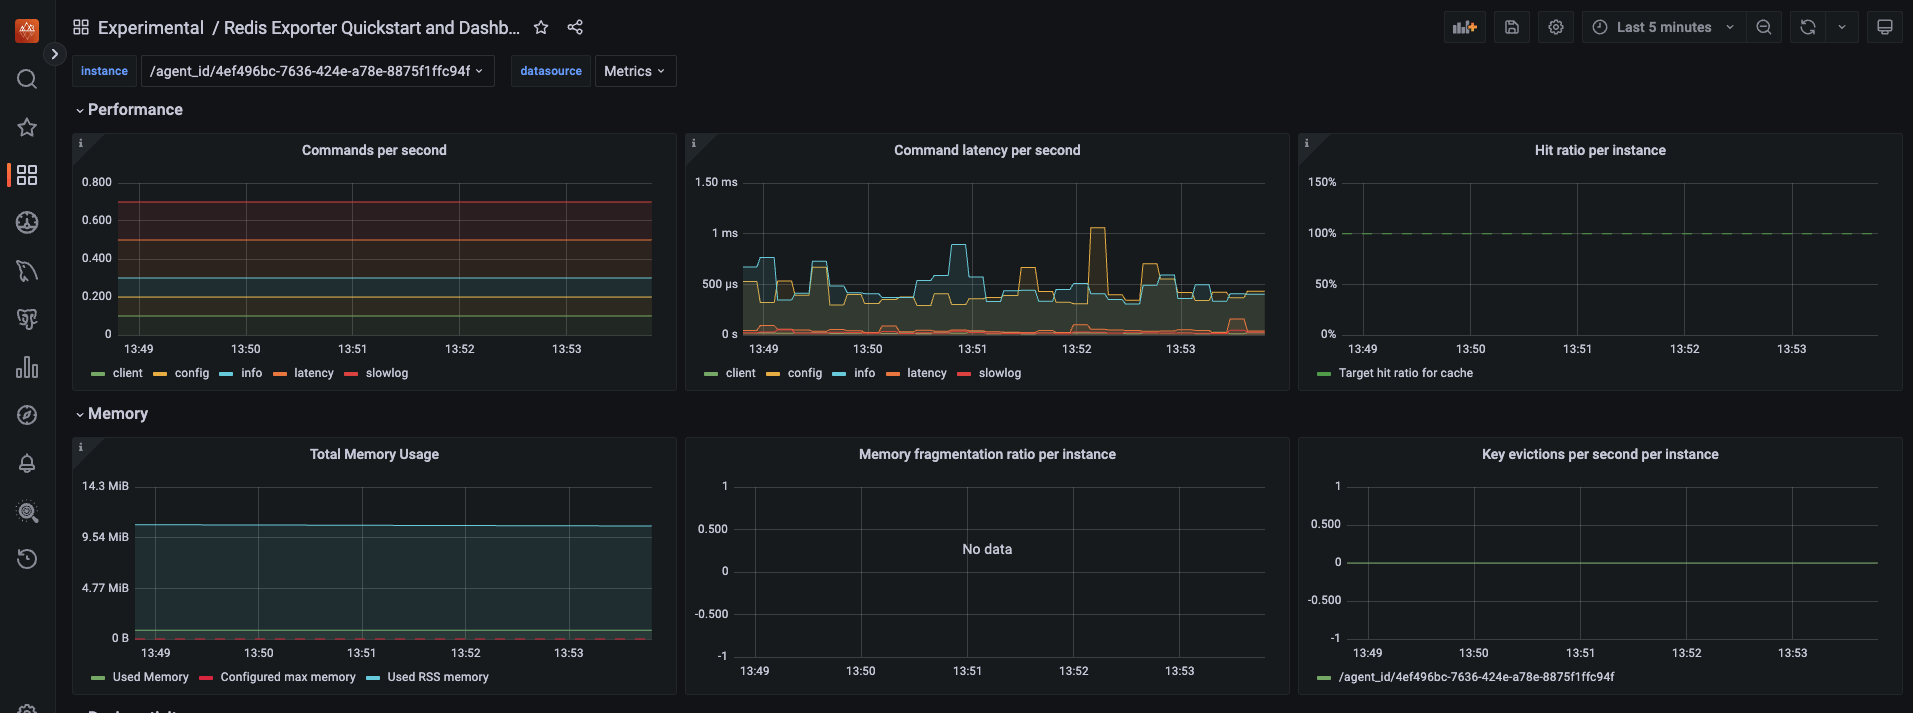
Now, you have a Valkey/Redis dashboard in PMM. You can customize this dashboard as you like.
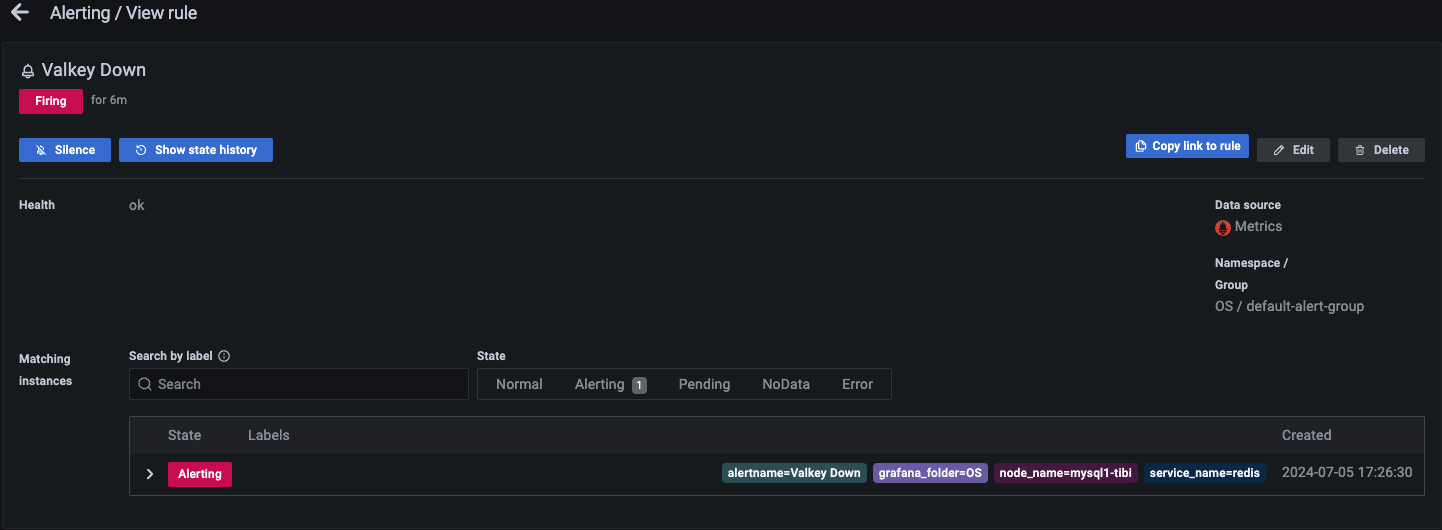
We also want an alert if the Valkey/Redis service is unavailable. We can create an alert rule based on the redis_up metric. Follow these steps to set up the alert:
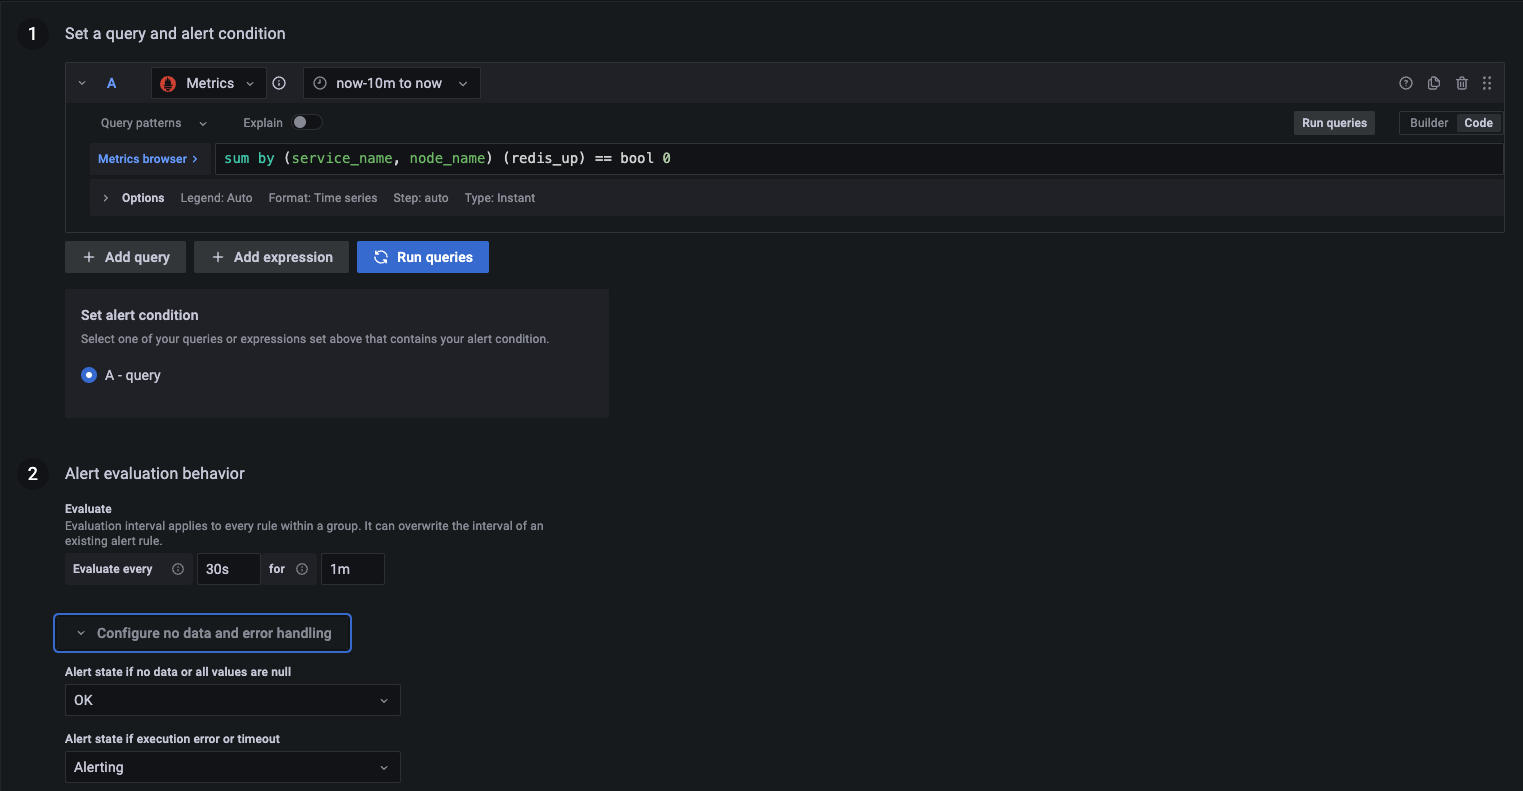
This configuration ensures that you will be alerted if the Valkey instance is down for more than one minute.
If you want more alert rules, you can find a nice collection here.
By following these steps, you can monitor Valkey/Redis with PMM. The process is straightforward and can be adapted for other exporters and services. PMM’s flexibility in integrating with various exporters makes it a powerful tool for comprehensive monitoring. Additionally, with Grafana dashboards and alerting, you can visualize and be alerted to the health of your services in real time.
Percona Monitoring and Management is a best-of-breed open source database monitoring solution tool for MySQL, PostgreSQL, MongoDB, and the servers on which they run. It allows you to monitor, manage, and improve the performance of your databases, no matter where they are located or deployed.
Resources
RELATED POSTS