
Even though I used a dedicated Kubernetes cluster to host my test database, I had this belief that by not explicitly allocating (or requesting, in Kubernetes vocabulary) CPU resources to my Percona XtraDB Cluster (PXC) pods or yet making just a small request, Kubernetes could be delaying access to the free CPU cycles available on the hosts and that this could be contributing to the cluster entering flow control so often, as it was happening in my tests. I was wrong.
The lesson I learned is very simple: if you’re not explicitly limiting how much CPU your pods should use and there is extra CPU available in the Kubernetes server that hosts them, they will be able to tap into that reservoir, no problem.
In this post, I will share how to quickly deploy a Kubernetes environment and generate load on it so you can try to reproduce your own experiments. Oh, and I will also remind you (and me) how to tune replication on PXC properly.
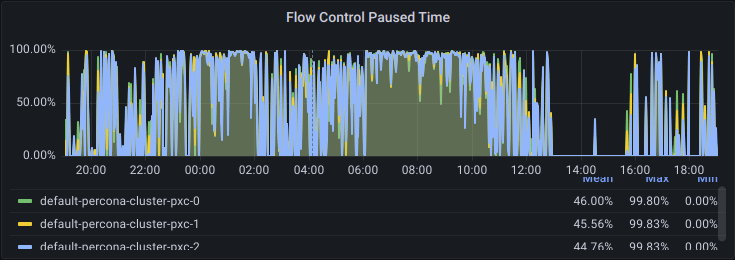
Last week, I started working on a health audit project for a PXC cluster that was recently migrated to Kubernetes and managed by the Percona Operator for MySQL. The first thing I noticed, almost immediately, was how much time the cluster was paused due to Galera’s flow control being triggered by one of the “reader” nodes; from looking at the PMM graphs, that appeared to be happening virtually all the time during business hours (the odd hours in the graph below are due to a mismatch in timezones):
Yet, customers were not complaining of slowness and the operations team was not noticing any stalls in the application. Even with the cluster entering and leaving flow control virtually the whole time, query throughput was still good enough.
We say Galera, the replication library used by PXC, is semi-synchronous because even though the other nodes in the cluster need to receive and “approve” a write transaction initiated by a given node, they do not have to apply that change in their dataset before the transaction is fully committed on the source node. They confirm the transactions are “good to go” (the technical term for this in Galera is certification) and put it in their queue of events to apply locally. Yes, this opens the door for causal reads. It is a performance compromise: it’s possible to have a fully synchronous cluster operation, where a transaction is only committed once it has been applied in all nodes, but writes would take even longer to complete.
To avoid allowing nodes to continue operating with a large queue of not yet applied events, Galera employs a threshold mechanism: whenever a node’s apply queue reaches gcs.fc_limit (an option defined by the variable wsrep_provider_options), that node needs to inform the others. As a result of that, all nodes stop processing new writes, and the cluster enters a “paused” state – flow control is activated. This pause is only a few milliseconds at a time but allows some breathing room for all nodes to work on their backlogs. As soon as the nodes get their apply queues back “under control” (below the mark defined by gcs.fc_limit * gcs.fc_factor), they let the others know. The cluster exits the flow control state and starts processing writes again.
Note this can be a very dynamic occurrence: a cluster can get into and out of flow control virtually all the time. In the environment depicted by the above graph, all writes are sent to the same node, which I’m referring to as the “writer” node, while the other nodes are operating at the limit of their apply queues (175 by default for a 3-node cluster). They need that extra “breathing room” provided by flow control to go back below that threshold mark, but it all happens very fast, which is why it may not have been noticed by anyone:
For a more in-depth explanation of flow control, I still like to refer to this 10+ year-old blog post from former Perconian Jay Janssen: Galera Flow Control in Percona XtraDB Cluster for MySQL.
Said otherwise, why can’t the “reader” nodes apply the events in their queue in a timely manner?
It may be down to the exact same reason why sometimes a MySQL replica cannot keep up with the source server and the replication SQL_thread starts to lag: transactions might be too big, or the server might be unable to parallelize the application of the replication events as efficiently as they are being (concurrently) processed in the source server; multi-threaded replication has been improved a lot over the years, but it’s not perfect. And that’s exactly the point where I made a mistake in my investigative process, as you will see next.
In the rest of this article, I’ll deliberately walk you through the process I used to try and reproduce the problem, mistakes included. I hope you find it a useful reference to quickly deploy a similar test environment for your own experiments and that, different from me, you will remember how to properly tune multi-threaded replication in a PXC environment the next time you need it.
Almost any Kubernetes environment will do, as indicated in the Percona Operator for MySQL documentation. For these quick tests, I went with GCP; if you already have an account and a project configured, deploying a new Kubernetes cluster is very simple. (As with any cloud provider, just pay attention to the usage fees).
I created a four-node GKE cluster using n2-standard-16 VMs (16 vCPU, 64G) distributed in two node pools. Here are the four steps it took me to create this cluster:
|
1 2 3 4 |
gcloud auth login gcloud container clusters create nando-pblog --project my-project --zone us-central1-a --machine-type n2-standard-16 --num-nodes=3 gcloud container node-pools create monapp --cluster nando-pblog --zone us-central1-a --machine-type n2-standard-16 --num-nodes=1 gcloud container clusters get-credentials nando-pblog --zone us-central1-a --project my-project |
You only need three K8s nodes for deploying a PXC cluster. The fourth K8s node I created in a separate node pool (which I called monapp) for hosting the PMM server (monitoring) and Sysbench (application):
|
1 2 3 4 5 6 7 8 9 10 11 12 13 14 15 |
$ gcloud container clusters list NAME LOCATION MASTER_VERSION MASTER_IP MACHINE_TYPE NODE_VERSION NUM_NODES STATUS nando-pblog us-central1-a 1.30.3-gke.1969001 <REDACTED> n2-standard-16 1.30.3-gke.1969001 4 RUNNING $ gcloud container node-pools list --cluster nando-pblog --zone us-central1-a NAME MACHINE_TYPE DISK_SIZE_GB NODE_VERSION default-pool n2-standard-16 100 1.30.3-gke.1969001 monapp n2-standard-16 100 1.30.3-gke.196900 $ kubectl get nodes --label-columns=cloud.google.com/gke-nodepool NAME STATUS ROLES AGE VERSION GKE-NODEPOOL gke-nando-pblog-default-pool-0208b0bf-15ff Ready <none> 43m v1.30.3-gke.1969001 default-pool gke-nando-pblog-default-pool-0208b0bf-j75l Ready <none> 43m v1.30.3-gke.1969001 default-pool gke-nando-pblog-default-pool-0208b0bf-psnz Ready <none> 43m v1.30.3-gke.1969001 default-pool gke-nando-pblog-monapp-990d0c9a-q8vv Ready <none> 40m v1.30.3-gke.1969001 monapp |
This being an experiment on CPU resources, the goal was to have each PXC node in a dedicated host (with no other services running in parallel).
NOTE: There are different ways to assign pods to a node/node pool in Kubernetes. In this post, I’ll employ a simple approach based on the use of nodeName and nodeSelector. Affinity and anti-affinity rules allow for more refined constraints.
In short, get a copy of the latest Percona Operator for MySQL branch from Github (1.15.0 at the time I wrote this procedure):
|
1 2 |
git clone -b v1.15.0 https://github.com/percona/percona-xtradb-cluster-operator cd percona-xtradb-cluster-operator |
and edit the custom resources file (deploy/cr.yaml) to adjust some of the settings:
|
1 2 3 4 5 6 7 8 9 10 11 12 13 14 15 16 17 18 19 20 21 22 23 24 25 26 27 28 29 30 31 32 33 34 35 36 37 38 39 40 41 42 43 44 45 46 47 48 49 50 51 52 53 54 55 56 57 58 |
$ git diff diff --git a/deploy/cr.yaml b/deploy/cr.yaml index bcf6fe44..c55b1df3 100644 --- a/deploy/cr.yaml +++ b/deploy/cr.yaml @@ -85,8 +85,13 @@ spec: # schedulerName: mycustom-scheduler # readinessDelaySec: 15 # livenessDelaySec: 600 -# configuration: | -# [mysqld] + configuration: | + [mysqld] + max_connections=1000 + innodb_buffer_pool_size=8Gi + innodb_redo_log_capacity=2Gi + thread_cache_size=150 + innodb_adaptive_hash_index=off # wsrep_debug=CLIENT # wsrep_provider_options="gcache.size=1G; gcache.recover=yes" # [sst] @@ -139,14 +144,15 @@ spec: # envVarsSecret: my-env-var-secrets resources: requests: - memory: 1G + memory: 10G cpu: 600m # ephemeral-storage: 1G # limits: # memory: 1G # cpu: "1" # ephemeral-storage: 1G -# nodeSelector: + nodeSelector: + cloud.google.com/gke-nodepool: default-pool # disktype: ssd # topologySpreadConstraints: # - labelSelector: @@ -189,7 +195,7 @@ spec: # apiGroup: snapshot.storage.k8s.io resources: requests: - storage: 6G + storage: 300G gracePeriod: 600 # lifecycle: # preStop: @@ -322,7 +328,8 @@ spec: # memory: 1G # cpu: 700m # priorityClassName: high-priority -# nodeSelector: + nodeSelector: + cloud.google.com/gke-nodepool: default-pool # disktype: ssd # sidecarResources: # requests: |
The four sections I changed were:
Once these changes were made, I deployed the PXC cluster in a custom namespace I named “pxc” (I could as well have used the “default” namespace):
|
1 2 3 4 5 |
kubectl create clusterrolebinding cluster-admin-binding --clusterrole cluster-admin --user $(gcloud config get-value core/account) kubectl create namespace pxc kubectl config set-context $(kubectl config current-context) --namespace=pxc kubectl apply -f deploy/bundle.yaml kubectl apply -f deploy/cr.yaml |
Once you apply the bundle file, wait until the operator pod is created before applying the custom resources file; it should only take a few seconds. Make sure the PXC cluster is up and running before proceeding. A simple way to connect is to get the MySQL root password from the main secret object and start a MySQL client container to connect to the cluster1-pxc entry point, which will take you to the HAproxy assigned writer node:
|
1 2 |
MYPASS=`kubectl get secrets cluster1-secrets -o yaml|grep "root:"|awk -F": " '{print $2}'| base64 -d` kubectl run -it --rm percona-client --image=percona:8.0 --restart=Never -- mysql -hcluster1-pxc -uroot -p$MYPASS |
Keep that session open; we will need it later.
I could have deployed the PMM server upfront and configured the custom resources file with PMM monitoring already set to enabled. The reason I didn’t do it was to properly split the tasks and get the PXC cluster up first.
I deployed PMM with the help of a Helm chart as follows (note the use of –set spec.nodeName to indicate the PMM pod should be deployed on the 4th node):
|
1 2 3 4 5 6 |
helm repo add percona https://percona.github.io/percona-helm-charts/ helm install pmm percona/pmm --set spec.nodeName=gke-nando-pblog-monapp-990d0c9a-q8vv export ADMIN_PASS=$(kubectl get secret pmm-secret --namespace pxc -o jsonpath='{.data.PMM_ADMIN_PASSWORD}' | base64 --decode) kubectl get service/monitoring-service -o wide --namespace=pxc kubectl -n pxc port-forward pmm-0 8080:443 API_KEY=$(curl --insecure -X POST -H "Content-Type: application/json" -d '{"name":"operator", "role": "Admin"}' "https://admin:$ADMIN_PASS@localhost:8080/graph/api/auth/keys" | jq .key) |
The last step in the procedure above consisted of creating a PMM API key, which we will configure the operator to use to register the PXC pods in the PMM server. Alternatively, you can create this API key manually through the PMM web interface.
The kubectl port-forward command is used so you can access the PMM interface by pointing your browser to https://localhost:8080 and authenticate with the user admin and the password in $ADMIN_PASS. You can view the admin password and the API key generated above by checking the contents of those two environment variables:
|
1 2 |
echo $ADMIN_PASS echo $API_KEY |
We can now configure our PXC cluster to be monitored by the new PMM server with the help of the operator in two steps:
1) Edit the deploy/secrets.yaml configuration file adding the PMM key as the value for variable pmmserverkey, as shown below (replace the <API_KEY> placeholder accordingly):
|
1 2 3 4 5 6 7 |
apiVersion: v1 kind: Secret metadata: name: cluster1-secrets type: Opaque stringData: pmmserverkey: <API_KEY> |
Then apply the changes with:
|
1 |
kubectl -n pxc apply -f deploy/secrets.yaml |
2) Edit the custom resources file (deploy/cr.yaml) to enable PMM monitoring:
|
1 |
spec.pmm.enabled: true |
Then apply the changes with:
|
1 |
kubectl -n pxc apply -f deploy/cr.yaml |
That’s all!
Finally, deploy a Sysbench container also in the 4th node (defined by spec.nodeName below):
|
1 2 3 4 5 6 7 8 9 10 11 12 |
cat <<EOF | kubectl -n pxc create -f - apiVersion: v1 kind: Pod metadata: name: sysbench spec: nodeName: gke-nando-pblog-monapp-990d0c9a-q8vv containers: - name: sysbench-client image: perconalab/sysbench imagePullPolicy: IfNotPresent EOF |
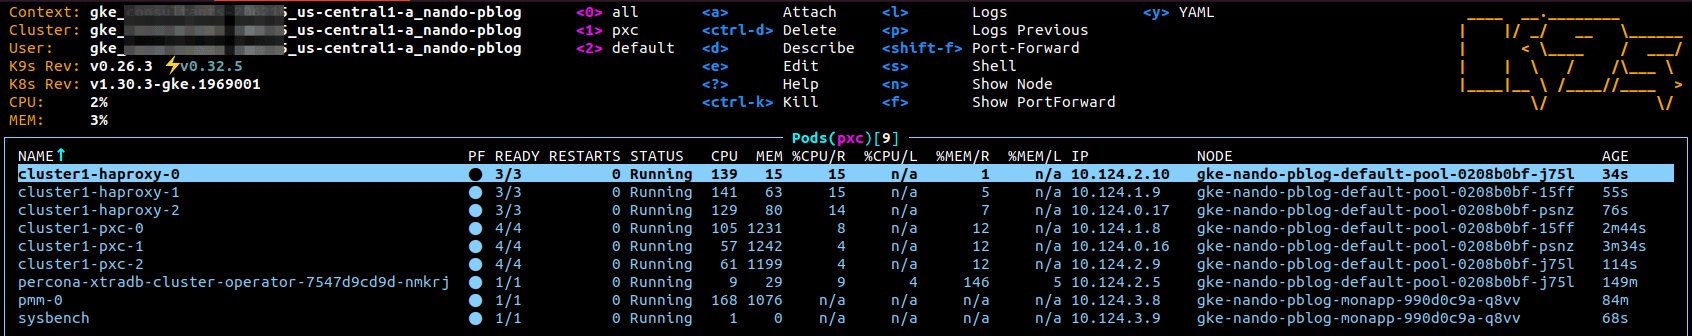
An easy way to navigate around Kubernetes is with the help of K9s Kubernetes management CLI. In the screenshot below, we can see the pods have been scheduled as designed, with the PXC cluster hosted in the main node pool and both the PMM server and Sysbench container running on the “4th node” (monapp):
First, we need to create the target database and user. Use the MySQL client session created earlier for this:
|
1 2 3 |
CREATE DATABASE IF NOT EXISTS sysbench; CREATE USER IF NOT EXISTS 'sysbench'@'%' IDENTIFIED BY 'Sy$3enCh#1'; GRANT ALL ON sysbench.* TO 'sysbench'@'%'; |
Now, connect to the Sysbench container:
|
1 |
kubectl exec -it sysbench -- bash |
Prepare the data, distributed in eight tables:
|
1 |
/usr/bin/sysbench /usr/share/sysbench/oltp_read_write.lua --db-driver=mysql --mysql-user=sysbench --mysql-password='Sy$3enCh#1' --mysql-host=cluster1-pxc --mysql-db=sysbench --tables=8 --table_size=10000000 --threads=8 prepare |
This results in less than 20G in total for data and indexes, which is small enough for the hot data to fit in the buffer pool:
|
1 2 |
$ kubectl exec -it cluster1-pxc-0 -c pxc -- du -sh /var/lib/mysql 35G /var/lib/mysql |
Run a 15-minute OLTP read-write workload with 128 concurrent threads:
|
1 |
/usr/bin/sysbench /usr/share/sysbench/oltp_read_write.lua --db-driver=mysql --mysql-user=sysbench --mysql-password='Sy$3enCh#1' --mysql-host=cluster1-pxc --mysql-db=sysbench --tables=8 --threads=128 --time=900 --skip_trx=on --mysql-ignore-errors=all --report-interval=1 run |
I ran this workload for five different configurations at first:
I found no performance gains with any of the customized configurations from above. In fact, allowing the reader nodes’ events queue to grow bigger before they triggered flow control (#4) resulted in the worst throughput of all:
| Configuration | QPS |
| #1 | 5075.92 |
| #2 | 4942.69 |
| #3 | 4647.36 |
| #4 | 4153.76 |
| #5 | 4704.35 |
The only way I found to avoid flow control for this workload for this particular cluster and configuration was to limit query throughput below 3k QPS, which can be achieved using different combinations of Sysbench’s –threads and –rate options. Here’s a simple comparison of a few such combinations:
| Test # | –threads | –rate |
| A | 64 | 128 |
| B | 128 | 128 |
| C | 128 | 256 |
| D | 128 | 192 |
with the results shown below:
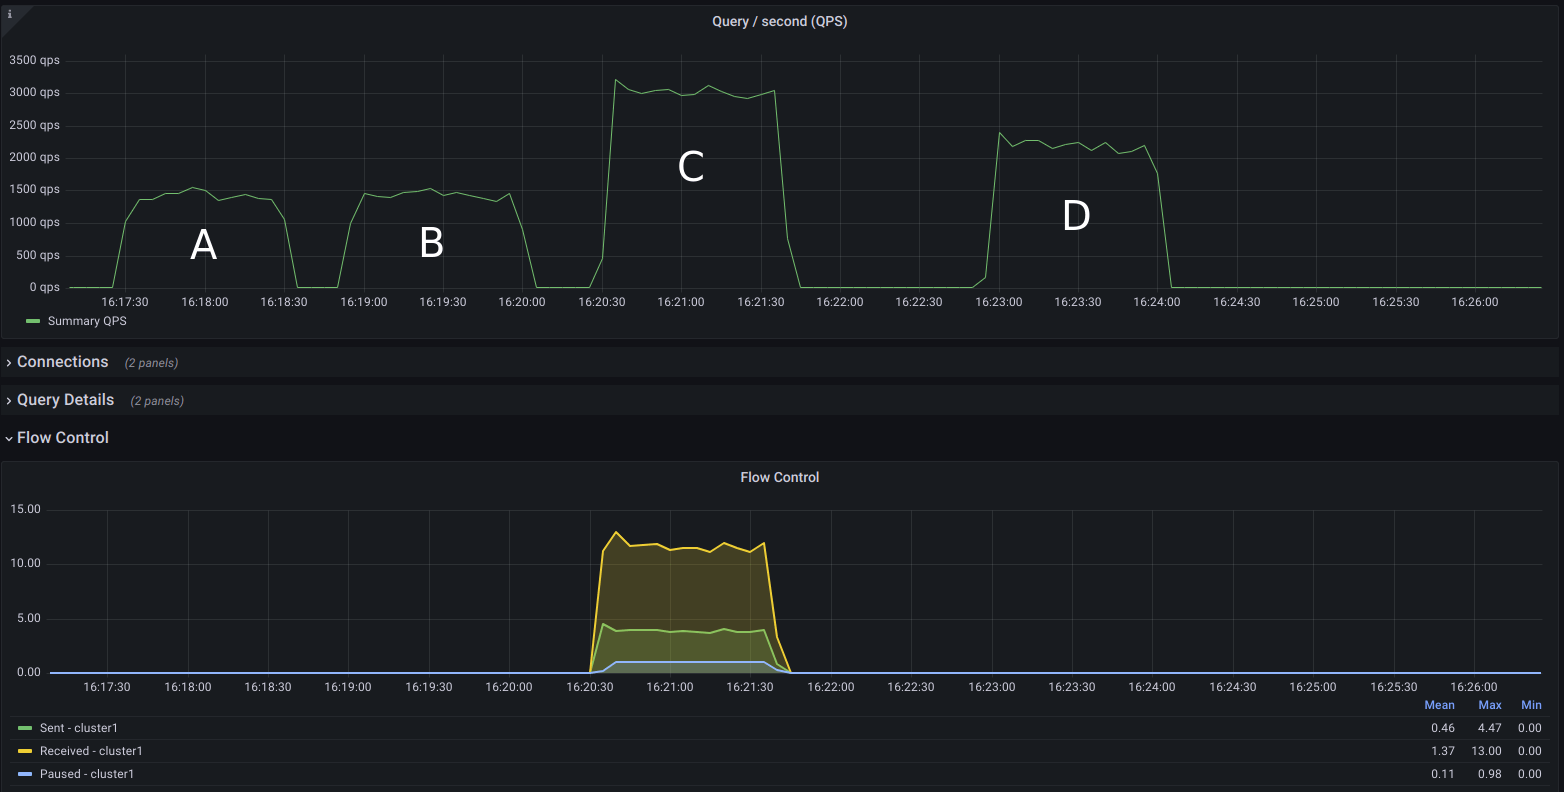
I wanted to show this graph to highlight the fact that, even though we want to avoid flow control, from the limited combinations in the above test, we still got the best query throughput in the scenario where the cluster was in-and-out of flow control the whole time (C). Can it do better? When you get the right configuration for replication, yes.
I did make a mistake in forgetting that replica_parallel_workers has no effect on Galera replication; I should be using wsrep_applier_threads to configure replication parallelization instead, which is set to 2 by default.
As soon as I tested with wsrep_applier_threads=4, I got twice as much throughput from the cluster. That number kept growing with more applier threads, even if we can’t avoid flow control kicking in often – although not virtually the whole time as before. The exception, for this environment and workload, is when I “throttle” Sysbench using –rate=400 (for 32 applier threads):
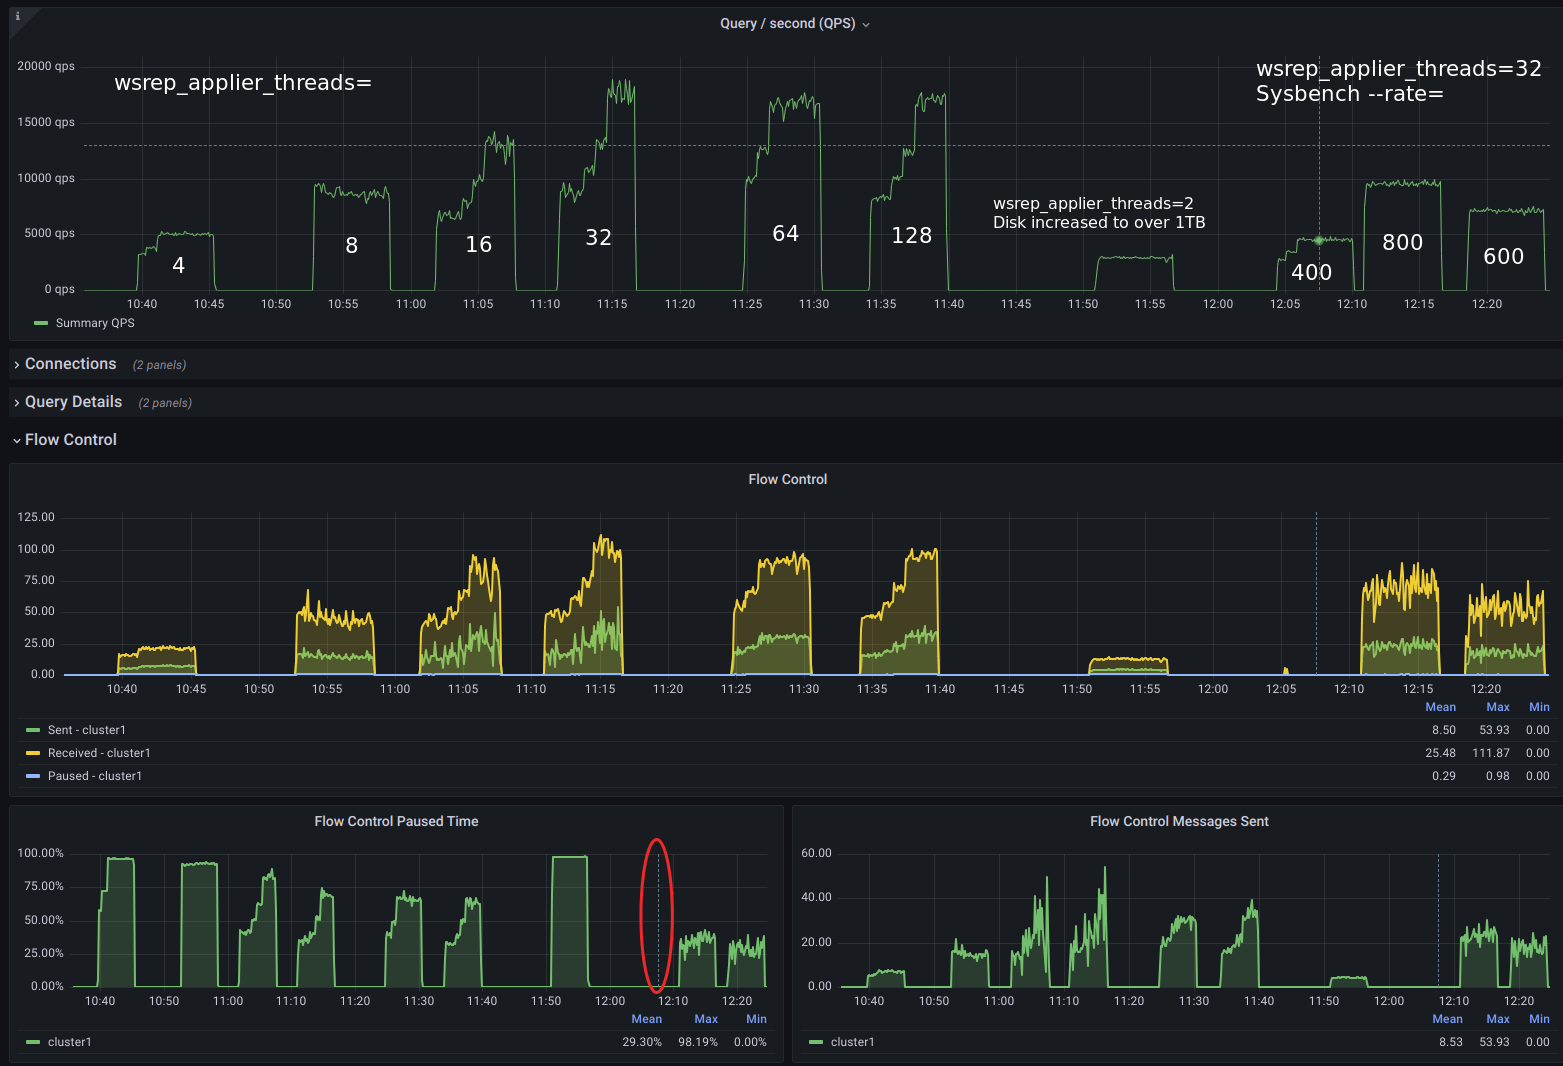
As we can see above, we cannot avoid flow control without throttling writes. On the other hand, in a way, throttling writes is precisely what flow control does. Thus, as long as we are able to squeeze the performance we need out of the cluster, we’re good.
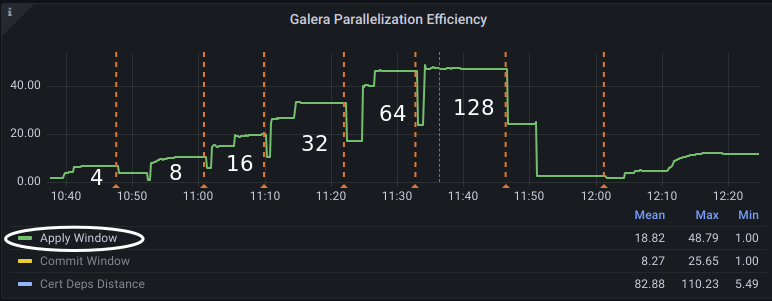
In the tests above, we can say the best replication parallelization was achieved once it was operating with 64 wsrep_applier_threads:
Remember to delete your test environment once you’re done with your experiments. All you probably need is something like:
|
1 |
gcloud container clusters delete nando-pblog --zone us-central1-a |
MySQL Performance Tuning is an essential guide covering the critical aspects of MySQL performance optimization.


