
 Continuing with the checkpointing topic I started a month ago with my blog post MongoDB Checkpointing Woes, this time I want to review how PostgreSQL performs in this area. After this, I will be taking a look at MySQL and MariaDB. If anything, it will be fair not only to complain about MongoDB but to review how other databases handle it, as well.
To evaluate PostgreSQL I will use a not identical but similar scenario: using sysbench-tpcc with 1000 Warehouses, and as with sysbench you can produce tpcc-like workload for PostgreSQL:
Sysbench-tpcc Supports PostgreSQL (No, Really This Time)
Tuning PostgreSQL for sysbench-tpcc
The hardware I use is:
|
1 2 3 4 5 6 7 8 9 10 11 12 13 14 |
System | Supermicro; SYS-F619P2-RTN; v0123456789 (Other) Platform | Linux Release | Ubuntu 18.04.4 LTS (bionic) Kernel | 5.3.0-42-generic Architecture | CPU = 64-bit, OS = 64-bit Threading | NPTL 2.27 SELinux | No SELinux detected Virtualized | No virtualization detected # Processor ################################################## Processors | physical = 2, cores = 40, virtual = 80, hyperthreading = yes Models | 80xIntel(R) Xeon(R) Gold 6230 CPU @ 2.10GHz Caches | 80x28160 KB # Memory ##################################################### Total | 187.6G |
With the storage on SATA SSD INTEL SSDSC2KB960G8 (Intel Enterprise-grade SSD D3-S4510).
The PostgreSQL config is:
|
1 2 3 4 5 6 7 8 9 10 11 12 13 14 15 16 17 18 19 20 21 22 23 24 25 26 27 28 |
shared_buffers = '140GB' work_mem = '4MB' random_page_cost = '1' maintenance_work_mem = '2GB' wal_level = 'replica' max_wal_senders = '3' synchronous_commit = 'on' seq_page_cost = '1' synchronous_commit = 'on' checkpoint_completion_target = '0.9' checkpoint_timeout = '900' max_wal_size = '20GB' min_wal_size = '12GB' autovacuum_vacuum_scale_factor = '0.4' effective_cache_size = '200GB' bgwriter_lru_maxpages = '1000' bgwriter_lru_multiplier = '10.0' logging_collector = 'ON' wal_compression = 'ON' log_checkpoints = 'ON' archive_mode = 'OFF' full_page_writes = 'ON' fsync = 'ON' |
The short settings overview:
The benchmark command line is:
|
1 |
./tpcc.lua --pgsql-user=sbtest --pgsql-password=sbtest --pgsql-db=sbtest --time=3600 --threads=56 --report-interval=1 --tables=10 --scale=100 --use_fk=0 --trx_level=RC --db-driver=pgsql --report_csv=yes run |
This means that the benchmark will run for 1 hour, with reporting throughput every 1 sec.
Let’s see what results I’ve got with this setup:
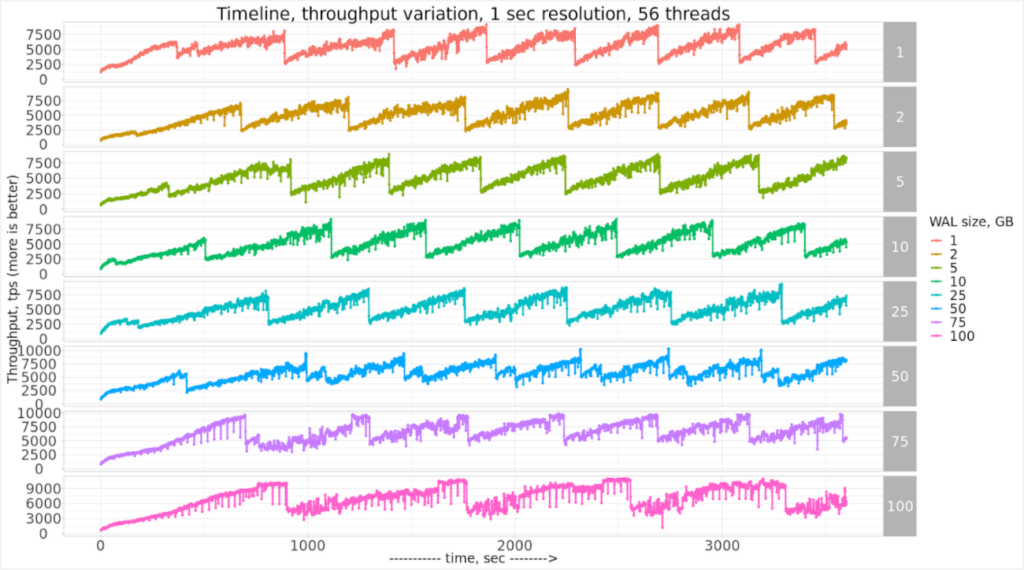
That’s an interesting pattern!
Although there are no drops to the floor, we see a saw-like pattern, where throughput raises to ~8000 tps and then drops to ~3000tps (that’s 2.6 times drop!).
It was suggested to check how PostgreSQL would perform with full_page_writes = 'OFF' (this is not a data-safe setting and I would not recommend to use it in production!)
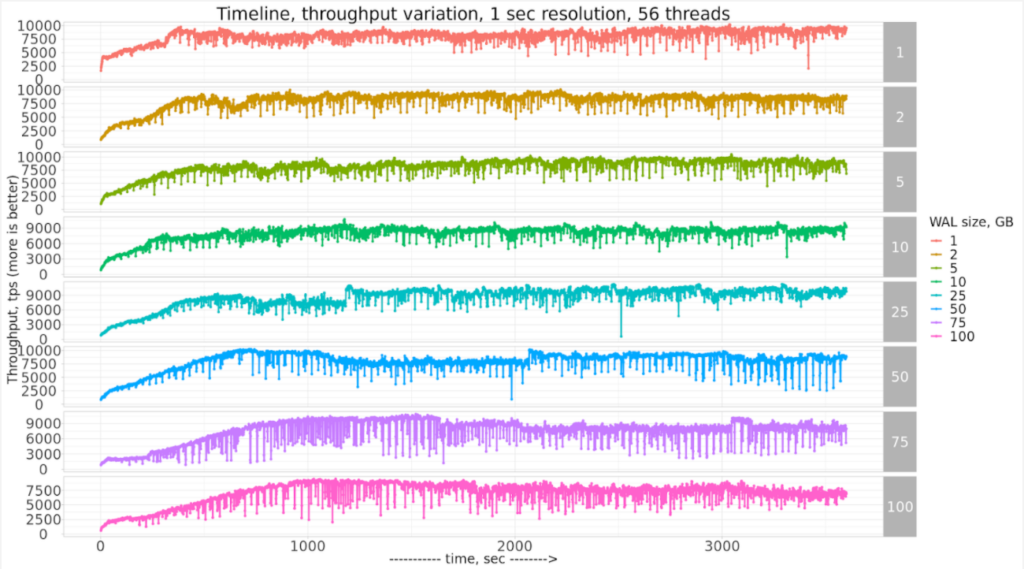
This seems to improve the saw-like pattern, but there are micro-drops that are concerning.
If we zoom in only to 50GB WAL size, we can see it in detail:
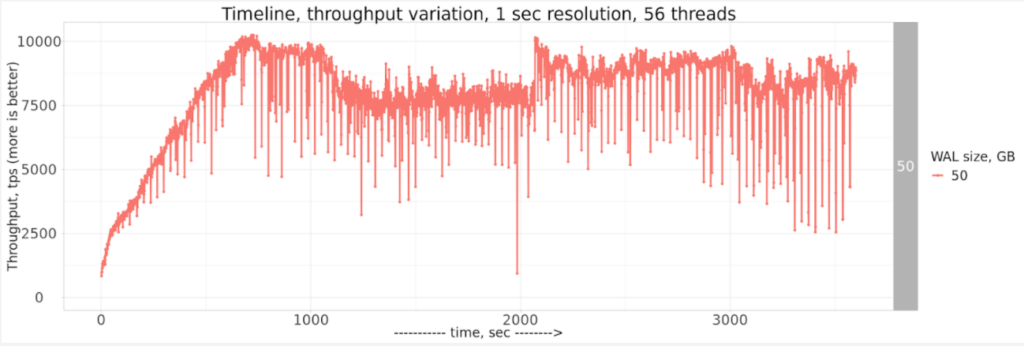
I would be interested to hear ideas on how PostgreSQL results in 1-sec resolution can be improved! If you are interested in the raw results and notebooks, it is available here in GitHub.
Our white paper “Why Choose PostgreSQL?” looks at the features and benefits of PostgreSQL and presents some practical usage examples. We also examine how PostgreSQL can be useful for companies looking to migrate from Oracle.


When not disabling full page writes to the wal, consider running with sizeof(wal) ~= sizeof(shared buffer). Assuming wal compression doesn’t reduce the size of a page, then the worst case is that each page is written to the wal once so the wal should be large enough to store all pages that are in shared buffers. This might not fix the sawtooth pattern but might make it less frequent.
One thing not mentioned in the previous paragraph is that sizeof(wal) might need to be more than sizeof(shared buffers), by 2X or 3X to satisfy the condition.
It will be interesting to compare Postgres and InnoDB for similar amounts of redo relative to the buffer pool size.
Mark,
I’ve posted InnoDB results here https://www.percona.com/blog/2020/07/29/checkpointing-in-mysql-and-mariadb/