
 Many years ago I was banned from touching anything of critical importance as far as production infrastructure goes…something about “the leadership curse”, so the multiple layers of monitoring and notifications I once wrestled with were now overkill for my needs. What that means is that even though Percona Monitoring and Management (PMM) now integrates with Prometheus AlertManager, it’s just too much for what I’m doing on a day-to-day basis…I will not be responding to a page at 3 am because my little test application server’s I/O is too high! That doesn’t mean I don’t want to know when things happen, but instant notification isn’t critical; I can investigate later after a few cans of Diet Mtn Dew…so I figured I’d enable mail to be able to configure alerts natively in Grafana.
Since this was more for personal use, I figured I’d start with my home setup…which is just a simple postfix server on a VM for use as a queue inside my house (I had a much less reliable ISP at the time). As I thought about the rest of the world, I figured I’d see what additional steps were necessary to integrate with the two most likely corporate options: Gmail and Office 365. Just for fun, I’ll outline two ways to configure: by updating the grafana.ini inside the container, or by initializing your container with environment variables.
We’ll start with the grafana.ini method. Now before we get to the fun part, I need to call out that there are still several configuration scenarios that do not survive upgrades – and this is one of them. To combat this, I have backups of my grafana.ini (and other changes) on my persistent storage volume (/srv/configs for me)…so make sure you keep a copy of the files you change either in a persistent container or on your local system. If you do a docker container upgrade of PMM you WILL lose your work and for now, if we (the PMM team), make a significant change to grafana.ini, it will replace your changes even on an in-place upgrade.
Ok, on to the fun stuff! I’m not even going to talk about the vanilla SMTP since it’s just a matter of plugging in the hostname and user/pass if needed. Office 365 was a little more involved, though, and there were some unexpected gotchas I had to overcome.
The basic flow for all systems
→$sudo docker exec -it pmm-server bash
→##cd /etc/grafana
→## vi grafana.ini
in the SMTP section
|
1 2 3 4 5 6 7 8 9 10 11 12 13 14 |
[smtp] enabled = true host = smtp.office365.com:587 user = <o365 username> password = <o365 Password> ;cert_file = ;key_file = skip_verify = false from_address = <o365 username> ;from_name = Grafana ;EHLO identity in SMTP dialog (defaults to instance_name) ;ehlo_identity = dashboard.example.com [emails] ;welcome_email_on_sign_up = false |
→ ## supervisorctl restart grafana
→ ## exit
Here are the gotchas though:
Gmail was a little more fun since I tested it on our corporate system with Multifactor enabled, which meant we’d need application passwords. This time I’m showing how to do it by passing environment variables in your docker container creation. There’s a gotcha here too…if you already have PMM installed with any custom parameters or environment variables, then you’ll need them in addition to what’s below, and you should also be using a persistent data container or you will lose whatever data you had. This means you’ll need to reregister all your clients and have no history for them; do yourself a favor…run pmm with the data container!
|
1 2 3 4 5 6 7 8 9 10 |
# Docker run -d -p 80:80 -p 443:443 --volumes-from pmm-data --name pmm-server --restart always -e GF_SMTP_ENABLED=true -e GF_SMTP_HOST=smtp.gmail.com:587 -e GF_SMTP_USER=<gmail username> -e GF_SMTP_PASSWORD=<gmail password> -e GF_SMTP_SKIP_VERIFY=false -e GF_SMTP_FROM_ADDRESS=<gmail email address> -e GF_SMTP_FROM_NAME=Grafana percona/pmm-server:2 |
The Gmail gotchas
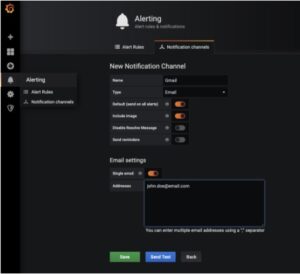
So there you have it…once you’ve got the SMTP server configured you can log in to Grafana as an admin and create a “notification channel”. From that point forward you can use that notification channel on any Grafana alerts you’d like to create. If you’re monitoring hundreds or even thousands of systems this will probably become too tedious to maintain all the alerts and you’ll want to look at setting up an external alert manager.
You may also have noticed there’s a “welcome on signup” in the SMTP section of the grafana.ini. If you coupled that with an LDAP/AD integration you could customize the welcome email to send new users to the FAQ and avoid the myriad of “How do I…” questions that are likely headed your way! Try it out and let us know how you use email integration in Grafana!


This is Just Awesome Solution . Kudos for the great article Steve